Rank 1
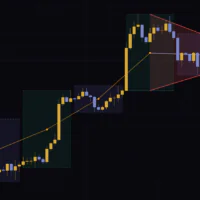
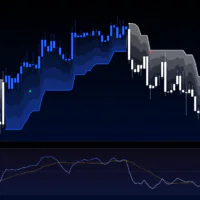
“Isotropic Trend Lines” Review: σ-Scaled Trend Angles and a Six-Timeframe Vote Tested on Live Charts
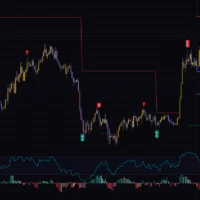
Smart Trader, Episode 06, Isotropic Trend Lines
Compare the TradingView indicators traders are reading right now by period, category, difficulty, star rating, and trading style. Not sure where to start? Check out Vowars Picks, our hand-picked recommendations.
See what traders are reading now, from the last 24 hours to all time
Smart Trader, Episode 06, Isotropic Trend Lines
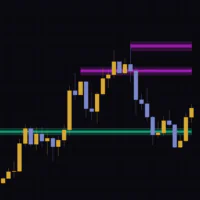
Whale Liquidity and Absorption Profile
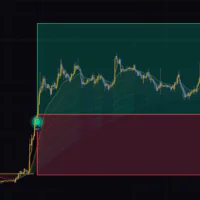
Strong Contrarian Zones | ProjectSyndicate
Buy-Sell Signals using Multi-Logic Trading System
Dual-Phase Reversal by DGT
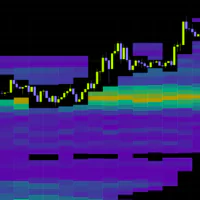
Volume Delta Footprint Map
BTC Power-Law Ladder (Point-in-Time)
Quant Regime Oscillator [JOAT]
The most-read indicators in each category, from trend to oscillators
Buy-Sell Signals using Multi-Logic Trading System
The Market Time Cycle (Expo)
Trend Target Ribbon [BOSWaves]
Structure-Anchored VWAP
Find indicators that fit your level: Beginner, Intermediate, or Advanced
Smart Trader, Episode 06, Isotropic Trend Lines
Strong Contrarian Zones | ProjectSyndicate
Buy-Sell Signals using Multi-Logic Trading System
Dual-Phase Reversal by DGT
Volume Delta Footprint Map
Sorted by Vowars star rating, with ties broken by readership
Regression Slope Oscillator
Adaptive Ehlers Filtered Percentile
BTC Power-Law Ladder (Point-in-Time)
Real Fair Value Gaps [GBB]
RSI Bottom/Top Retest Scalper
LTF Volume Microburst Bubbles
Polynomial/Linear Regression Volume Profile
Fibonacci Trend Continuation Signals
Our current favorites, picked for reasons star ratings can't capture
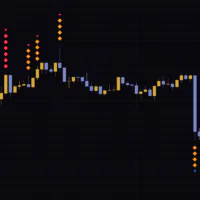
"Strong Burst Fader" is a mean-reversion indicator that measures how far a wick pushes beyond a moving-average-plus-ATR envelope and prints that depth as a stack of diamonds whose height and color both scale with the stretch. Taller and redder means more overextended.
Divergence for Many Indicators v4
"Divergence for Many Indicators v4" is a TradingView indicator that detects divergence across 10 indicators, including RSI and MACD, and shows how many line up in a single label. Signals come early, but only the last one survives within the same swing. It works best once you've defined market direction.
Most popular indicators for scalping, with trades lasting seconds to minutes
Whale Liquidity and Absorption Profile
Volume Delta Footprint Map
Squeeze AI - Breakout Direction Probability
Real Fair Value Gaps [GBB]
Keltner Channel Trend + SMC Liquidity Sweep
Most popular indicators for day traders who close out before the session ends
Smart Trader, Episode 06, Isotropic Trend Lines
Whale Liquidity and Absorption Profile
Strong Contrarian Zones | ProjectSyndicate
Buy-Sell Signals using Multi-Logic Trading System
Dual-Phase Reversal by DGT
Most popular indicators for swing trades held for days to weeks
Smart Trader, Episode 06, Isotropic Trend Lines
Whale Liquidity and Absorption Profile
Strong Contrarian Zones | ProjectSyndicate
Buy-Sell Signals using Multi-Logic Trading System
Dual-Phase Reversal by DGT
Indicators for holding weeks to months and riding the bigger trend
Dual-Phase Reversal by DGT
BTC Power-Law Ladder (Point-in-Time)
The Market Time Cycle (Expo)
Coppock Curve Multi-Filter
Vowars analyzes and breaks down community-built indicators published on TradingView against its own criteria, then publishes the results as review articles. This page organizes those articles into rankings, so use it as a guide for finding the indicator that fits what you are trying to do.
Compiled from actual article views. Indicators near the top of the shorter windows are the ones that suit current market conditions, or simply the ones people are talking about right now. Indicators that hold their place across the longer windows are the staples that stay useful whatever the season.
Grouped by the role an indicator plays. Looking for something to trade with the trend? Start with Trend and Momentum. Timing a reversal? Oscillator and Reversal. Need confirmation behind a move? Volume. When you already know what you need, this is the shortest route to it.
Ordered by the star rating shown at the top of each review. Because it is compiled independently of view counts, indicators that are little known but genuinely capable tend to rise here. It is the place to look when you are after the useful tools that stay hidden.
The star rating on each review is an overall guide drawn from scores on the five criteria below.
[Effectiveness] How fully it delivers what its author set out to do
[Originality] Whether it brings a perspective, structure or presentation existing indicators lack
[Clarity] Whether you can read what it tells you, once it is on the chart, without misreading it
[Flexibility] Whether it can be fitted to your instrument, timeframe and style of trading
[Reliability] Whether you can take what is on screen at face value and act on it
The overall score is the average of the five, which carry equal weight. Points come off only in a small number of defined cases, such as a gap between what the author describes and what the indicator actually does.
Note: an indicator built for a narrow purpose will score lower for that reason. That is a characteristic rather than a weakness, and in the situations it was designed for it will outperform general-purpose alternatives.
The bands for each criterion, the cases that draw a deduction and how the overall score is calculated are all published on our Rating Standards page.
This is not a measure of quality. It groups indicators by how much prior knowledge is needed to handle them.
[Beginner] Works largely as intended on its default settings.
[Intermediate] Assumes you understand what the parameters mean and will adjust them.
[Advanced] Requires combining it with other tools, or understanding a concept unique to it.
For the full policy on how indicators are selected and how they are tested, including analysis on Bitcoin charts, see About us.
Add Vowars as a preferred source
See more Vowars articles in Google's Top Stories and AI answers. Google's settings page will open. Select Vowars there.
Add on GoogleNew article notifications
Get a browser notification when we publish a new indicator review. You can turn it off at any time.