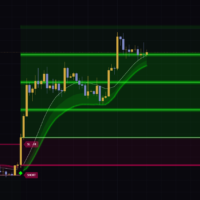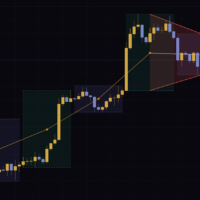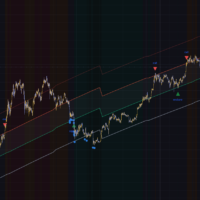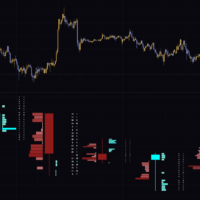


“VWAP Deviation Trend” calls the trend only when price moves far enough from the volume-weighted center
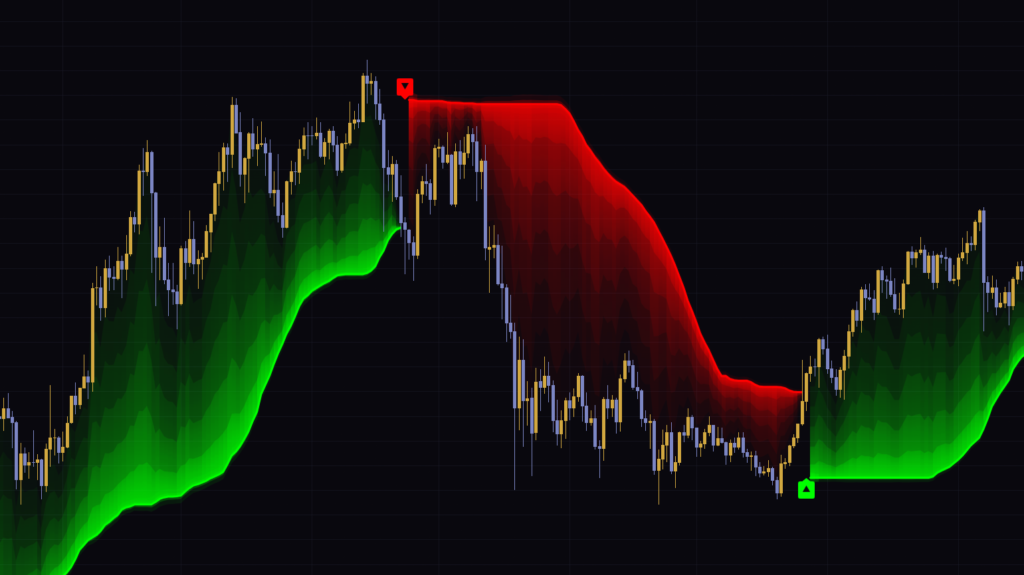
“VWAP Deviation Trend” is a trend-following indicator published on TradingView by BackQuant. It builds bands around VWAP (volume-weighted average price) using a volume-weighted standard deviation, then turns those bands into a one-way trail that can only ratchet in one direction to decide whether the market is bullish or bearish right now.
On the chart you only ever see one line: either a green line trailing below price or a red line pressing down from above. The bar where the color flips gets a ▲ or ▼. It looks a lot like Supertrend. The big difference is that Supertrend is centered on the average of the high and low, while this one is centered on the price where volume actually traded.
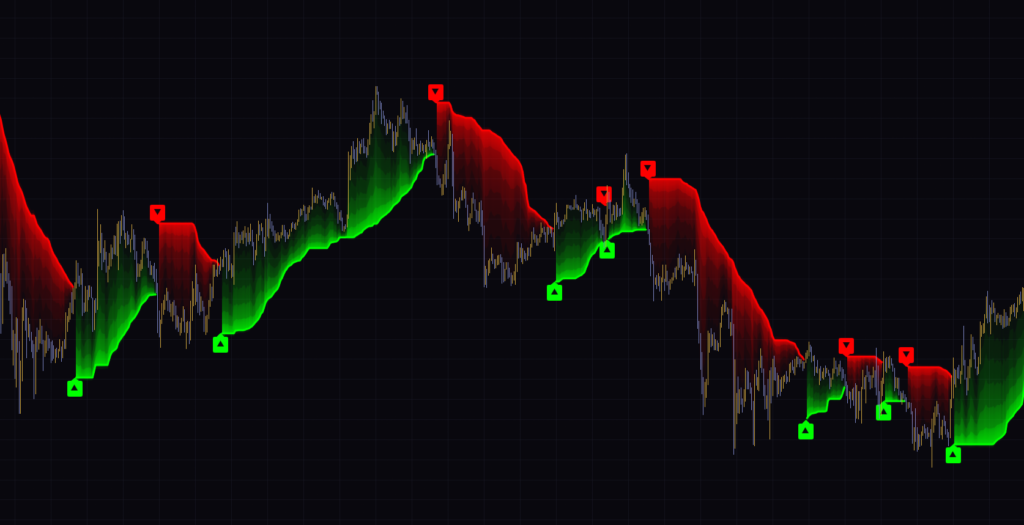
When I first loaded it on a 1-hour chart, my honest reaction was: price crosses VWAP and the color doesn’t budge. At first I thought it was just slow, but once I dug into how it works, it’s clear it was built this way on purpose. In this review I’ll walk through why, with diagrams, and then cover which timeframes and settings make it easiest to work with.
Whether the market is bullish (green) or bearish (red) right now, and the bar where the trend flipped (▲▼). On top of that, the distance from price to the trail gives you a rough idea of how deep a pullback can go before the call breaks. Used as a filter for trade direction, this is where the indicator really shines.
Five things show up on the chart. Start with the color and position of the trail
It looks busy, but only the trail and the ▲▼ markers drive the actual signal. The gradient and glow just control how strongly that call is displayed.
| Element | What you see | What it means |
|---|---|---|
| Trail | A thick green line below price when bullish, a red line above price when bearish | The current direction and the price level that triggers a flip |
| Gradient | Six layers of fill from the trail to price, darkest near the trail | How far price is from the trail; a rough read on momentum |
| Glow | A thin glow around the trail that gets brighter for a few bars right after a flip | Purely cosmetic; doesn’t affect the signal |
| Candle color | Painted green while bullish and red while bearish (same color for up and down candles) | Shows the direction at a glance |
| ▲▼ | Prints on the flip bar, at the new trail level | A switch between bullish and bearish |
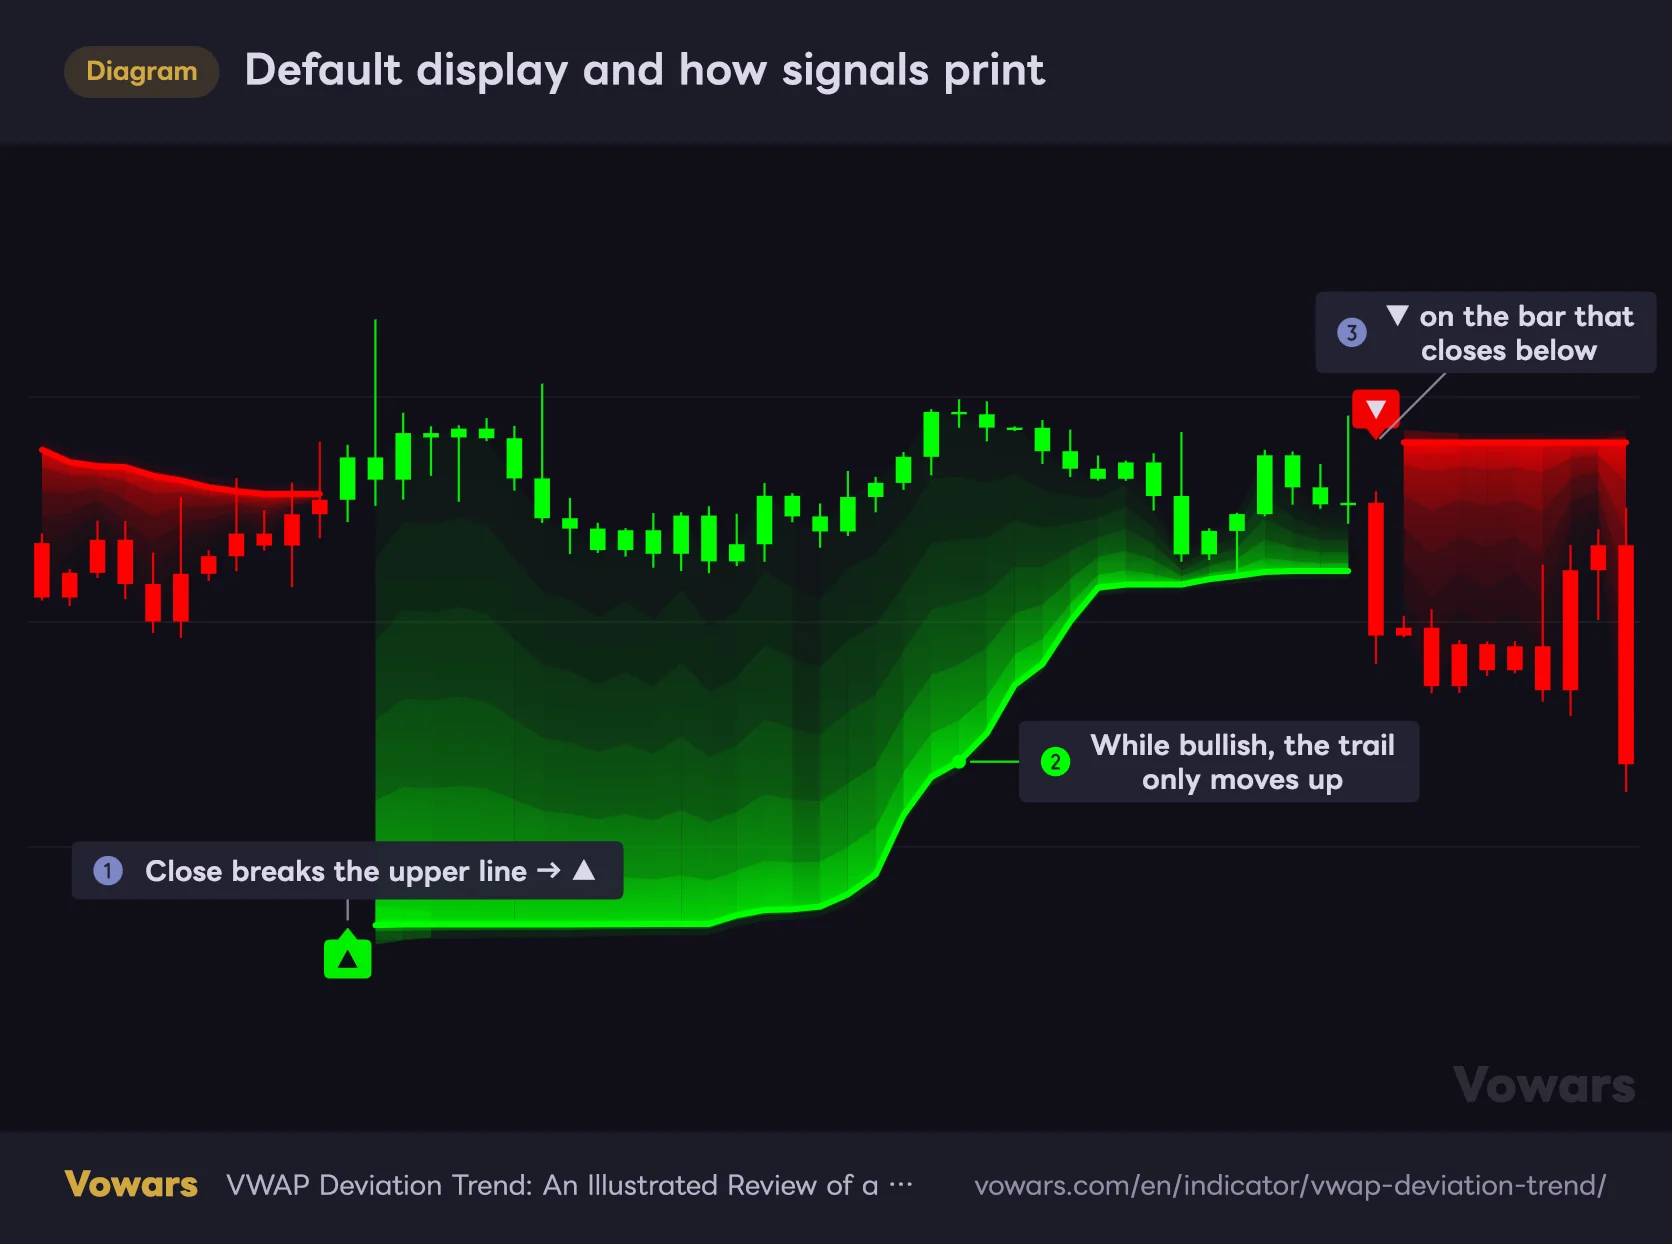
Default display and how signals print
While bullish, the green trail follows below price. When a close breaks the line on the opposite side, ▲▼ prints and the color and position switch.
Vowars DE ver.3.11.0
As shown in ① of the diagram, ▲ prints on the bar that closes above the red trail. From there the trail moves below price, and as long as the bullish trend holds, it only moves up, as in ②. Then, on the bar that closes below the green trail, ▼ prints and the red trail takes over, tracking price from above.
One thing that threw me off at first: by default, the candles themselves get painted green and red. During a bullish phase even down candles turn green, so it’s hard to tell up bars from down bars. If you want to see your candles as they are, turn off Color Candles and they go back to their normal colors.
On the flip bar, the trail is intentionally left undrawn, so the old and new lines don’t connect. That’s because Break Trail On Flips is on; joining the old and new trail with a vertical line would suggest a price move that never happened. Turn it off and the line connects, but only the display changes, not the signal.
Why crossing VWAP doesn’t flip the color: the three-step logic, broken down
“VWAP Deviation Trend” works in three steps: build VWAP and the bands, turn the bands into trails, and flip when a close breaks the trail. Go through them in order and the sluggishness starts to make sense.
Building volume-weighted bands around VWAP
VWAP is the average price over a period, weighted by volume. Prices where more volume changed hands count for more, so it represents the center of gravity where most participants bought and sold. By default the indicator uses Rolling (Lookback: Bars), which recalculates over the last 50 bars, with the average of high, low and close (hlc3) as the price input.
Next, it measures how widely prices are spread around that center using a volume-weighted standard deviation. When heavy volume trades across a wide range, the deviation gets bigger; when trading stays in a tight range, it gets smaller. Multiply that deviation by Deviation Multiplier (default 1.5) and you get the band width.
The catch is that in quiet markets the deviation can get so small that a tiny move flips the signal. So when ATR Minimum Width is on, ATR (average true range) times 0.35 is used as a floor, and the bands never get narrower than that.
Turning the bands into one-way trails
The VWAP ± width bands built this way move freely: outward when the deviation expands, inward when it contracts. “VWAP Deviation Trend” doesn’t use them as-is. The lower band follows the rule “while price closes above it, it can’t drop below the previous bar’s level,” and the upper band follows “while price closes below it, it can’t rise above the previous bar’s level.” That’s what turns them into trails.
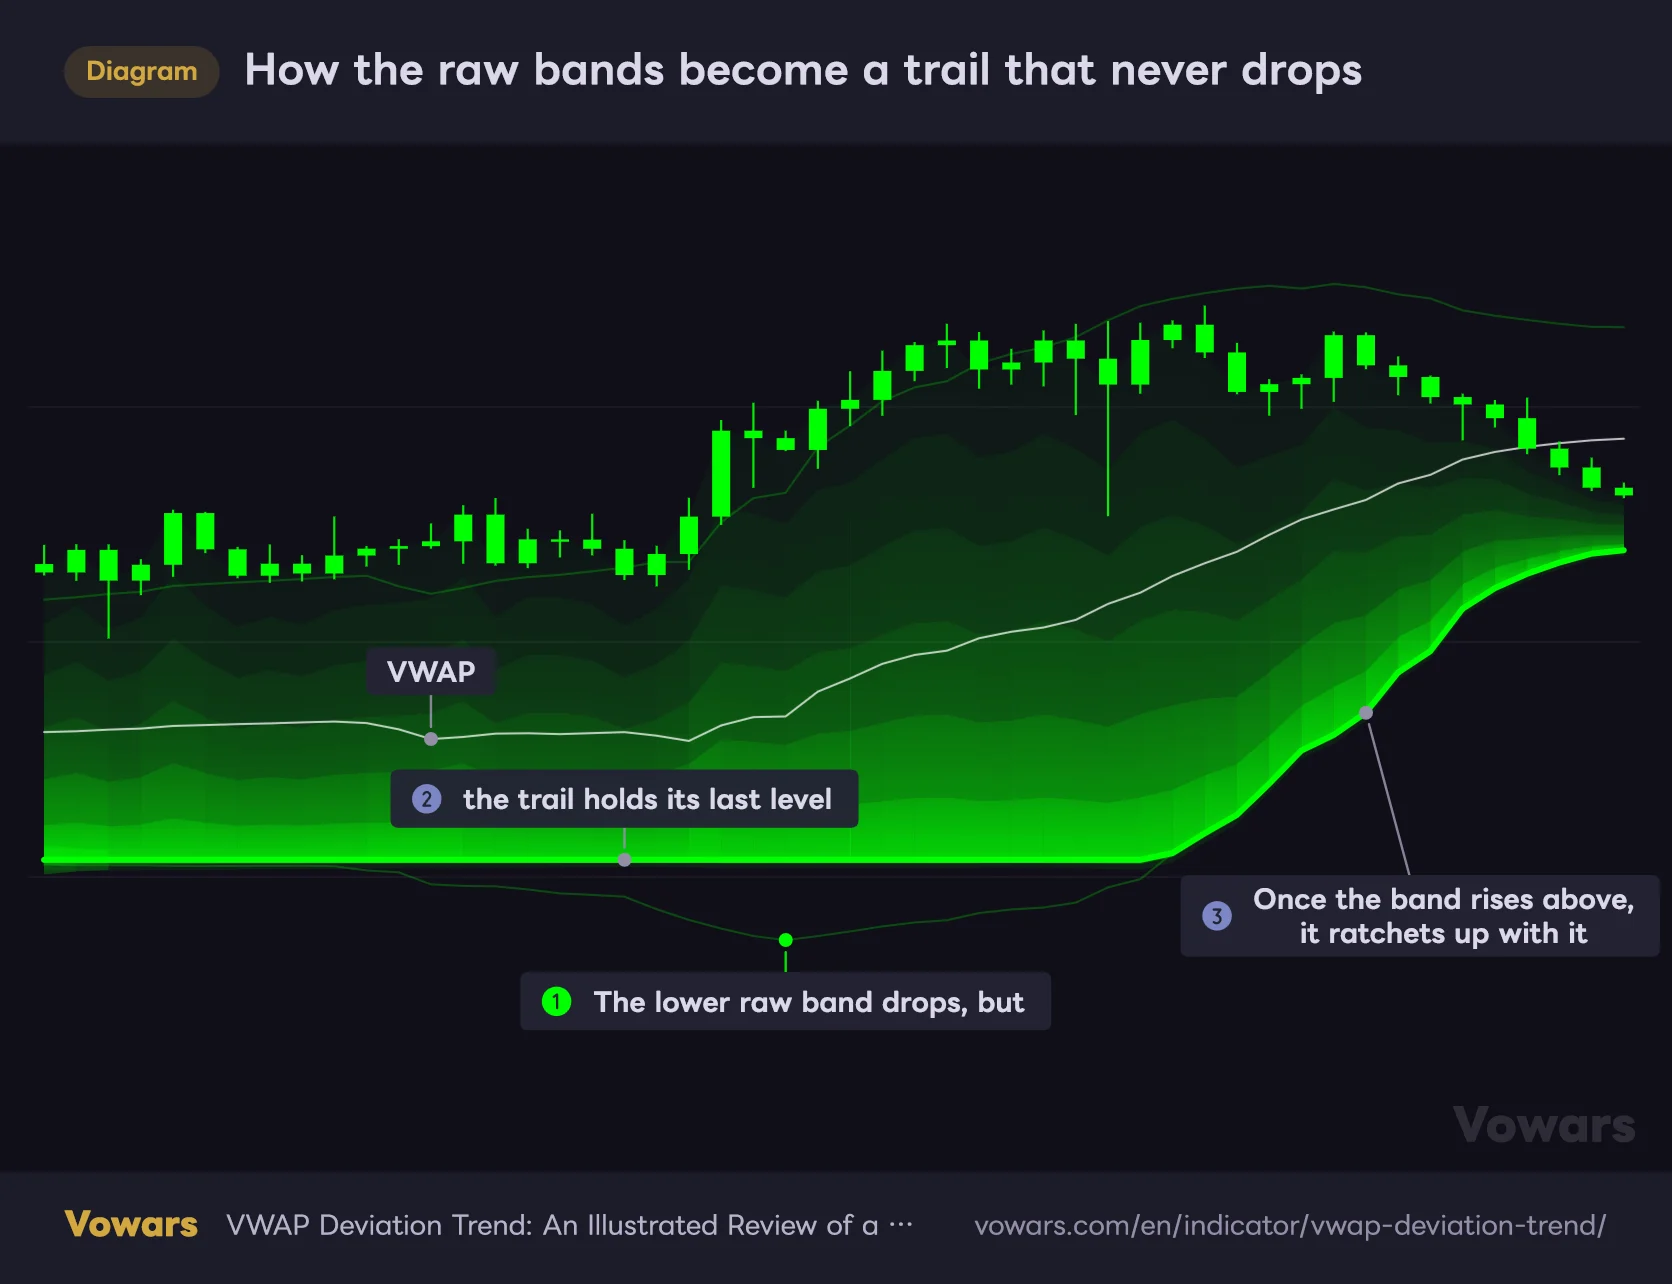
How the raw bands become a trail that never drops
The raw VWAP ± width bands swing up and down, but in a bullish phase the trail ignores the down moves and only follows them up.
Vowars DE ver.3.11.0
In ① of the diagram, the deviation expands and the lower band moves down. Even so, the green trail stays put at its previous value, as in ②. Once the band climbs back above that level, the trail ratchets up with it, as in ③.
Because of this, the trail in a bullish phase works as the line where “if the pullback gets this deep, the bullish call is broken.” The author also suggests using the trail as a trailing stop reference and a position-management guide.
What triggers a flip is a close through the trail, not a VWAP cross
This is the most important part. The condition for turning bullish is a close above the upper trail (the red line shown during a bearish phase). Conversely, it turns bearish when price closes below the lower trail (the green line).
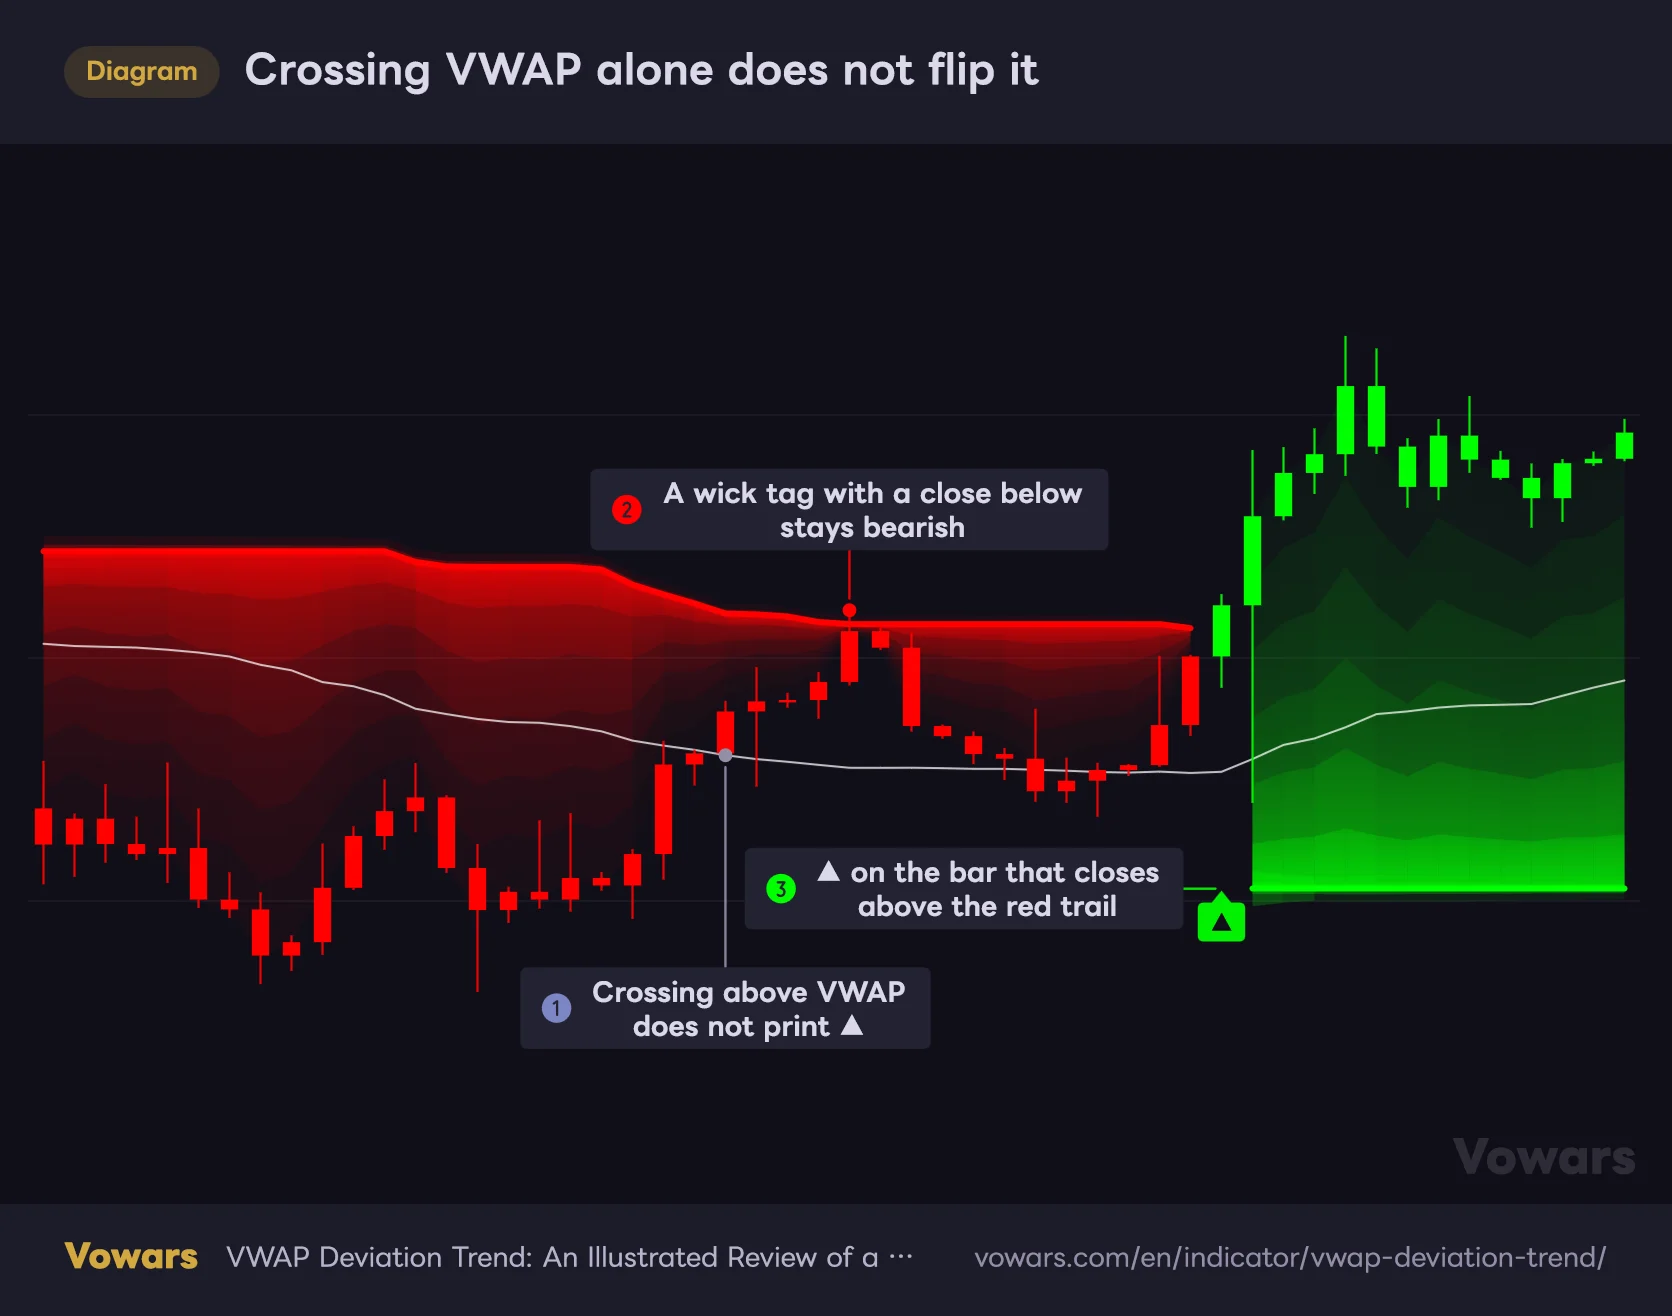
Crossing VWAP alone does not flip it
Price crosses above VWAP while still bearish, and no ▲ prints. It only turns bullish on the bar that closes above the red trail.
Vowars DE ver.3.11.0
The trail sits at least one band width away from VWAP. So even when price crosses above VWAP, as in ①, nothing changes yet. Even if a wick tags the trail, as in ②, the trend stays bearish as long as the close gets pushed back down. Only on the bar that clearly closes above, as in ③, does ▲ finally print.
The threshold for going bullish and the threshold for going bearish are a full band width apart, so price chopping back and forth around VWAP doesn’t easily flip the color. The sluggishness I noticed on the 1-hour chart turned out to be a buffer built in to cut down fakeouts.
One more note: on the very first bar the indicator calculates on, the state is set to bullish if the close is above VWAP and bearish if it’s below. No ▲▼ prints on that first bar.
How VWAP Deviation Trend differs from Supertrend and Bollinger Bands
| VWAP Deviation Trend | Supertrend | Bollinger Bands | |
|---|---|---|---|
| Center | VWAP (volume-weighted) | Average of high and low | Simple moving average |
| Band width | Volume-weighted standard deviation (ATR only as a floor) | ATR | Standard deviation (unweighted) |
| Line behavior | One-way trail | One-way trail | Symmetric, moves freely up and down |
| Trend state | Holds a bullish/bearish state | Holds a bullish/bearish state | None |
Like Supertrend, it holds its state with a trail, but because the width is driven mainly by volume-weighted deviation, the bands widen when the range of high-volume prices widens. Also keep in mind that, unlike Bollinger Bands, you’re not meant to read a move outside the bands as overextended.
If volume over the whole window is zero (no data), it drops the volume weighting and calculates a simple average and simple standard deviation of price instead. According to TradingView’s help center, FX pairs and CFDs from FOREX.COM, TVC symbols, and most indices have no volume data (as of Sep 23, 2026). On those symbols, read the line as something closer to a moving average.
Even with FX brokers that do show volume, it’s usually tick volume (the number of price updates), not actual traded size. Worth keeping in mind that the weighting means something slightly different there.
Gradient intensity is a momentum gauge, but the difference is subtle
Separately from the signal, “VWAP Deviation Trend” calculates trend strength as a value from 0 to 1 and uses it to set the gradient intensity and glow width. It’s 70% the distance between price and the trail (relative to band width) and 30% the VWAP slope (relative to band width).
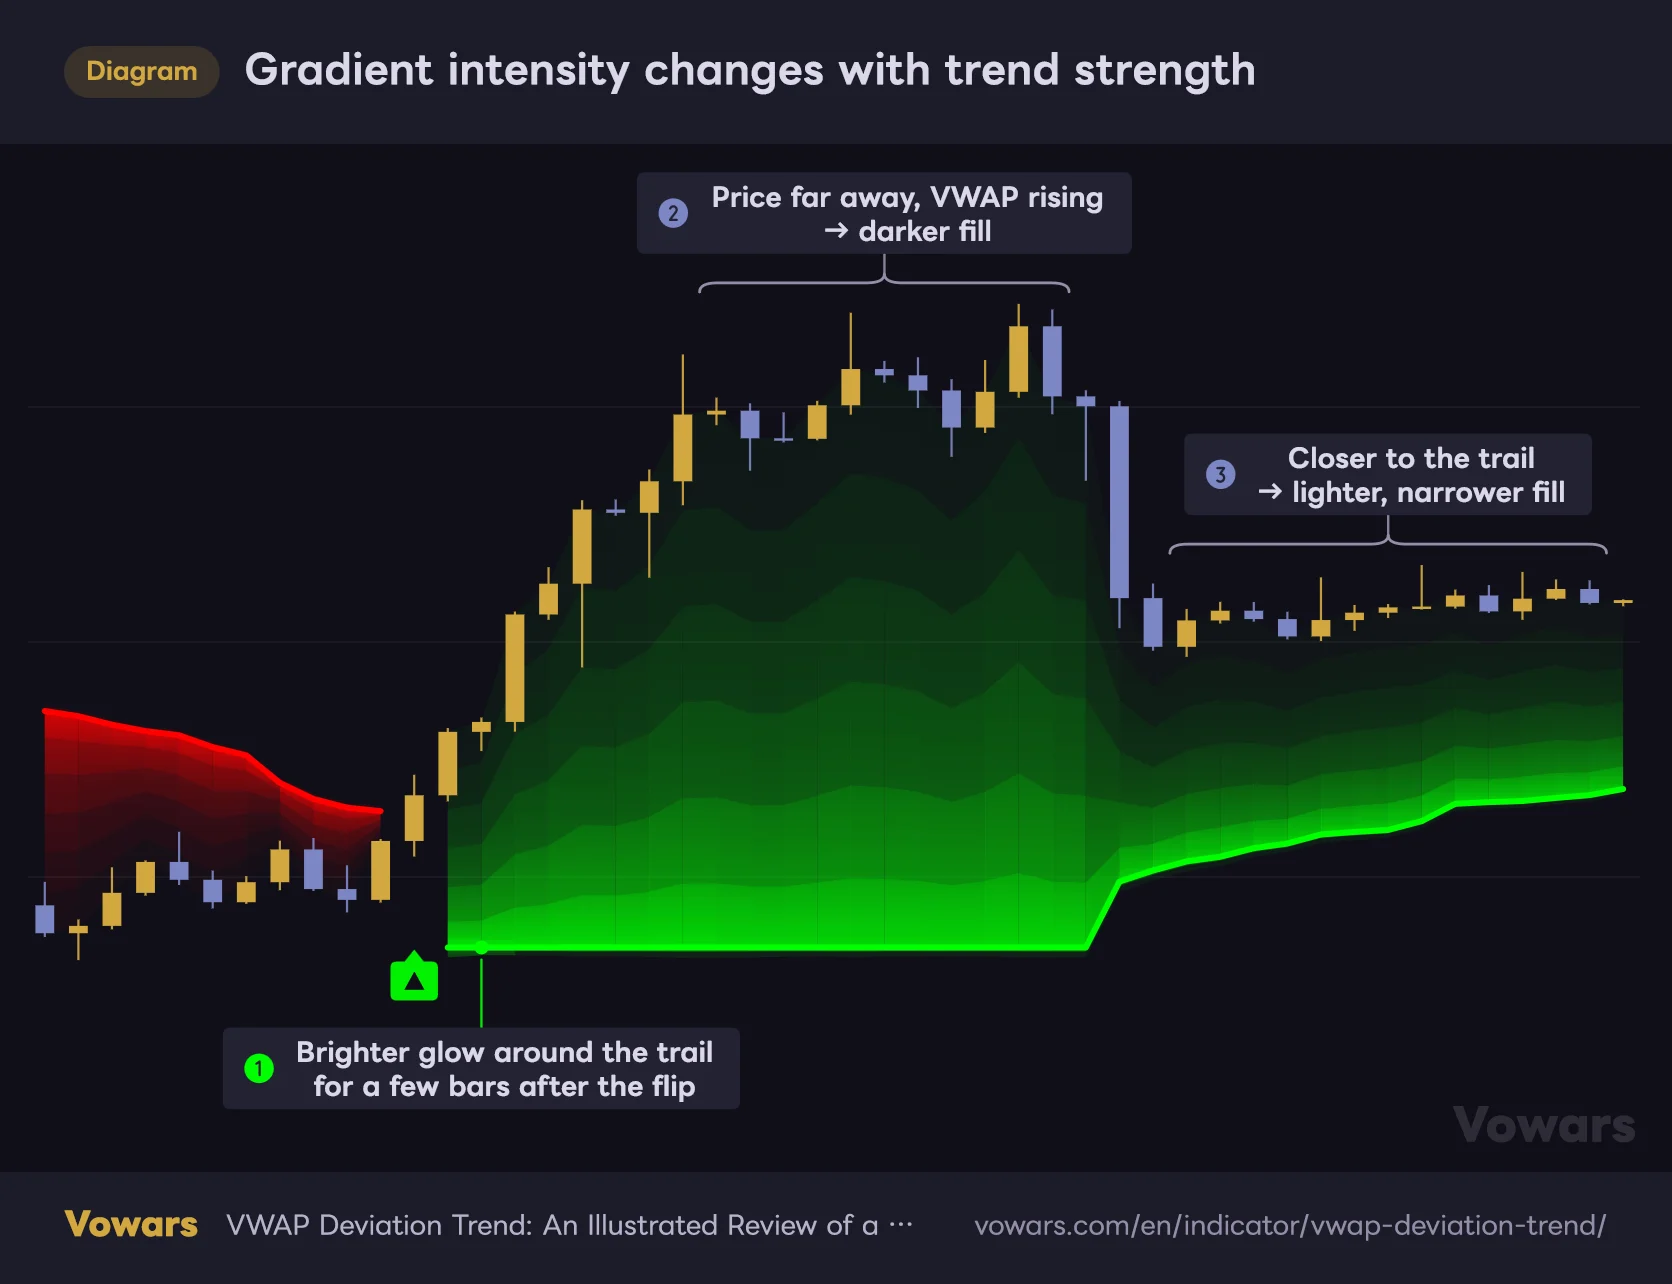
Gradient intensity changes with trend strength
When price is far from the trail and VWAP slopes the same way, the fill is darker. As price closes in on the trail, the fill gets lighter and narrower.
Vowars DE ver.3.11.0
As in ②, when price is well away from the trail and VWAP is also pointing up, the fill gets darker. On the other hand, as in ③, when price moves closer to the trail, the filled area itself shrinks and the color fades. Right after the flip in ①, the area around the trail glows brighter for about three bars.
Honestly, though, the difference in intensity isn’t that big. Even in the darkest layer, transparency only moves from about 56% to 44%. What actually caught my eye while watching the chart was less the intensity and more how wide the filled area was, in other words the distance between price and the trail. The strength display doesn’t affect the signal, so I think it’s best treated as supplementary info.
The VWAP slope is measured against the VWAP from VWAP Slope Lookback bars ago. This value feeds the gradient calculation even with VWAP Slope Confirmation turned off, so changing it can change how the fill looks even though the signals stay the same.
What I learned running it on 1H, 15m and daily charts: where it works and where it struggles
From here on, these are my impressions from running it on real charts. All screenshots use the default settings, with only the candle colors changed.
On the 1-hour chart, the color holds through consolidation
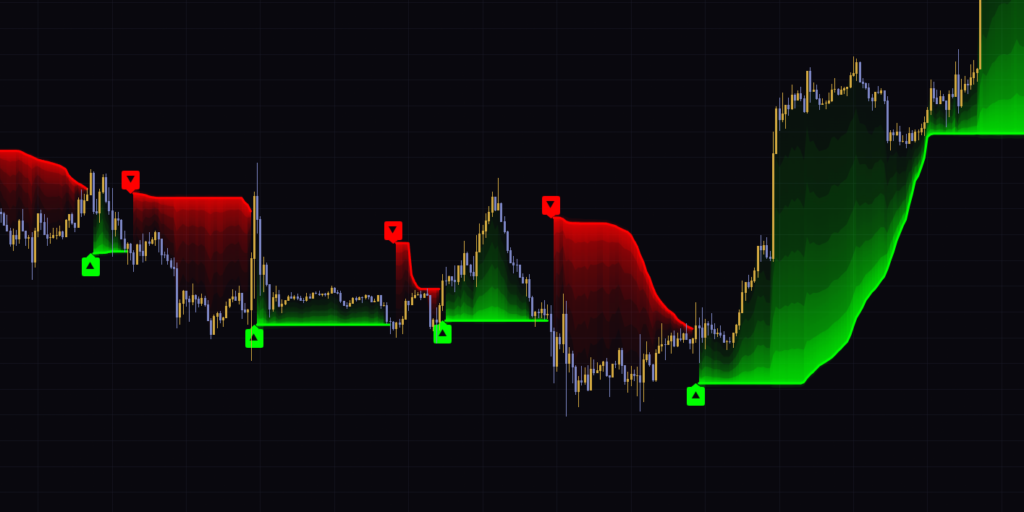
Over about 12 days, ▲▼ printed 7 times. What stood out was that during a sideways stretch in the middle, the green trail stayed almost flat below price the whole time. Price crossed back and forth over VWAP several times, but the color never changed.
On the other hand, in sharp selloffs price had already dropped a fair bit from the high before ▼ printed. Since the flip threshold sits a band width away, it’s never going to flip right at the top or bottom. It’s easier to use if you treat ▲▼ as confirmation that the trend has changed, not as a tool for calling tops and bottoms.
In tight 15-minute chop, ▲▼ fire back to back
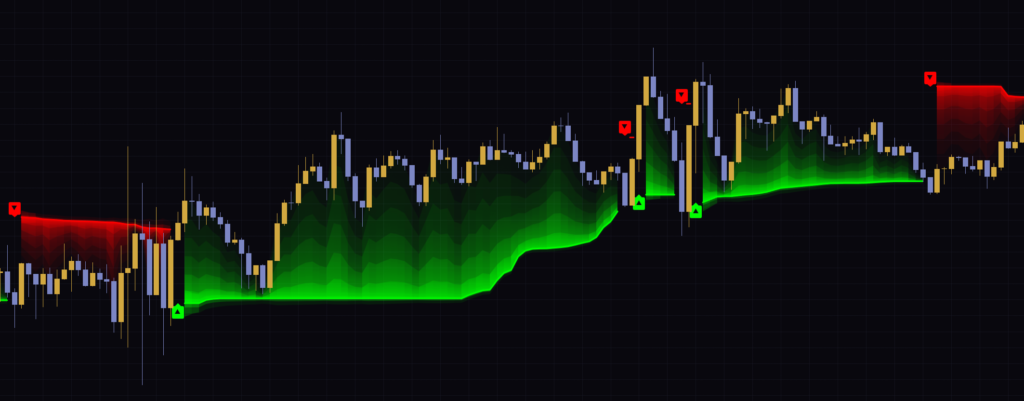
On the 15-minute chart, ▲▼ printed 8 times in about a day and a half. Four of those were packed into roughly three hours, from about 21:00 to midnight on my chart’s clock. When a tight range drags on, the deviation shrinks and the trail creeps right up next to price.
If you’re using it on lower timeframes, the practical fix is to raise Deviation Multiplier or add the slope confirmation covered later. On the 15-minute chart, I found it much calmer to watch with the multiplier bumped up to around 2.0.
On the daily chart, it only fires at major turning points
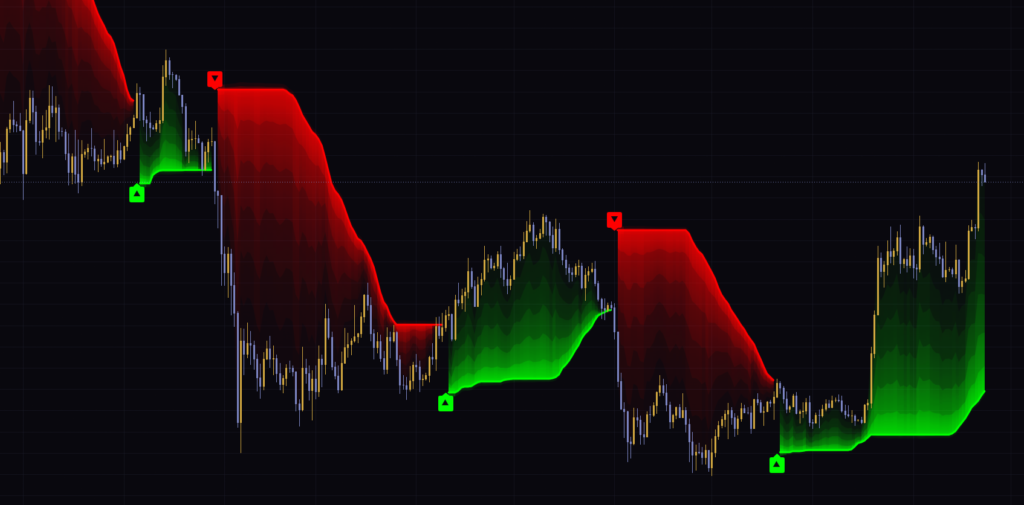
On the daily chart, ▲▼ printed just 5 times in about 10 months. It stayed red through the big declines and green through the rebounds, and pullbacks along the way almost never flipped the color. For anyone holding positions longer who wants to check whether this is a phase to be thinking long, I found it a very good fit.
On symbols with full exchange volume, such as gold futures or stock index futures, the volume-center concept works just as intended. On symbols without volume data, as mentioned earlier, it falls back to a simple average, and that volume-center edge fades.
What each setting does, and how to tune it for your style
The settings are split into four groups: VWAP Calculation, Deviation Bands, Trend Settings, and UI Settings. First, the ones that affect the signal.
| Setting | Default | Suggested | Effect |
|---|---|---|---|
| VWAP Mode | Rolling (Lookback: Bars) | Match it to your timeframe (see below) | The window used to calculate VWAP and deviation. Choose from the anchored modes (4 Hours / Daily / Weekly) or the rolling modes (by bars or by days) |
| Rolling Lookback Bars | 50 | 50–100 | Number of bars used in rolling (bars) mode. Higher values make both the bands and the trail move more slowly |
| Rolling Lookback Days | 30 | 20–30 | Number of calendar days used in rolling (days) mode. Counts up to 5,000 bars max |
| Price Source | hlc3 | hlc3 | Price used to calculate VWAP and deviation |
| Deviation Multiplier | 1.5 | 1.5–2.0 | Multiplier applied to the deviation. Raise it for fewer flips, lower it for more |
| ATR Minimum Width | On | On | Whether to use ATR as a floor for band width. With it off, bands can get too narrow in quiet markets |
| ATR Length | 14 | 14 | ATR period used for the floor. Doesn’t affect the glow width |
| ATR Minimum Multiplier | 0.35 | 0.35–0.5 | Multiplier applied to ATR. Raising it reduces flips during low-volatility periods |
| VWAP Slope Confirmation | Off | On only if fakeouts are a problem | Requires the VWAP slope to agree with the flip direction |
| VWAP Slope Lookback | 2 | 2–5 | Number of bars used to compare the slope. Used in the gradient calculation even when slope confirmation is off |
| Flip Trigger | Close | Close | Price used to trigger a flip. Close uses the closing price; Price Source uses the price selected in Price Source |
| Break Trail On Flips | On | On | Breaks the trail on the flip bar. Display-only setting |
Here are the display settings. They don’t affect the signal, so set them however you find easiest to read.
| Setting | Default | Suggested | Effect |
|---|---|---|---|
| Show Deviation Trail | On | On | Shows the trail. Turning it off also hides the gradient and glow (▲▼ remain) |
| Show VWAP | Off | On if you want VWAP as a pullback reference | Shows VWAP as a white line |
| Show Raw Deviation Bands | Off | On only when you want to check how it works | Shows the pre-trail bands as thin lines |
| Gradient Fill | On | Personal preference | Fill between the trail and price |
| Trail Glow | On | Personal preference | Trail glow and the highlight right after a flip |
| Show Signals | On | On | Shows ▲▼ |
| Color Candles | On | Off if you want to see the candles themselves | Paints candles in the trend color |
| Bullish / Bearish / VWAP | #00ff00 / #ff0000 / #ffffff | Personal preference | Colors for bullish, bearish and VWAP |
| Line Width | 3 | 2–3 | Trail thickness |
Deviation Multiplier matters most
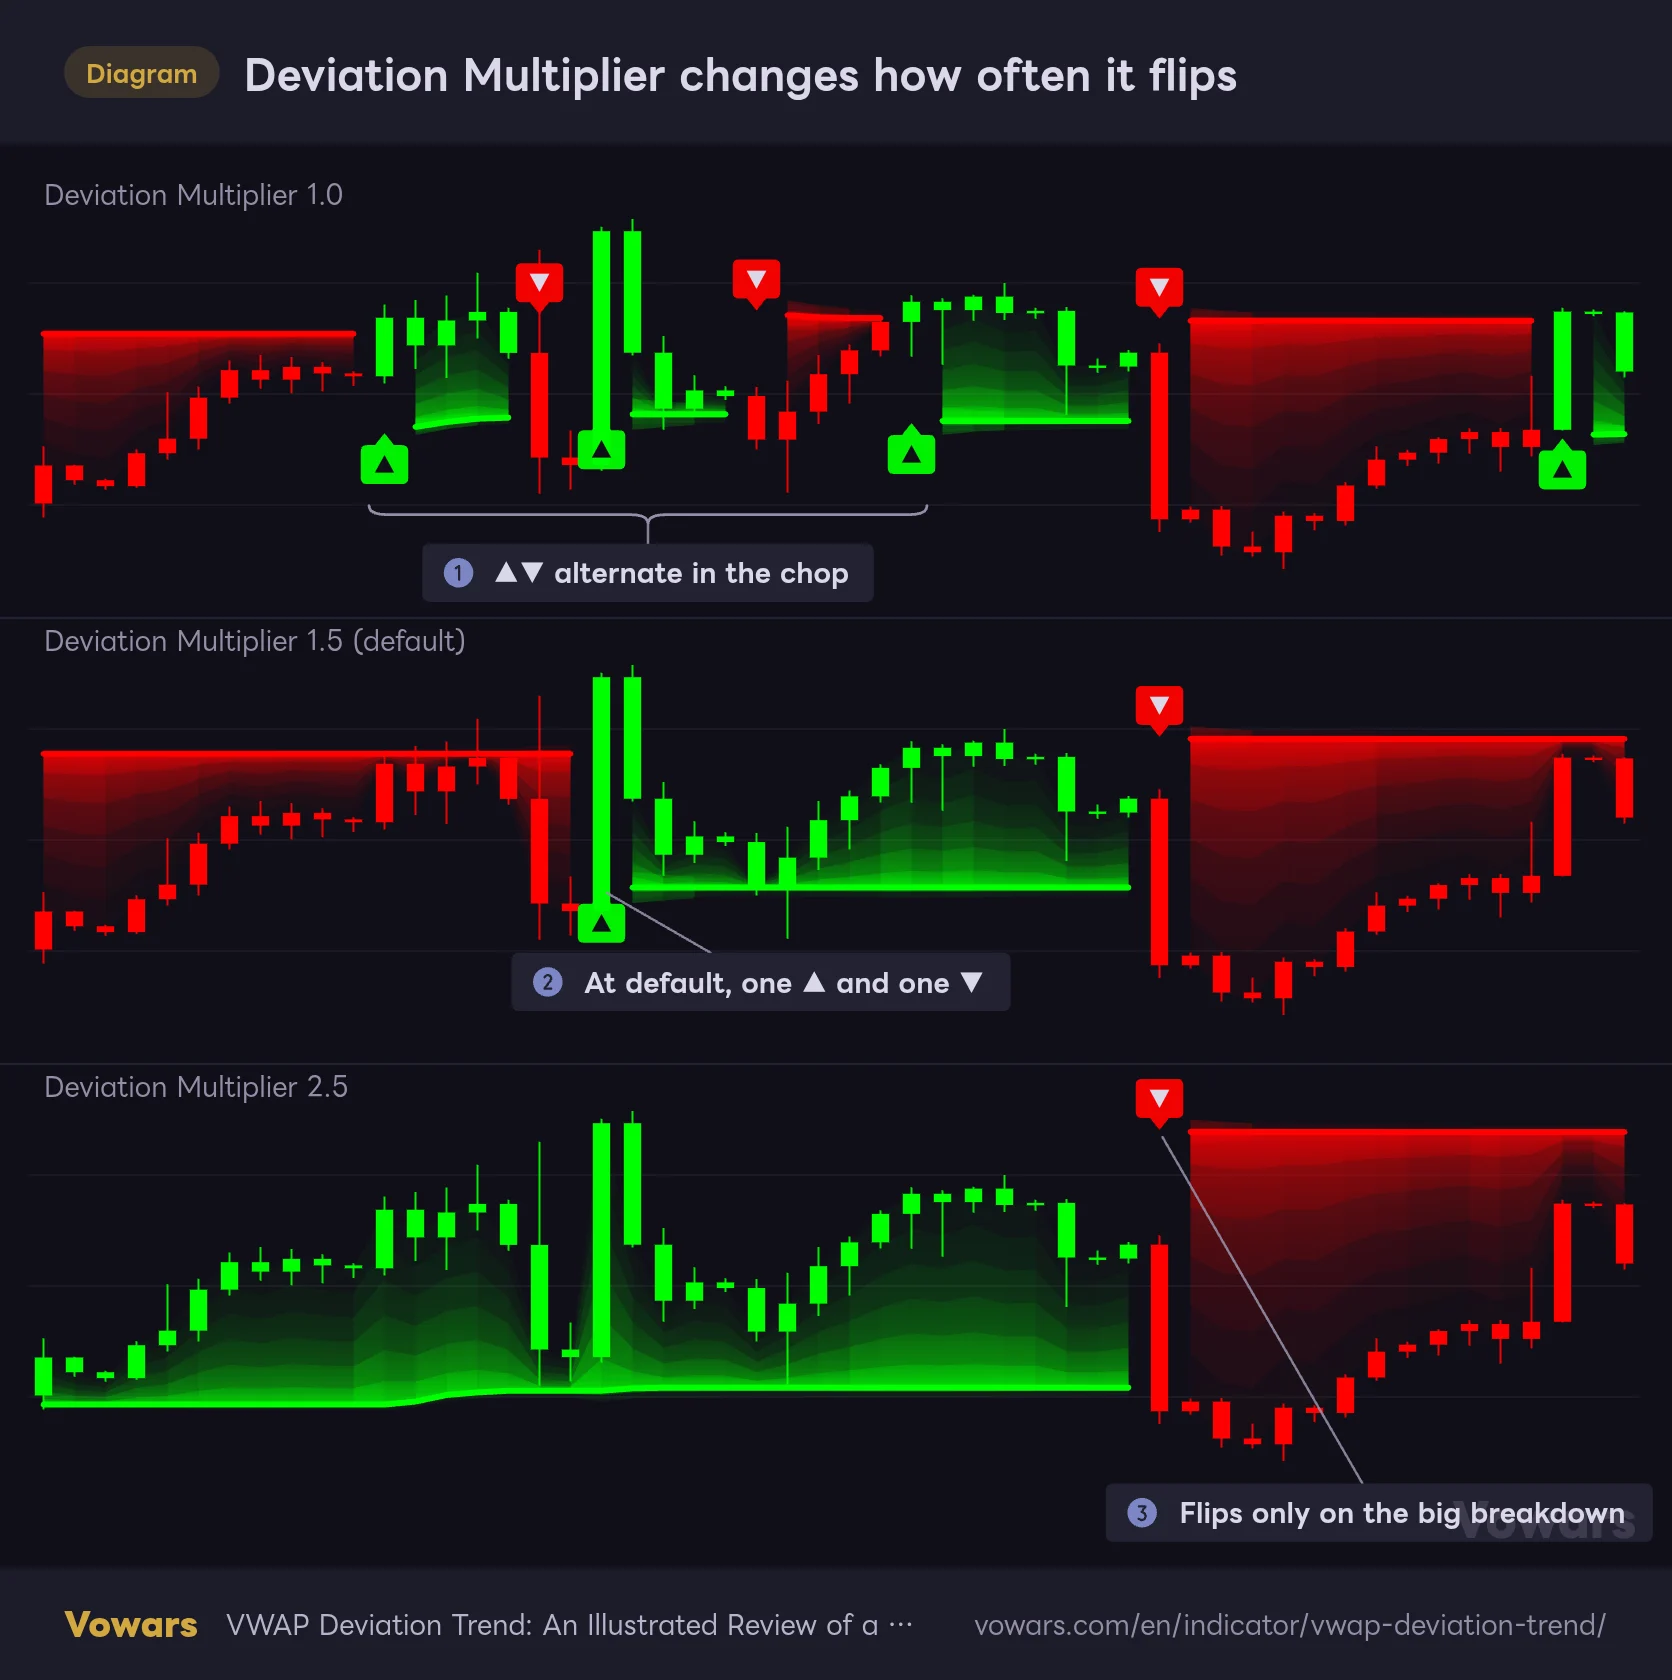
How often it flips comes down almost entirely to Deviation Multiplier. When I ran the same price action with three different multipliers, the difference was obvious.
Deviation Multiplier changes how often it flips
On the same price action, a lower multiplier pulls the trail closer to price and adds flips, while a higher one only flips on big moves.
Vowars DE ver.3.11.0
At 1.0, ▲▼ kept alternating throughout the sideways stretch; at the default 1.5 it flipped twice; and at 2.5 it flipped only once, on the big breakdown. The higher the multiplier, the fewer fakeouts, but you’ll also be later on real reversals.
I suggest 1.5–2.0 because 1.5 is well balanced on 1H and above, and on 15m and below, raising it to 2.0 cut down the back-to-back ▲▼ in chop considerably. Anything at 1.0 or below is hard to recommend unless you’re pairing it with another filter.
Choose VWAP Mode together with your timeframe
The anchored options of VWAP Mode (4 Hours / Daily / Weekly) reset on UTC-based boundaries. Daily resets at 00:00 UTC every day, Weekly at 00:00 UTC on Monday, and 4 Hours at 00:00, 04:00, 08:00, 12:00, 16:00 and 20:00 UTC. These don’t line up with exchange session opens, so be especially careful when using them on things like stock index futures.
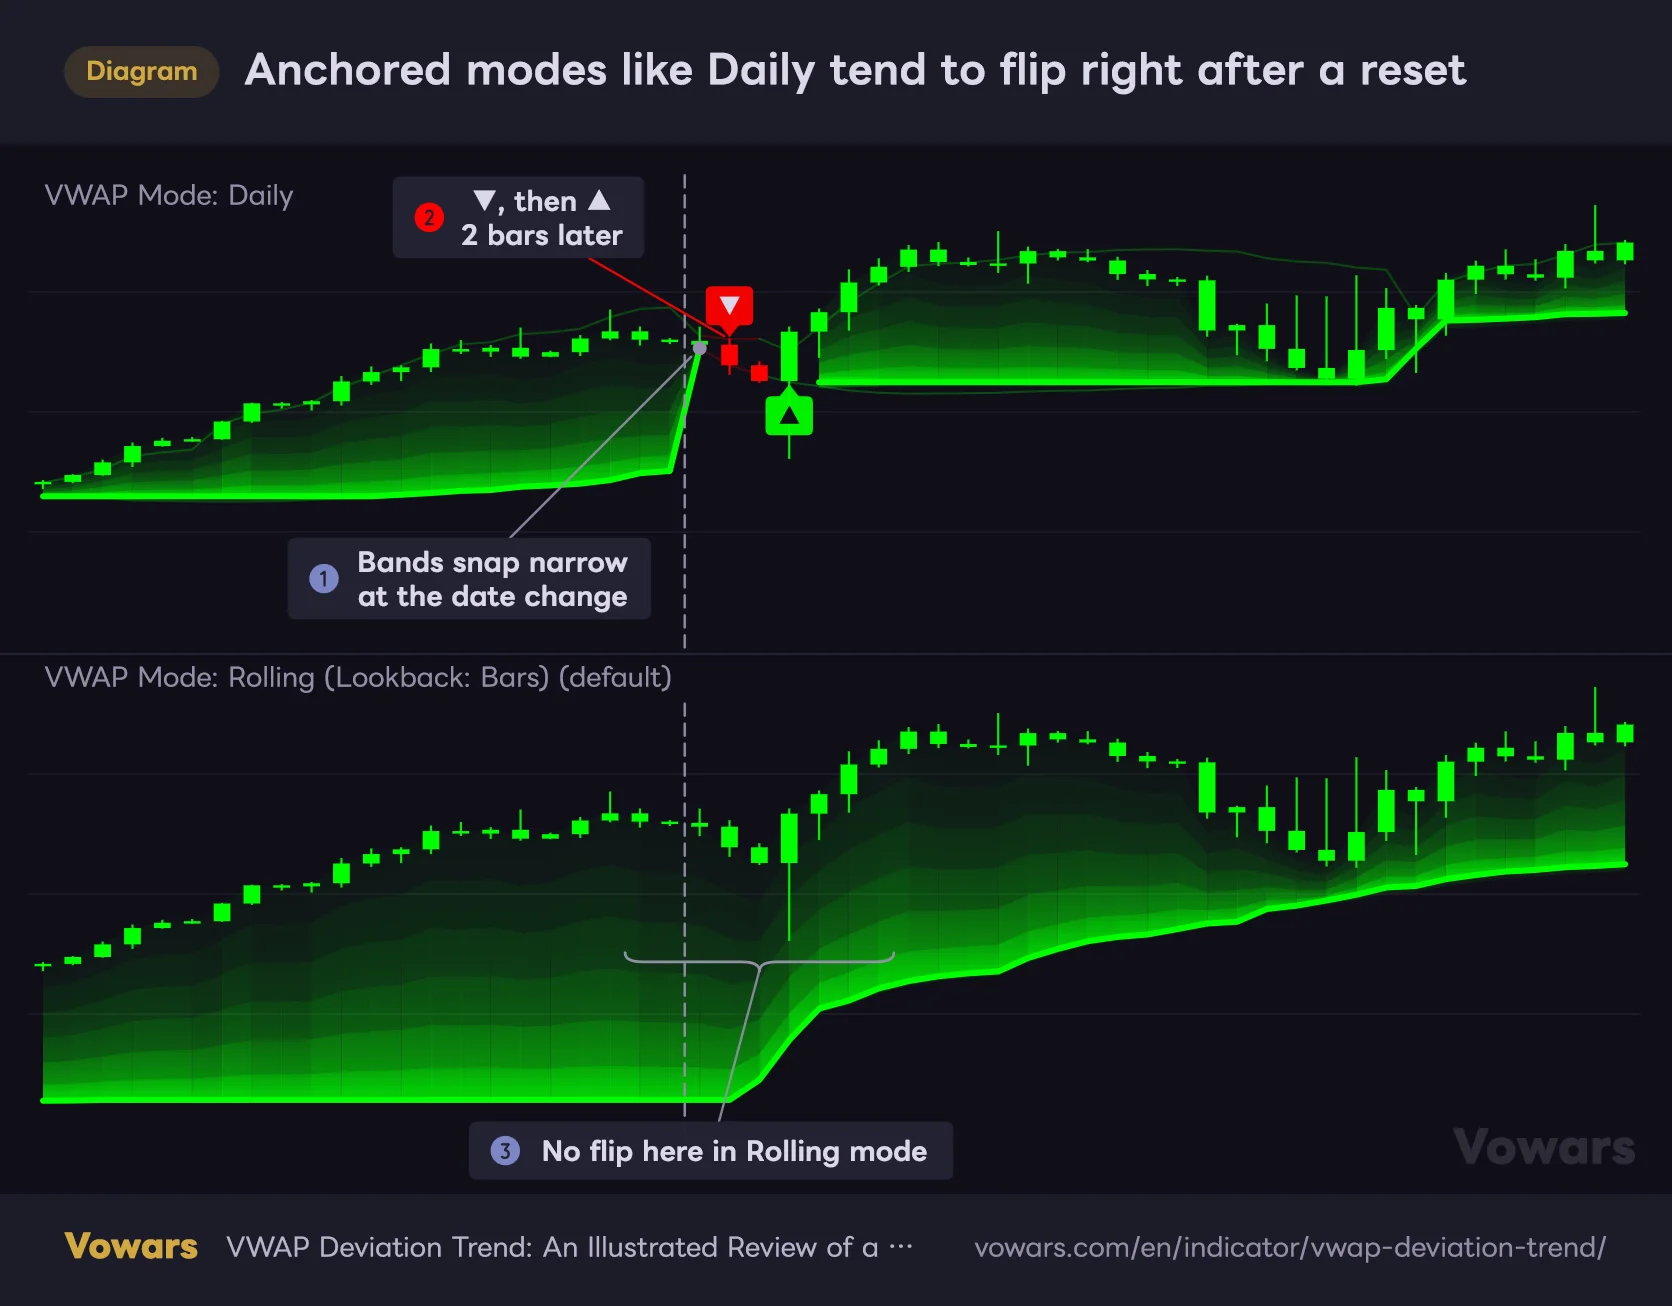
Anchored modes have one more quirk. Right after a reset, VWAP and deviation are recalculated starting from the first bar, so the deviation is close to zero and the bands snap all the way in to the ATR floor.
Anchored modes like Daily tend to flip right after a reset
Right after a reset, VWAP and deviation are recalculated from the first bar, so the bands snap narrow and the trail moves right up next to price.
Vowars DE ver.3.11.0
In the Daily panel on top, the bands narrowed on the bar where the date changed, and the trail got pulled up right under price. ▼ printed immediately after, and ▲ two bars later. In the default rolling panel below, there was no flip at the same spot. The author also notes that anchored modes can be unstable right after a reset.
On timeframes where a single bar is longer than the anchor period, VWAP is calculated from just one bar every time, so the deviation is zero. The band width is then set only by the ATR floor, and if ATR Minimum Width is off, the width is zero. Avoid Daily on the daily chart, 4 Hours on 4H and above, and Weekly on the weekly chart. On higher timeframes, the rolling modes are the safe choice.
Rolling (Lookback: Days) defines the window in calendar days, so VWAP covers the same period even when you switch timeframes. However, it counts a maximum of 5,000 bars. If you set 30 days on a 1-minute chart of a 24/7 crypto market, it gets cut off at 5,000 bars (about 3.5 days). So on lower timeframes, keep the day count smaller to get what you intend.
Suggested settings by trading style
These are all starting points. The fastest approach is to watch how ▲▼ print on your own symbol and adjust from the multiplier first.
| Style | Timeframe | Starting settings | Why |
|---|---|---|---|
| Scalping | 1–5 min | Deviation Multiplier 2.0, VWAP Slope Confirmation on | ▲▼ tend to fire back to back in small-range chop, so tighten the flip conditions |
| Day trading | 15 min – 1H | Rolling Lookback Bars 50–100, Deviation Multiplier 1.5–2.0 | 50 bars on a 1H chart is about 2 days. For roughly one day on 15m, use around 96 bars |
| Swing trading | 4H – daily | Default settings | ▲▼ only print at major swing changes, and pullbacks rarely flip the color |
| Position trading | Daily – weekly | Rolling Lookback Bars 50–100 | Skip the anchored modes and use a longer rolling window so the center moves slowly |
When to use VWAP Slope Confirmation and Flip Trigger
Turn on VWAP Slope Confirmation and a bullish flip also requires VWAP to be above its value from VWAP Slope Lookback bars ago, while a bearish flip requires it to be below. Moves where price punches through while VWAP stays flat are no longer treated as flips.
There’s a side effect, though. If price closes through the trail but the slope condition isn’t met, the color doesn’t change, and on the next bar the trail is recalculated back to the band level. As a result, you can get an unfamiliar picture where price sits below the green trail and it stays green. I’d only turn it on if fakeouts are really bugging you.
Flip Trigger at its default, Close, uses the closing price. Switch it to Price Source and it uses the price selected in Price Source (hlc3 by default), so bars with a long wick where only the close pokes through are less likely to trigger a flip. It reacts slightly later, but the signal gets a bit smoother.
What you can hand off to “VWAP Deviation Trend” and what you can’t
What you can rely on it for
- Price just chopping around VWAP doesn’t flip the color, so the directional call stays stable
- In a bullish phase the trail never drops, so it doubles as a stop-loss or take-profit reference
- Because it’s centered on high-volume prices, you can tell whether price has truly left the center of gravity
- The ATR floor keeps the bands from collapsing even when volatility dries up
- Two alerts (▲ and ▼) are built in, so you can let it watch the chart for you
What you can’t fully rely on it for
- The flip threshold sits a band width away, so it will always lag tops and bottoms
- In tight chop on lower timeframes, ▲▼ can fire back to back
- The anchored VWAP Mode options tend to flip right after a reset
- On symbols without volume data it falls back to a simple average and loses its volume-weighting edge
- The gradient intensity varies only slightly, so it’s a weak read on momentum
Pairing it with RSI: the trail sets direction, RSI picks the entry
▲▼ inevitably print late, so if you wait for ▲ to buy, you often end up chasing a move that’s already happened. What worked for me was using “VWAP Deviation Trend” purely as a directional filter and finding entries on RSI (14) pullbacks.
Pair it with RSI to buy the dip in a bullish phase
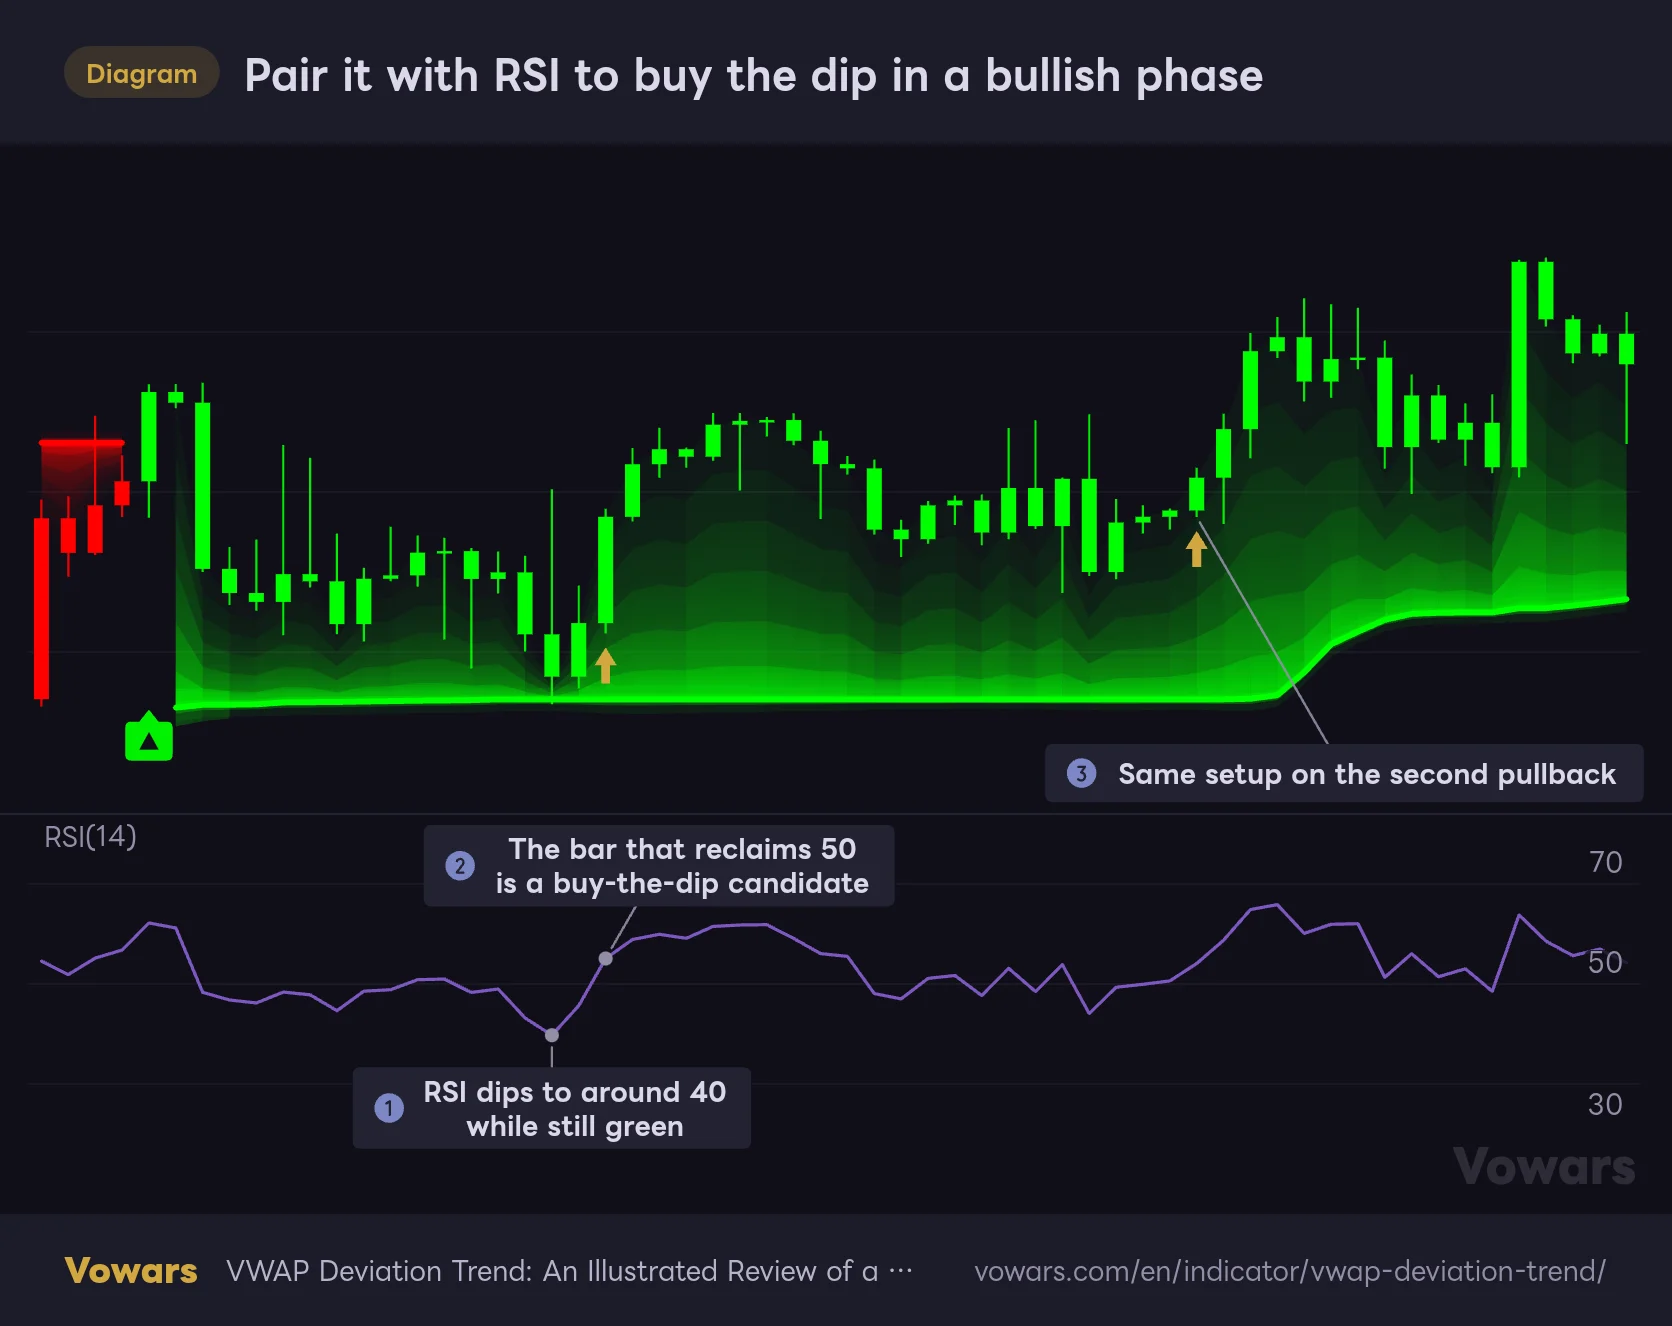
Let the VWAP Deviation Trend trail set the direction, and look for entries where RSI(14) dips below 50 and then recovers.
Vowars DE ver.3.11.0
While the trail is green, RSI dips to around 40 and then crosses back above 50; that bar becomes a buy-the-dip candidate. The trail sits well below price, so stop placement is clear too.
1Use the trail color to decide long or short
Green means longs only, red means shorts only. Skip any entry against the color, no matter what RSI looks like.
2Wait for RSI to drop below 50
If RSI dips below 50 while the trend is still bullish, that’s your pullback. Turn on Show VWAP and you can also check whether price has pulled back to VWAP.
3Enter on the bar that reclaims 50 and put your stop beyond the trail
Use the close of the bar where RSI crosses back above 50 as your entry. Put the stop a little beyond the trail. A close through the trail flips the call itself to bearish, which gives you a clear reason to get out.
4Move your stop up as the trail ratchets higher
As long as the bullish trend continues, the trail only moves up, so raise your stop along with it. When ▼ prints, consider closing out even if you’re in profit.
Repainting, alerts, and how to check it on historical data
Closed bars don’t change; only the live bar does
“VWAP Deviation Trend” doesn’t pull in higher-timeframe data or future values. Once a bar closes, its trail, color and ▲▼ won’t be redrawn later.
That said, on the latest live bar the signal can wobble until the close is set. If price breaks the trail mid-bar, ▲▼ shows up, and if it comes back before the bar closes, it disappears. Make it a rule to trust ▲▼ only after the bar closes and you won’t second-guess it.
Set alerts to Once Per Bar Close
There are two alert conditions: “VWAP Deviation Trail Bullish” and “VWAP Deviation Trail Bearish.” Both trigger at the same time as ▲▼. In TradingView’s alert dialog, set the frequency to “Once Per Bar Close” and you’ll only get notified when the bar closes, so a temporary mid-bar flip won’t set off a notification.
If you want a heads-up before the flip, you can also set an alert for the symbol crossing “VWAP Deviation Trail.” That’s the better fit if you just want an early warning when price touches the trail.
Backtest manually with Bar Replay
“VWAP Deviation Trend” is built as an indicator, so the Strategy Tester won’t tally its win rate or P&L. If you want performance numbers, you’d need to rebuild the same logic as a strategy.
The easy route is Bar Replay. You can step forward one bar at a time and check which bar each ▲▼ printed on and what price did afterward. On the free Basic plan it’s limited to daily and higher timeframes, and intraday replay requires a paid plan. How far back you can go also depends on your plan and timeframe (as of Sep 23, 2026).
Closed bars don’t repaint, but when you scroll back through history, your eye naturally goes to the long trends it caught. Before deciding how to use it, step through bar by bar in Bar Replay and account for the back-to-back ▲▼ in chop and the lag before each flip as well.
A trail for traders who want a volume-anchored directional filter with fewer fakeouts
 Image
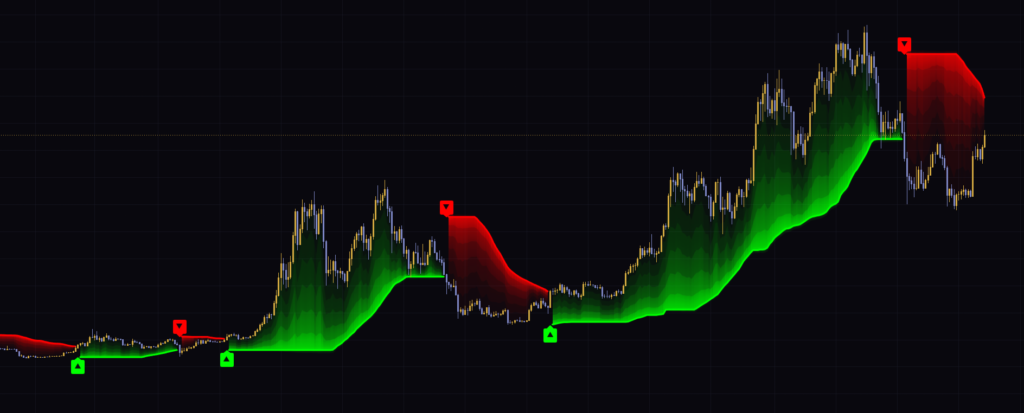
Image“VWAP Deviation Trend” builds a one-way trail from VWAP and volume-weighted deviation. Crossing VWAP isn’t enough to change the color; ▲▼ only print once price moves a full band width away from the center of gravity. That sluggishness is exactly what cuts down fakeouts in chop.
It’s best suited as a filter on 1H through daily charts for deciding whether you should be thinking long or short right now. On lower timeframes, it’s easier to handle if you raise Deviation Multiplier or pair it with a pullback tool like RSI. The anchored options of VWAP Mode need to be matched carefully to your timeframe, so if in doubt, stick with the default rolling mode.
Personally, I’d especially recommend giving it a try if you feel Supertrend flips too easily. Buying the dip when price pulls back to VWAP while the trail is green: that’s the use case where this trail clicked for me the most.