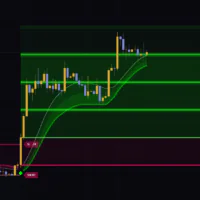


An Indicator That Packs Four Trading Logics Into One Tool and Maps Out Your Exit
“Buy-Sell Signals using Multi-Logic Trading System” is a TradingView indicator that rolls four different trading logics into a single script: trend-following, momentum, range breakout, and range mean reversion (fading the edges of a range). It was built by InvestyourAsset and is published as open source.
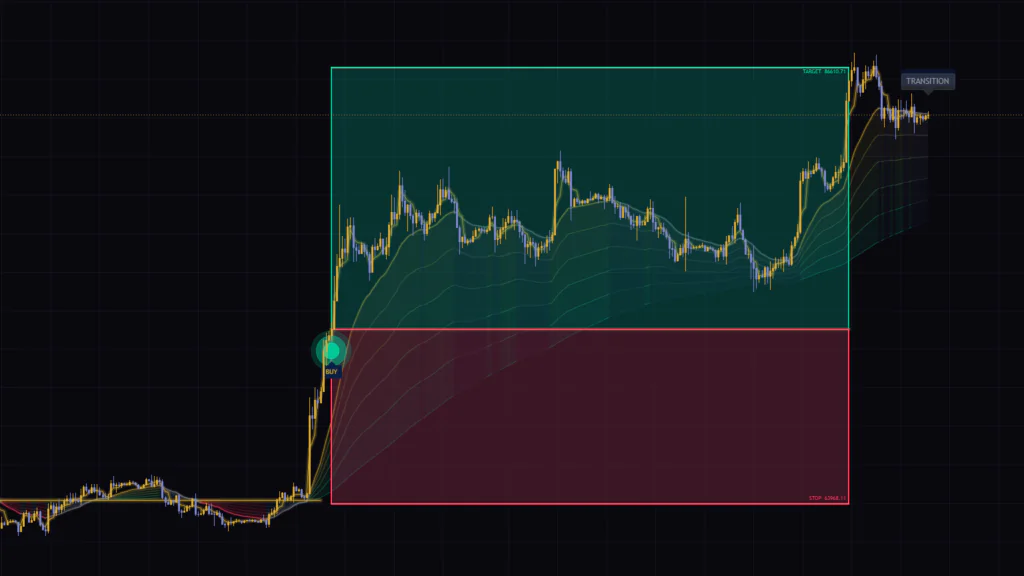
The moment a BUY or SELL marker prints, it draws the entry price, stop loss (STOP), and profit target (TARGET) as one package. That is what sets it apart from a typical arrow-based signal tool: “where to get in, where to bail, and where to take profit” all lives on one screen. A dashboard in the top-right corner also summarizes the scores and filter states.
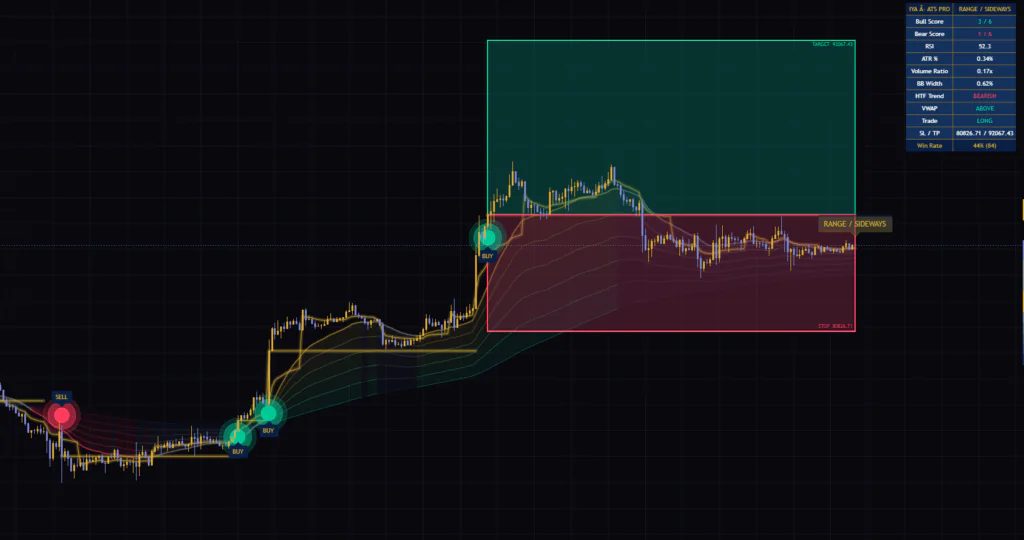
I loaded it on Bitcoin’s 15m, 4H, and daily charts and spent several days comparing what it showed. The biggest takeaway: with the exact same default settings, it behaves like a completely different indicator depending on the timeframe. In this review, I break down how the signals are generated, one piece at a time, then cover the defaults that cause problems and how to fix them.
On TradingView’s script page it’s called “Buy-Sell Signals using Multi-Logic Trading System,” but the top-left of your chart will show “Buy-sell with multi-logic trading system.” The dashboard header reads “IYA · ATS PRO.” They’re all the same indicator, so when you search the indicator library, searching “Multi-Logic” is the quickest way to find it.
Six Elements Show Up on the Chart. Let’s Get the Basics Down First
When you first add “Buy-Sell Signals using Multi-Logic Trading System”, the sheer amount of information will probably catch you off guard. For the first few minutes, I honestly couldn’t tell which line was which. Broken down, everything on screen falls into six elements.
| Element | What it shows | Default |
|---|---|---|
| Gradient band (ribbon) | Where price sits relative to EMA20 through EMA200, plus trend direction | Shown |
| Glowing gold line | Session VWAP (the day’s volume-weighted average price) | Shown |
| Glowing dot with a BUY/SELL tag | A confirmed signal | Shown |
| Horizontal gold line (entry beam) | Entry price of the open trade | Shown |
| Green and red boxes | Profit side up to TARGET, loss side down to STOP | Shown |
| Card above the latest bar | Which of four market states the current bar is classified as | Shown |
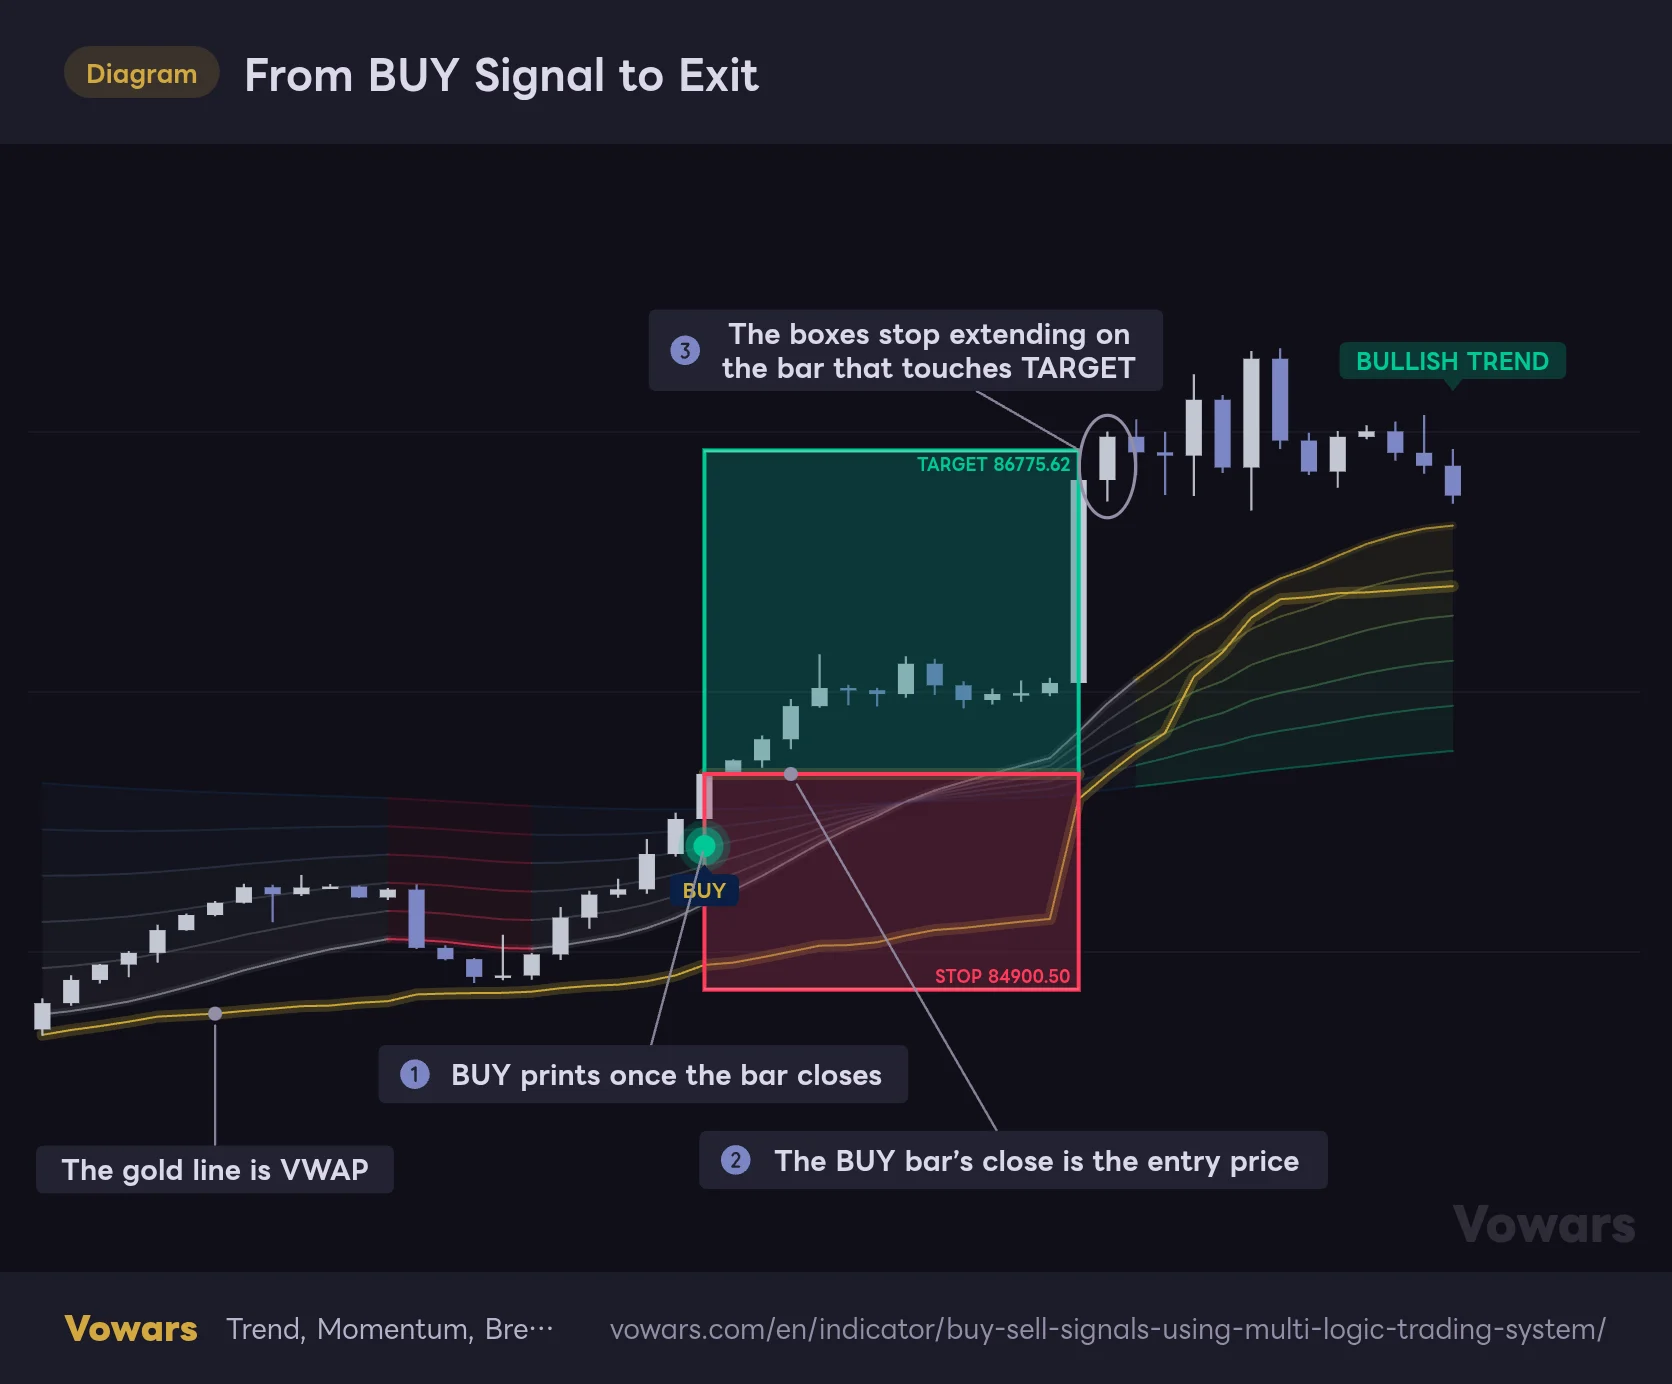
Here’s the full flow from signal to exit. As callout ① shows, a BUY only prints after the bar closes. That bar’s close becomes the entry price, and a gold line is drawn at callout ②. The boxes keep extending to the right and stop on the bar just before price touches TARGET or STOP (callout ③).
From BUY Signal to Exit
When a signal fires, the entry price, stop, and target are drawn as one set, and they keep extending to the right until price touches one of them.
Vowars DE ver.3.12.1
The boxes don’t disappear after the trade closes. They only get cleared when the next signal fires. In other words, the only boxes you’ll see on the chart are the ones for the most recent trade. If you want to review past trades with their boxes, turn on Keep Historical Risk/Reward Boxes On Chart in the display settings.
The Ribbon’s Six Lines Don’t Include EMA50
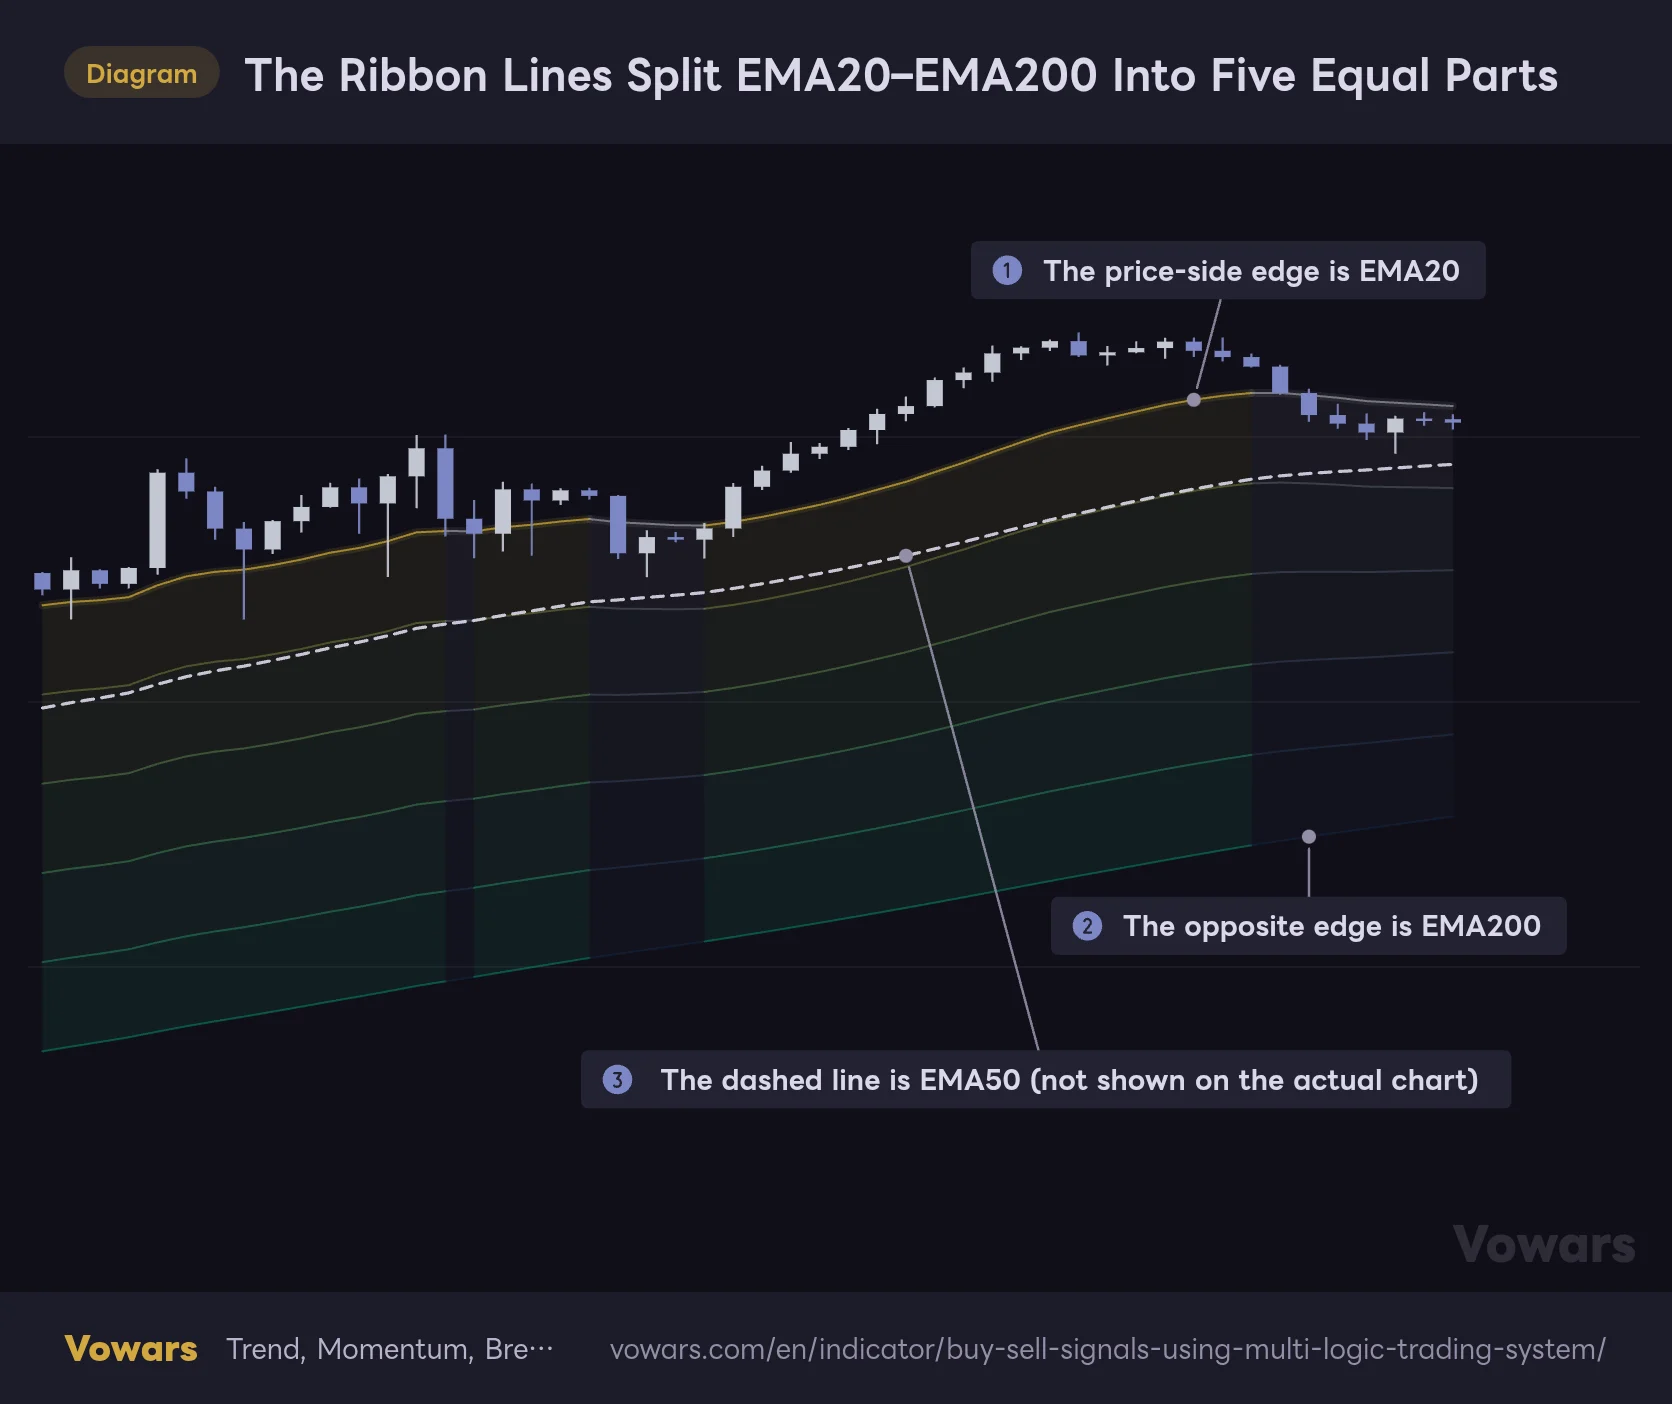
The ribbon is made of six thin lines with a faint fill between them. At first, I assumed these six lines were a stack of moving averages like EMA20, EMA50, and EMA200. That’s not what they are.
The edge closest to price is EMA20 (callout ①), the opposite edge is EMA200 (callout ②), and the four lines in between are helper lines that split the distance between EMA20 and EMA200 into five equal parts. EMA50, which the trend logic actually uses, isn’t plotted anywhere on the chart (callout ③).
The Ribbon Lines Split EMA20–EMA200 Into Five Equal Parts
The six lines are drawn at evenly spaced intervals between EMA20 and EMA200. EMA50 itself isn’t plotted.
Vowars DE ver.3.12.1
The color switches bar by bar between three modes. When the stack lines up as close > EMA20 > EMA50 > EMA200, it flips to the bullish palette: gold on the price side fading to green on the outside. When it lines up the other way, you get the bearish palette, red fading to dark red. Anything else gets the neutral palette, gray fading to navy.
One thing to watch: a single close below EMA20 is enough to flip the ribbon back to neutral. So when the band turns gray on a pullback in an uptrend, that doesn’t necessarily mean the trend is over. If you want to see where EMA50 actually sits, add TradingView’s built-in Moving Average Exponential with a length of 50 as a separate overlay. It makes the call a lot easier.
Three Things Are Gold, So It’s Easy to Mix Up the Lines
What threw me off the most with “Buy-Sell Signals using Multi-Logic Trading System” was the color scheme. There’s just too much gold. The VWAP, the entry beam, and the price-side ribbon line in bullish mode are all drawn in the same shade of gold. In an uptrend, when the entry beam and VWAP end up near the same price, it takes a second to tell which is which.
The trick is to look at the shape. VWAP bends with price and jumps to a new level at the start of each day. The entry beam is perfectly flat and only shows while a trade is open. The gold ribbon line moves together with the other ribbon lines as part of the band. If it still bugs you, change only the color of “VWAP Core” or “Entry Beam Core” in the Style tab, and it becomes much easier to read.
The Market Condition Card and Dashboard Only Show the Latest Bar
The card above the latest bar shows which of the four states below the current market has been classified as. The order matters: the first condition that matches, from top to bottom, is the one displayed.
| Card | Condition | Card color |
|---|---|---|
| BULLISH TREND | Close > EMA20 > EMA50 > EMA200 | Green |
| BEARISH TREND | Close < EMA20 < EMA50 < EMA200 | Red |
| RANGE / SIDEWAYS | The range of the previous 30 bars is within 5% of the low | Gold |
| TRANSITION | None of the above | Gray |
The dashboard in the top-right has 12 rows. You don’t need to read all of them every time. The three I actually look at are the scores at callout ①, the filters at ②, and the win rate at ③.
What to Read in the 12-Row Dashboard
The top-right table only shows the state of the latest bar. Past values aren’t kept, so narrowing down which rows to watch keeps things simple.
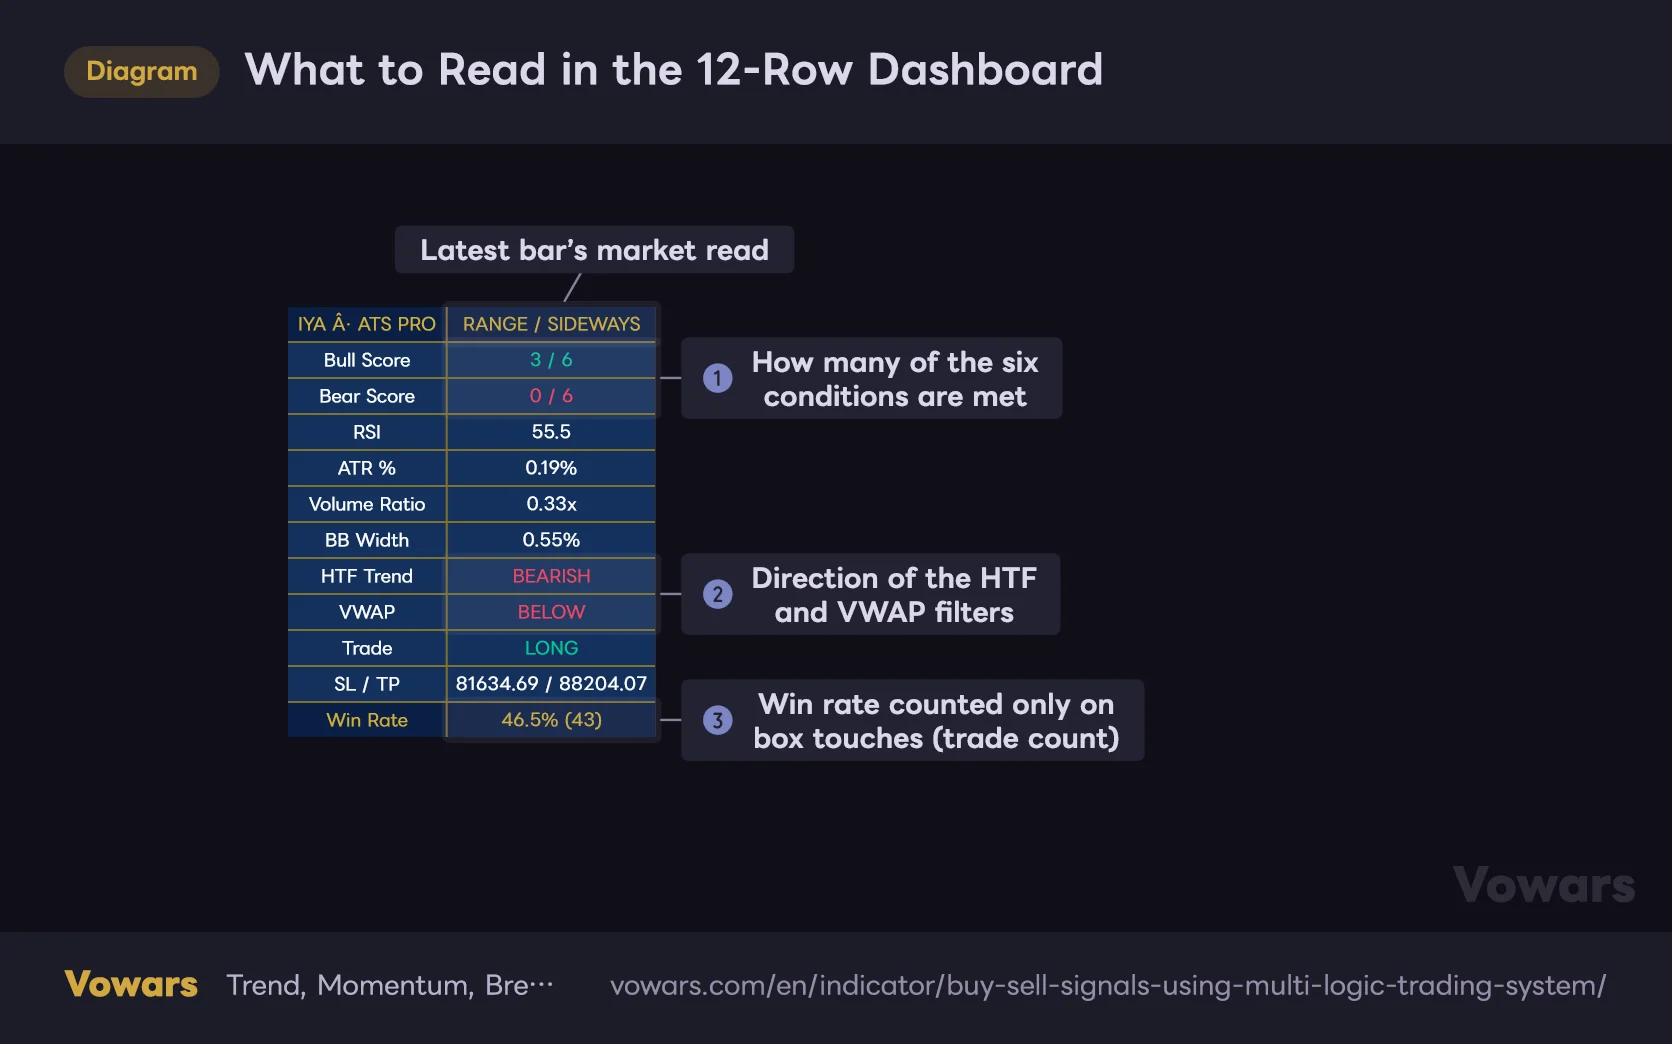
Values in the table are illustrative.
Vowars DE ver.3.12.1
Bull Score and Bear Score show how many of the six conditions (covered below) are currently met. HTF Trend and VWAP show the direction of the filters applied to signals. If these read red, trend-type BUY signals won’t fire.
The card and dashboard only display values for the latest bar. Scrolling back through the chart won’t show you how older bars were classified. However, with TradingView’s Bar Replay, the bar where you pause is treated as the “latest bar,” so you can see the card and dashboard as they were at that point. Pausing the replay on the signal bar you’re curious about is the fastest way to verify it. How far back you can go depends on your plan and the timeframe.
How Are BUY and SELL Decided? Four Logics and a Six-Point Score
A signal from “Buy-Sell Signals using Multi-Logic Trading System” fires as soon as any one of its four logics has its conditions met. The marker doesn’t tell you which logic triggered it. The author acknowledges this in the description and suggests reading it from the card, the dashboard, and the surrounding price action.
Before getting into the four logics, let’s nail down the “score” that serves as their common yardstick.
Bull Score and Bear Score Add Up Six Conditions
| Condition | Adds to Bull Score when | Adds to Bear Score when |
|---|---|---|
| EMA stack | Close > EMA20 > EMA50 > EMA200 | Close < EMA20 < EMA50 < EMA200 |
| RSI(14) | Above 45 and below 72 | Above 28 and below 55 |
| MACD (12, 26, 9) | MACD line above the signal line with a positive histogram | MACD line below the signal line with a negative histogram |
| Bollinger Bands (20, 2) | Close above the basis | Close below the basis |
| Volume and OBV | Volume at least 1.5× its 20-bar average, with OBV above its 14-bar average | Volume at least 1.5× its 20-bar average, with OBV below its 14-bar average |
| Break of recent high/low | Bullish candle that closes above the high of the previous 10 bars | Bearish candle that closes below the low of the previous 10 bars |
Unlike the usual “RSI above 70 means overbought” reading, RSI drops out of the Bull Score once it exceeds the 72 cap. That’s worth remembering: on bars where momentum has run too hot, the score actually goes down.
The “previous 10 bars” used in the sixth condition comes straight from Structure Swing Lookback in the risk management settings. If you change this value to adjust your stop placement, keep in mind that the score calculation changes along with it.
Trend-Following Logic Needs “Stack + Score + Two Filters”
This is the logic enabled by Enable Trend-Following Logic. It fires when the EMAs are fully stacked, the score is at or above Minimum Trend Confluence (default 4), and the higher-timeframe EMA and VWAP both agree with the direction. Since the stack itself counts as one point, the default of 4 effectively means “the stack plus 3 of the other 5 conditions.”
It’s the most conservative of the four. The flip side is that it tends to fire a bit after the trend is already underway, so it won’t catch the initial move.
Momentum Logic Reacts Without Waiting for the EMA Stack
The Enable Momentum Logic logic looks for momentum: close above EMA20, RSI above 52, a positive MACD histogram that’s bigger than the previous bar’s, and OBV above its average. The sell side uses RSI below 48 and the mirror image of everything else. The higher-timeframe and VWAP filters apply here too.
Because it doesn’t wait for EMA50 and EMA200 to line up, it fires earlier than the trend-following logic. From what I saw, most of the signals right after price broke out of a range seemed to come from this logic. The BUY in the first chart is also a momentum-logic signal, based on the calculation.
The easy thing to miss is volume. With Use Volume Filter When Available turned on, on any symbol that has volume data, momentum signals only fire on bars where volume is at least 1.5× its 20-bar average.
Range Breakout Logic Checks for a “Clean Close Outside the Previous 30 Bars”
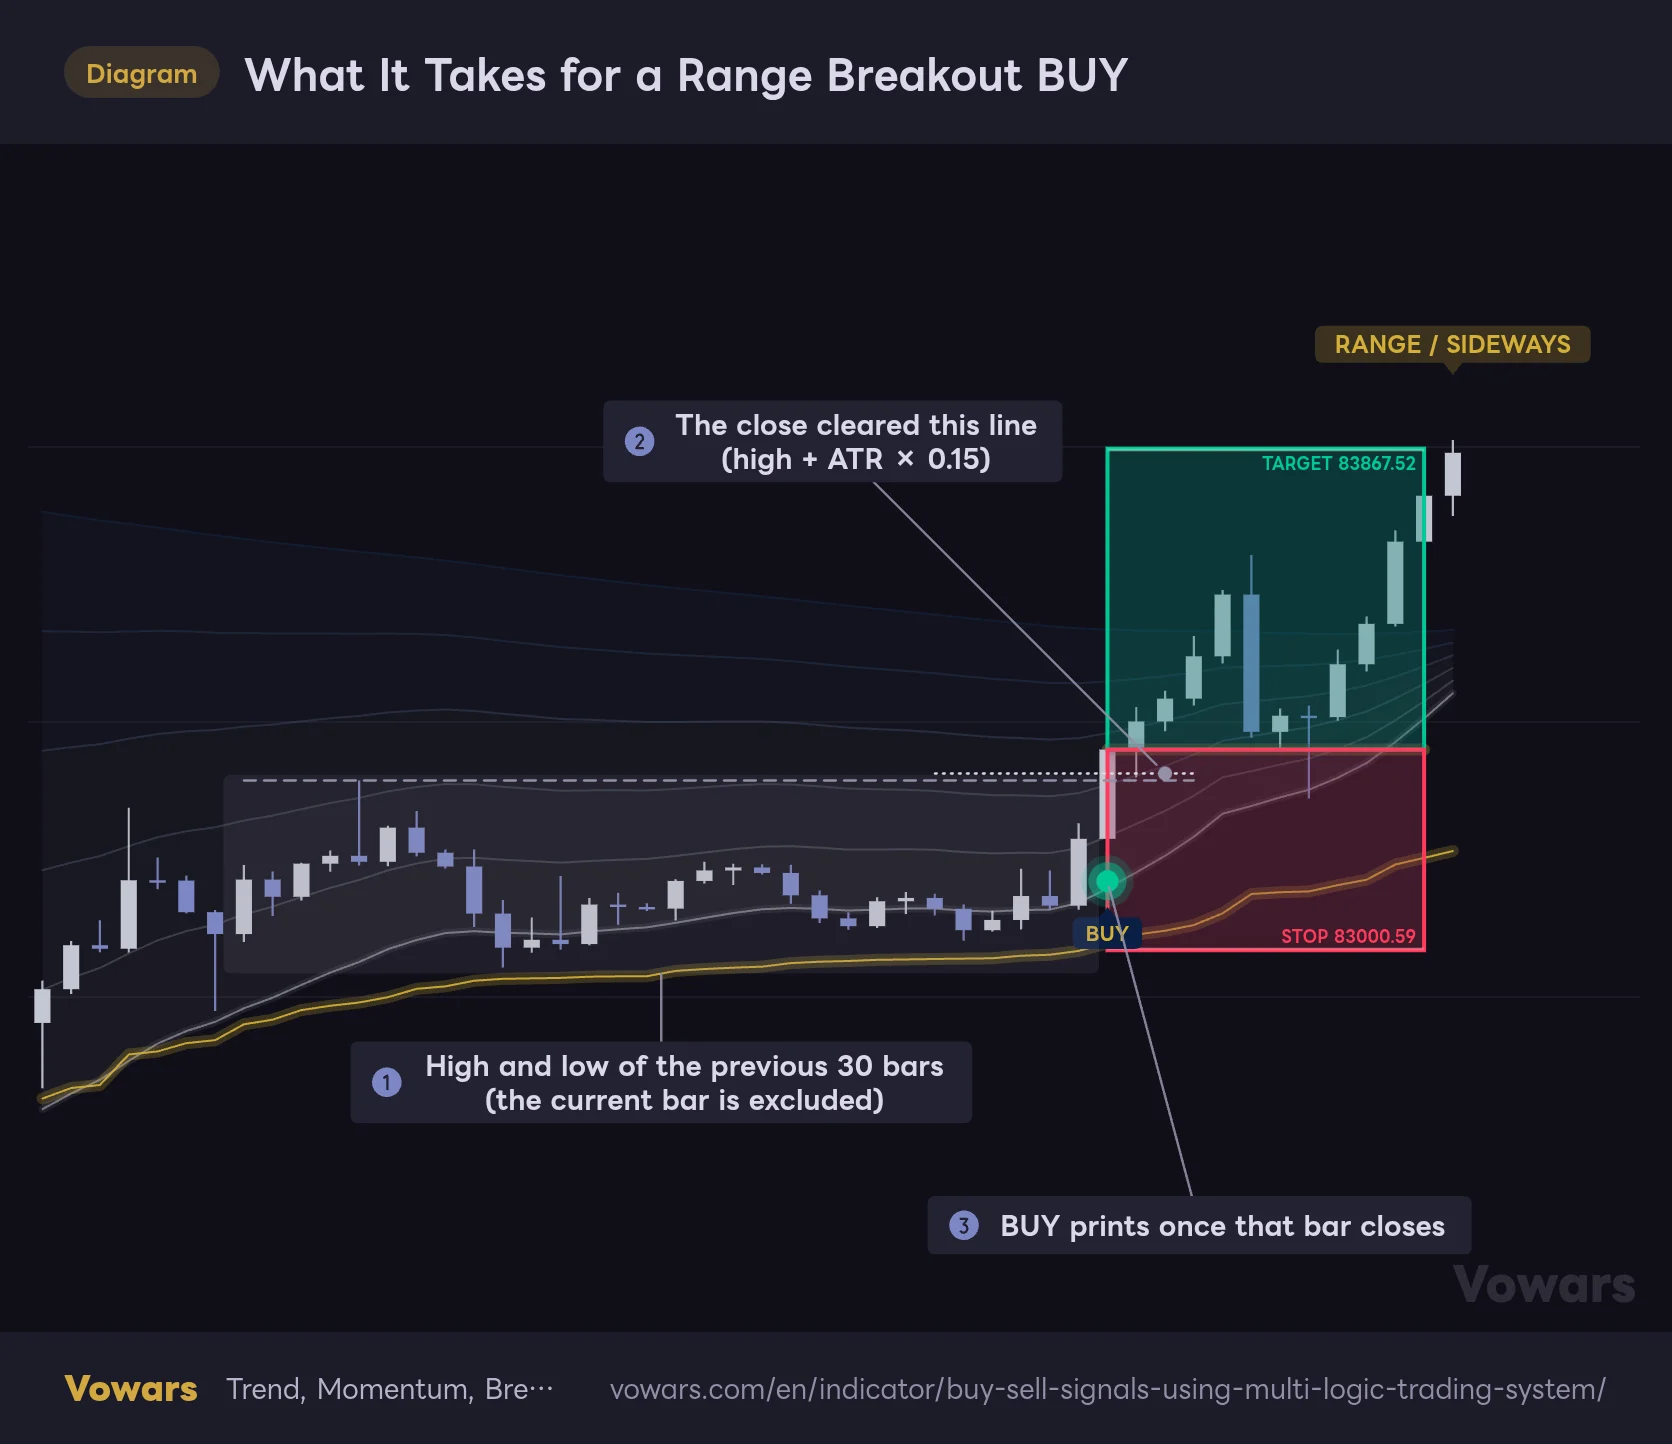
The Enable Range Breakout Logic logic assumes the previous 30 bars stayed within a 5% range, then picks up the bar that closes outside it. The key point is that the bar being evaluated is excluded from that range: the range at callout ① doesn’t include the current bar.
What It Takes for a Range Breakout BUY
A breakout is confirmed when the current bar closes clearly above the range formed by the previous 30 bars, by at least 0.15 × ATR.
Vowars DE ver.3.12.1
The breakout threshold is “the high of the previous 30 bars + ATR × 0.15” (callout ②). That extra buffer filters out bars that barely poke above the high, and you can change it with Breakout Confirmation Buffer (x ATR). On top of that, the close has to land in the top 60% of the bar’s range, RSI has to be above 50, the MACD line above its signal line, and price above VWAP. Only when all of that lines up do you get the BUY at callout ③.
One caveat here: this logic has no higher-timeframe filter. Even if the higher timeframe is still in a downtrend, a break above the range will print a BUY. The author states this clearly and tells you to check the higher-timeframe structure yourself.
Even if you turn off Require High Volume For Breakout because you don’t care about breakout volume, you still need at least 1.5× volume as long as Use Volume Filter When Available stays on. To drop the volume requirement, you have to turn both off.
Mean Reversion Is Off by Default. If You Use It, Watch the Volume Condition
Enable Sideways Mean-Reversion Logic buys bars that dip into the bottom 20% of the range and bounce back, and sells bars that push into the top 20% and get rejected. The conditions include a bullish candle whose lower wick is at least 35% of its range, RSI turning up from below 38, and a range at least 1× ATR wide. The higher-timeframe and VWAP filters don’t apply.
One thing bugged me: there’s a volume condition here too. With the volume filter on, signals only fire on rejection bars that come with at least 1.5× average volume. The author writes “don’t use it when price is pressing the edge of the range with expanding volume,” so requiring a volume spike feels a bit at odds with that. If you want to try mean reversion, decide how you want to handle the volume filter before you use it.
STOP and TARGET Come Down to “the Recent Low” and “1.5×”
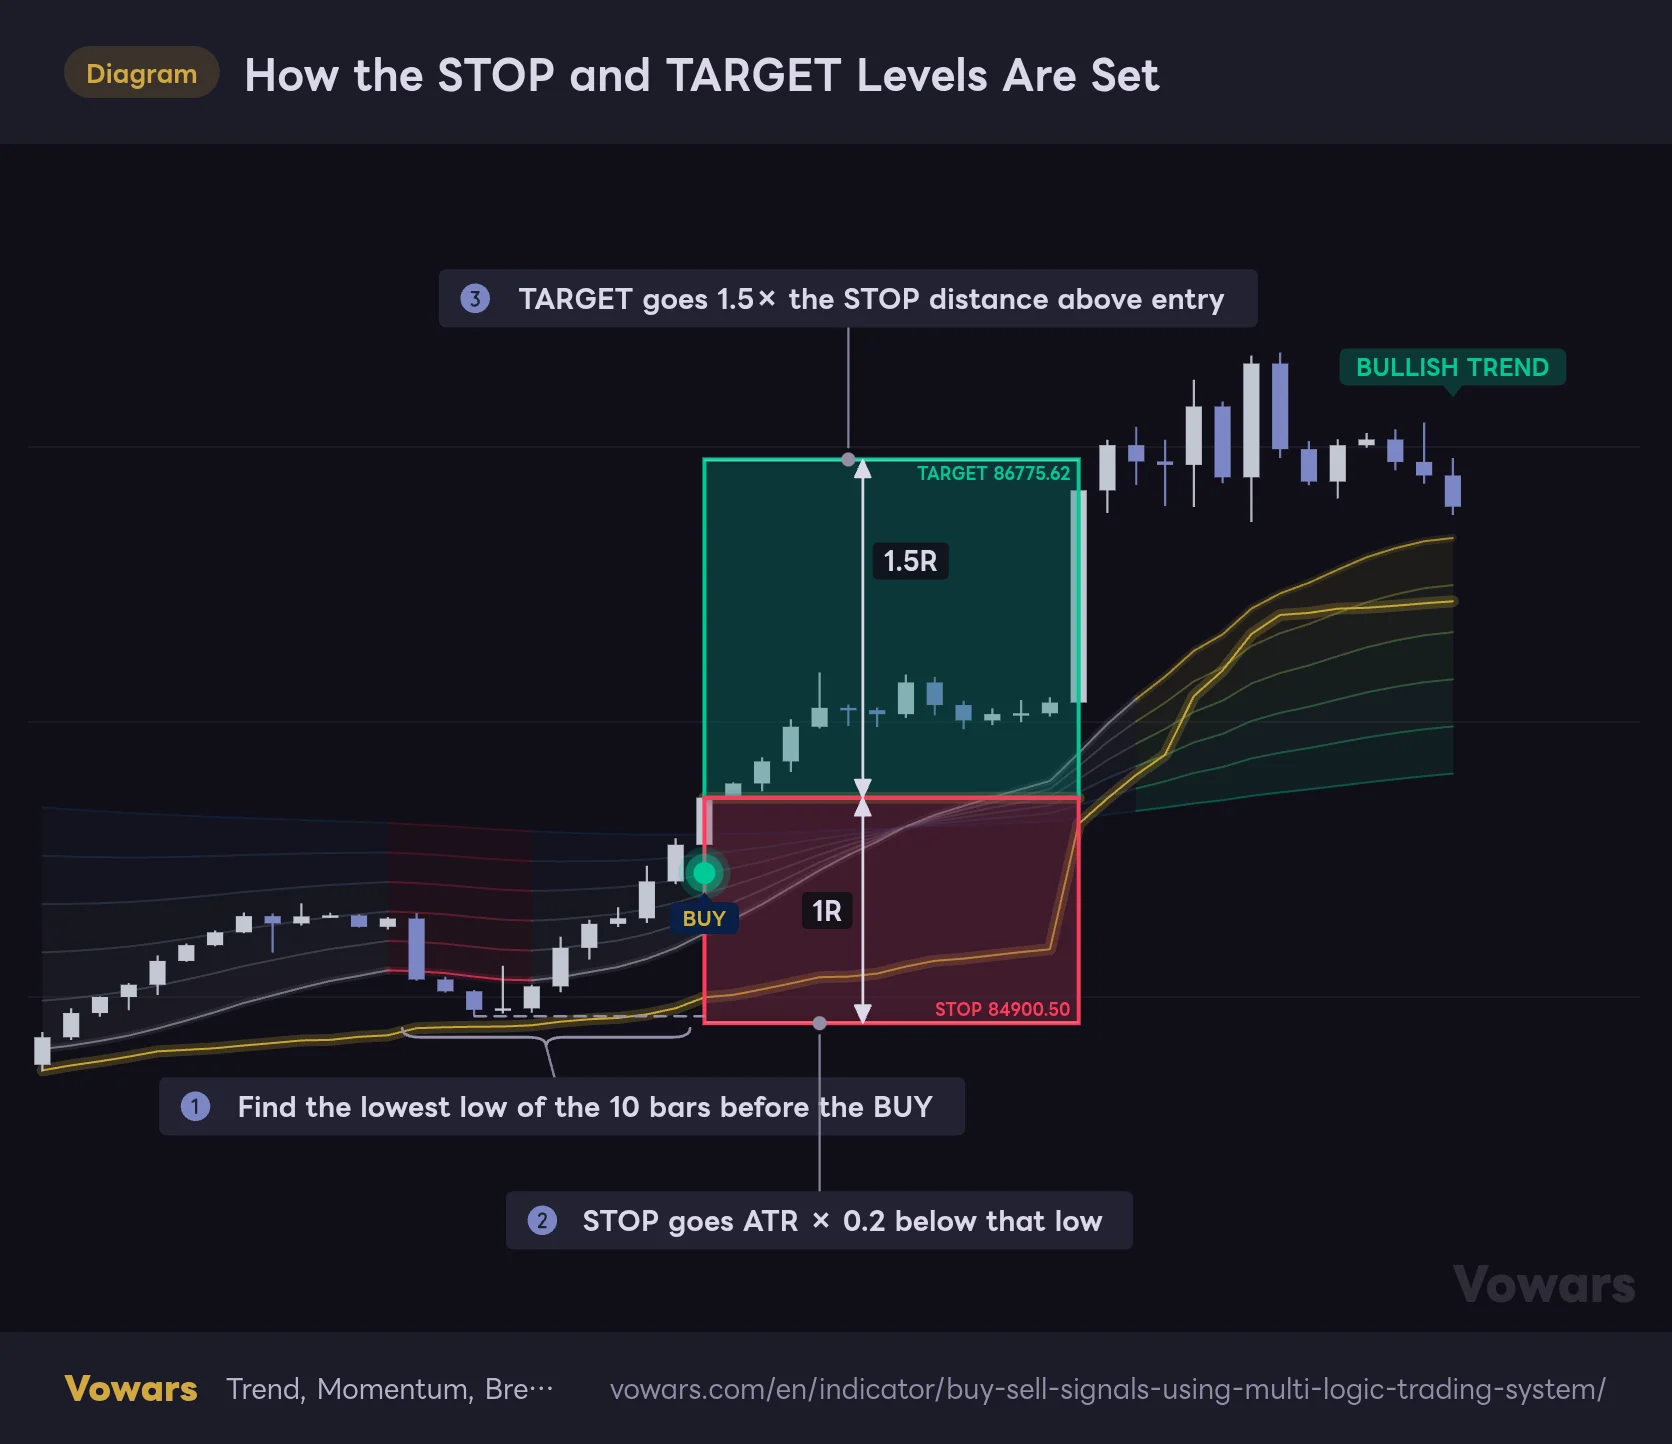
The default Stop-Loss Method is “Structure + ATR.” For a BUY, it finds the lowest low of the previous 10 bars (callout ①) and places the STOP 0.2 × ATR below it (callout ②). TARGET sits 1.5 times the entry-to-STOP distance above the entry (callout ③).
How the STOP and TARGET Levels Are Set
With the default Structure + ATR method, STOP goes just below the recent low, and TARGET is placed 1.5 times that distance above entry.
Vowars DE ver.3.12.1
Because the stop sits just below the recent low, it follows the market structure. The trade-off: if the previous 10 bars moved a lot, the distance to the stop widens, and TARGET moves further away in proportion. On the daily chart, that “distance” really starts to matter (more on that later).
| Stop-Loss Method | STOP placement | Best suited for |
|---|---|---|
| Structure + ATR (default) | ATR × 0.2 beyond the lowest low (highest high) of the previous 10 bars | Discretionary trading around key levels |
| ATR | ATR × 1.5 from entry | Volatile symbols, or when you want a consistent stop size |
| Fixed % | 2.5% from entry | Simple setups that ignore changes in volatility |
The default Target Method is “Risk:Reward,” using a Risk:Reward Ratio of 1.5. If you count every TARGET hit as a win and every STOP hit as a loss, 40% is the break-even win rate (1.5 × 0.4 = 1 × 0.6). Keep that 40% in mind as your baseline when you look at the dashboard win rate covered later.
Signals Pause While a Trade Is Open. If You Don’t Know This, You’ll Think It’s Broken
By default, “Buy-Sell Signals using Multi-Logic Trading System” has Wait For SL/Target Before Next Signal turned on. Until price touches STOP or TARGET, it won’t accept any new signal. That includes signals in the opposite direction.
No New Signals While a Trade Is Open
By default, no new signal is accepted until price touches STOP or TARGET. Even if the conditions line up in the meantime, no marker appears.
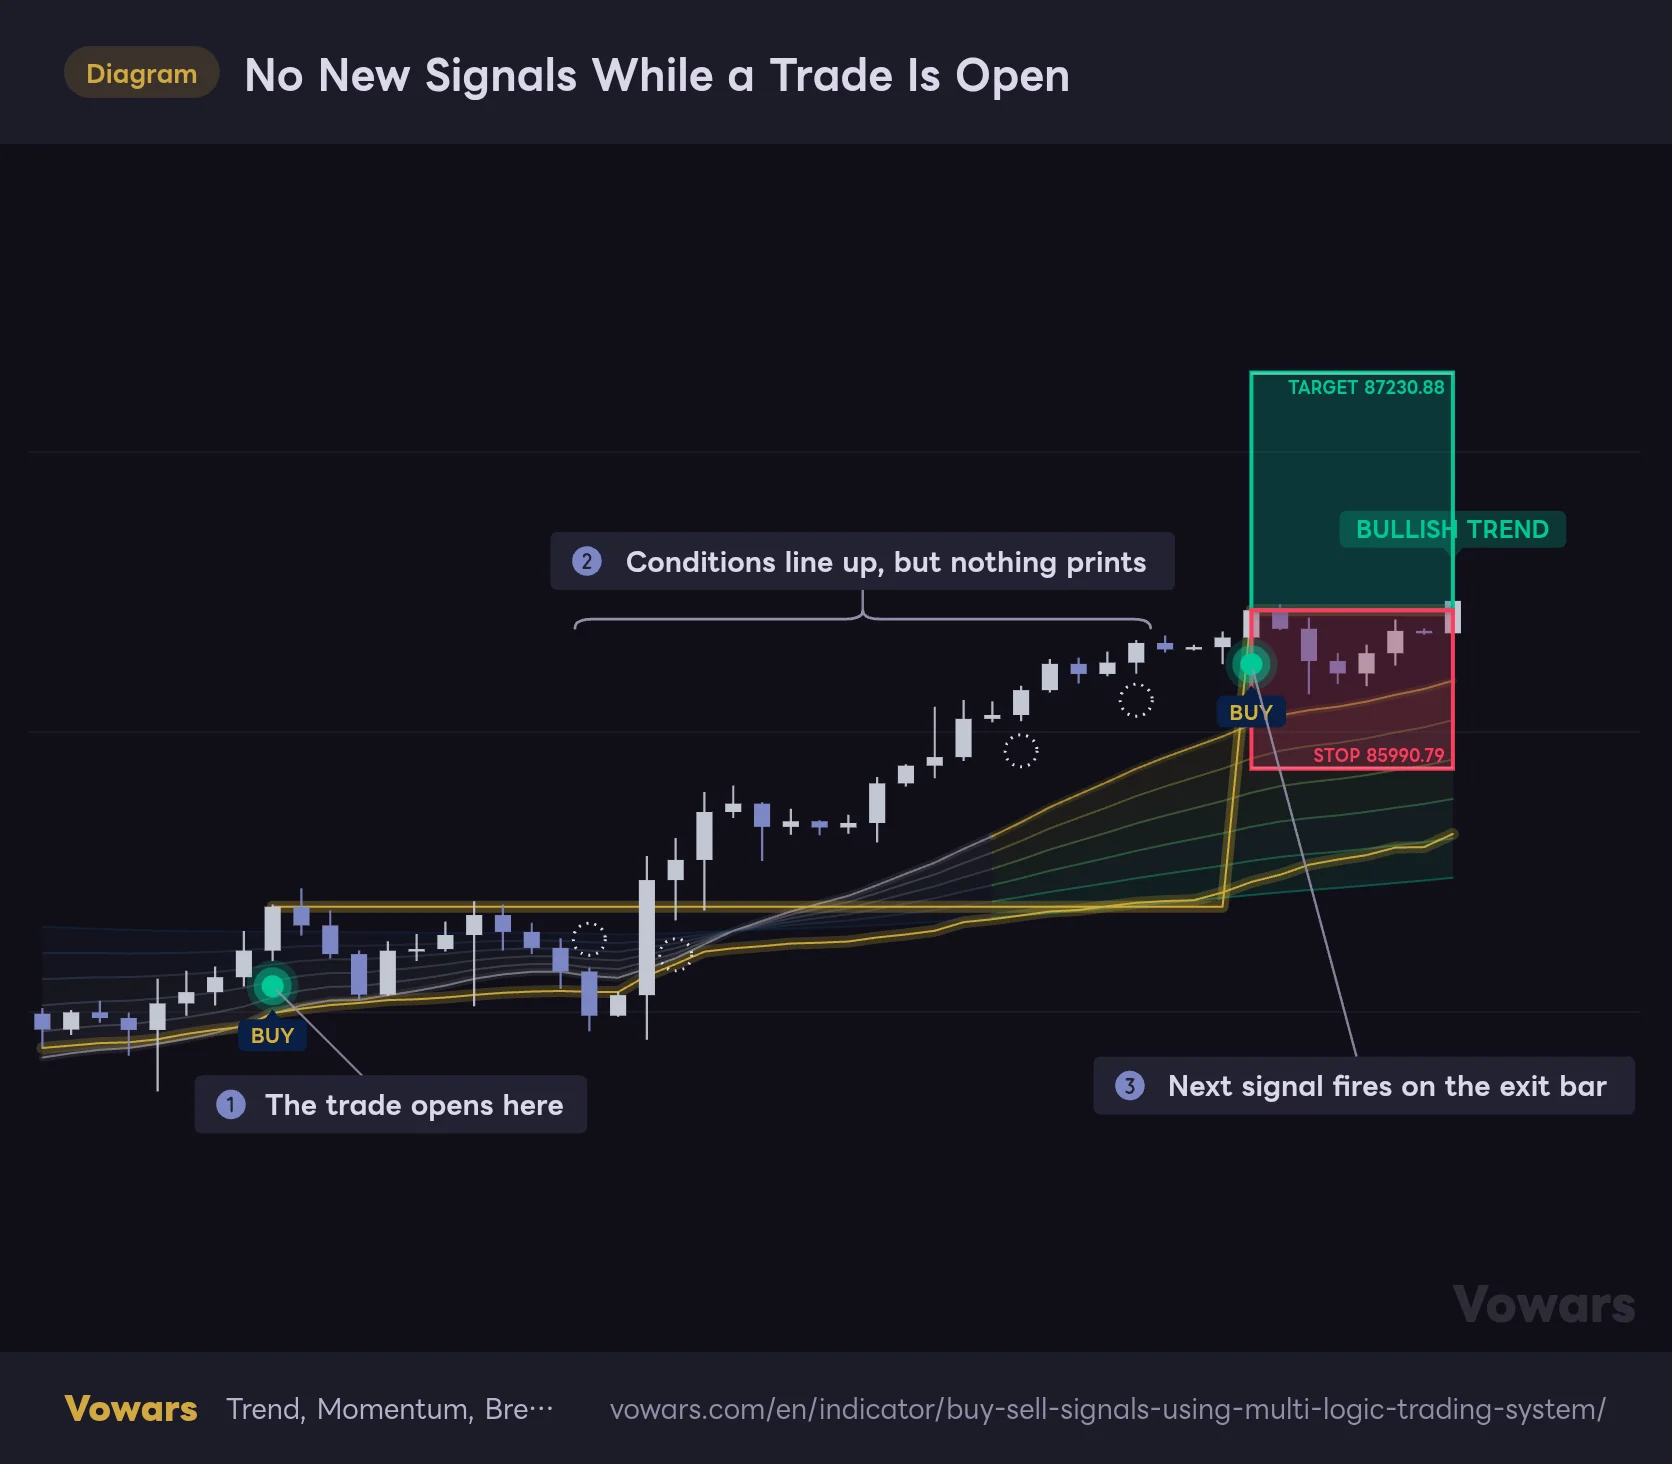
Vowars DE ver.3.12.1
After the BUY at callout ①, the BUY and SELL conditions line up several times in the stretch marked callout ②. Still, no marker prints. The next signal only fires on the bar that touches TARGET (callout ③).
Since every trade gets resolved one at a time, it’s easier to backtest. The problem is on higher timeframes.
On the Daily Chart, a Single SELL Stayed Open for Almost 8 Months
When I loaded it on Bitcoin’s daily chart, a SELL from early February 2026 was still being treated as an open trade at the end of September. STOP was at 91,296.91 and TARGET at 52,480.16, both far from the current price. In the roughly eight months since, not a single new signal had fired. Honestly, at first I thought the indicator had frozen.
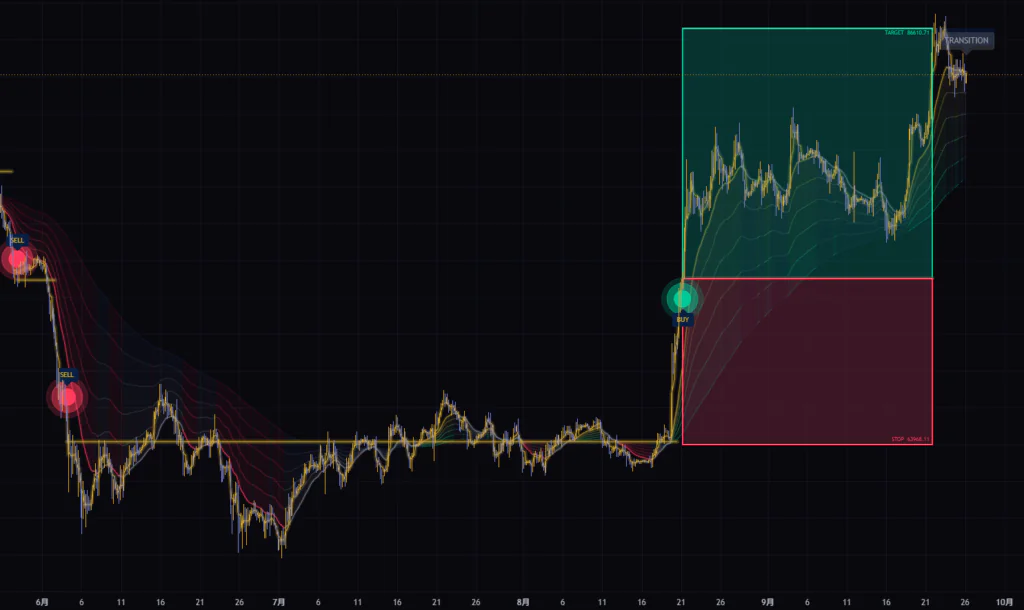
On top of that, the card on the same screen read “BULLISH TREND” while the dashboard’s Trade row still said “SHORT.” With the market read and the trade status pointing in opposite directions, it’s confusing the first time you see it. On the 4H chart too, a SELL from early June was carried all the way into late August.
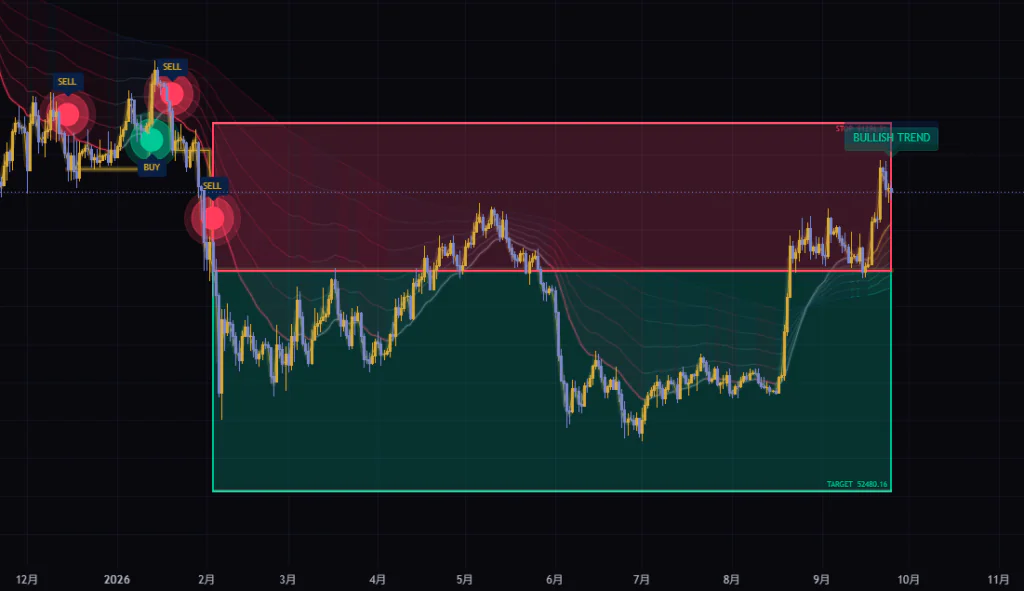
There are two fixes. One is to turn off Wait For SL/Target Before Next Signal so a new signal can override the previous trade. The other is to set Stop-Loss Method to “ATR” so STOP and TARGET are sized off ATR and sit closer. The first gives you more signals, but overridden trades drop out of the win-rate count. The second lets you speed up trade turnover while keeping the stats meaningful.
Three More Mechanisms That Hold Signals Back
- Signal Only When Setup Becomes Fresh (default on) only fires on the bar where the conditions flip from “not met” to “met.” It won’t fire on every bar while the conditions stay true
- Minimum Bars Between Signals (default 5) blocks the next signal until 5 bars have passed since the last one. The 6th bar is the first one allowed
- If BUY and SELL conditions are both met on the same bar, only the side with the higher score fires. If the scores are tied, neither fires
The Fresh setting is easy to overlook, but it matters. Even if TARGET is hit mid-trend, no new BUY will fire as long as the conditions stay met. You have to wait for the conditions to break down once and then line up again.
I Compared the Display on Four Bitcoin Timeframes
With the default settings, I loaded it on Bitcoin (BTCUSDT) on the 15m, 1H, 4H, and daily charts and lined up the dashboards as of September 26, 2026.
| Timeframe | Market condition card | Trade | Win Rate (closed trades) |
|---|---|---|---|
| 15m | RANGE / SIDEWAYS | LONG | 46.5% (43) |
| 1H | RANGE / SIDEWAYS | LONG | 44% (84) |
| 4H | TRANSITION | FLAT | 45.7% (94) |
| Daily | BULLISH TREND | SHORT | 47.5% (40) |
Win rates ranged from 44% to 48%, all above the 40% break-even for a 1.5× TARGET. That said, none of this includes fees or spread. And with only 40 to 90 trades each, I don’t think it’s enough evidence to call it “profitable.”
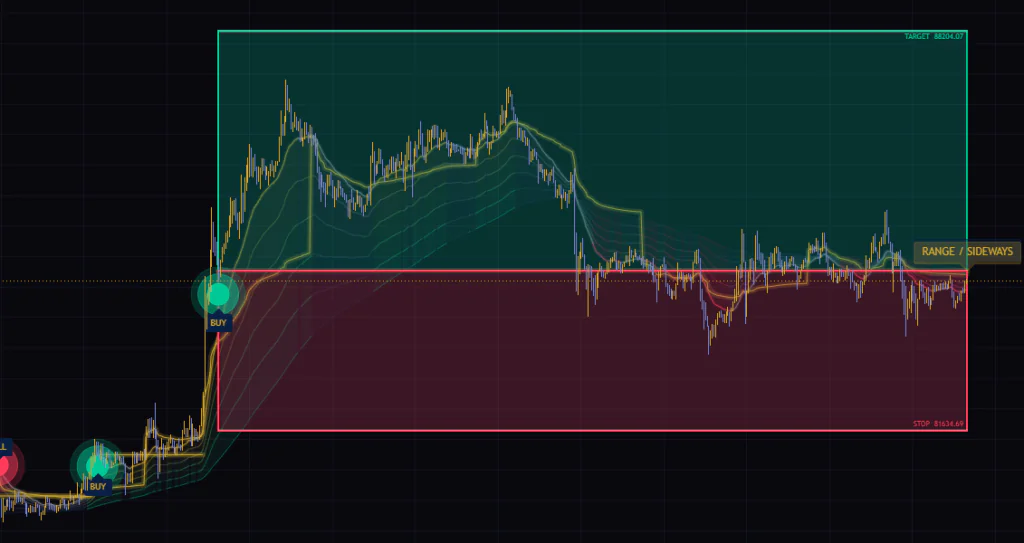
What caught my eye was the card’s classification. On the 15m chart, it still read “RANGE / SIDEWAYS” during a week when price moved more than $10,000 in about five days. The range check uses a fixed percentage, “the previous 30 bars within 5%,” so the smaller each bar’s range, the more likely a lower timeframe gets labeled as a range. On the daily chart, by contrast, 30 bars almost never fit inside 5%.
Three Default Settings That Cause Problems
The defaults of “Buy-Sell Signals using Multi-Logic Trading System” are close to the author’s “5m/15m day trading” preset. If you plan to use it on the 4H or daily chart, I’d recommend revisiting at least these three settings.
1Always set Higher Timeframe above your chart timeframe
The default for Higher Timeframe is “60” (1 hour). If you leave it as is on a 4H or daily chart, what’s supposed to be a higher timeframe ends up pulling an EMA from a timeframe lower than your chart. TradingView’s official documentation also explains that requesting a lower timeframe this way only returns the value of the last intrabar, which leads to repainting that can’t be reproduced in real time.
| Chart timeframe | Suggested Higher Timeframe |
|---|---|
| 5m | 30m or 60m |
| 15m | 60m (default) or 4H |
| 1H | 4H or Daily |
| 4H | Daily or Weekly |
| Daily | Weekly |
These pairings are based on the guidelines in the author’s description; I added the daily row myself. The further out you set the higher timeframe, the fewer signals you get, and the closer you set it, the more you get.
2Turn off the VWAP filter on daily and above
VWAP resets every session (every day for Bitcoin), so on the daily chart each bar is a full session on its own. VWAP then equals that bar’s (high + low + close) ÷ 3, and the filter turns into nothing more than a check of whether the close is above or below the middle of the bar. The author also lists turning off Use Session VWAP Filter as an option on higher timeframes.
3Match Maximum Range Width % to your timeframe
The default of 5% for Maximum Range Width % is too loose for Bitcoin’s 15m chart and too tight for the daily. Since a 30-bar range is typically several times the ATR, my starting point is “roughly 5× the ATR % shown on the dashboard.” Using ATR % as of September 26, 2026, that works out like this.
| Timeframe | ATR % (as of Sep 26, 2026) | Suggested Maximum Range Width % |
|---|---|---|
| 15m | 0.19% | Around 1% |
| 1H | 0.52% | Around 2.5% |
| 4H | 1.16% | Around 6% |
| Daily | 2.94% | Around 15% |
ATR % changes with volatility, so don’t treat these numbers as fixed. Check the dashboard now and then and adjust.
The Full Parameter Map and What Changes When You Tweak It
The settings are split into nine groups, with more than 40 inputs in total. You don’t need to touch all of them. Below, I focus on the inputs that drive the signal logic and list the default, my suggested value, and what happens when you change it. Anything marked “Keep default” is an input where I couldn’t find a reason to change it.
Market Condition, Higher Timeframe, and VWAP
| Setting | Default | Suggested | Effect |
|---|---|---|---|
| Fast EMA | 20 | Keep default | Price-side edge of the ribbon. Lower values let the stack align sooner and bring signals earlier |
| Medium EMA | 50 | Keep default | Used only for the stack check. Not plotted on the chart |
| Slow EMA | 200 | Keep default | Outer edge of the ribbon. Sets the long-term direction |
| Range Lookback | 30 | Keep default | Number of bars used for the range check. Longer values mean fewer range reads |
| Maximum Range Width % | 5 | About 5× ATR % | Lower values mean fewer range reads and fewer breakout signals |
| Use Higher-Timeframe Trend Filter | On | On | Turning it off lets trend and momentum signals fire against the higher timeframe too |
| Higher Timeframe | 60 | Higher than your chart timeframe | Timeframe for the HTF EMA. The further out, the fewer signals |
| HTF EMA Length | 50 | Keep default | Length of the HTF EMA. The author’s screenshot shows 200, but the actual default is 50 |
| Use Session VWAP Filter | On | On for intraday, off for daily and above | Turning it off allows signals against VWAP too |
Entry Logic
| Setting | Default | Suggested | Effect |
|---|---|---|---|
| Minimum Trend Confluence | 4 | 4–5 | Score required for trend signals. Setting it to 5 means fewer, higher-conviction signals |
| Enable Trend-Following Logic | On | On | Toggles the trend-following logic |
| Enable Momentum Logic | On | On | Toggles the momentum logic. Most early signals come from here |
| Enable Range Breakout Logic | On | On | Toggles the range breakout logic |
| Breakout Confirmation Buffer (x ATR) | 0.15 | 0.15–0.3 | Extra buffer required for a breakout. Higher values ignore shallow breaks |
| Breakout Min Close Position In Candle | 0.6 | 0.6–0.7 | Where the breakout bar must close. Higher values filter out long-wick bars |
| Require High Volume For Breakout | On | On | Requires at least 1.5× volume on the breakout bar |
| Enable Sideways Mean-Reversion Logic | Off | Off | Toggles the mean-reversion logic. Careful: in a trending market it means fading the trend |
| Mean-Reversion Min Range Width (x ATR) | 1.0 | 1.0–1.5 | Minimum range width for the mean-reversion logic |
| Mean-Reversion Min Rejection Wick Ratio | 0.35 | 0.35–0.5 | Wick length required on the rejection bar |
| Mean-Reversion Require RSI Turning | On | On | Requires RSI to have turned |
You can also change the RSI, MACD, and Bollinger Band lengths (RSI Length of 14, MACD 12/26/9, and Bollinger Band Length of 20 with a 2 standard deviation multiplier), but the score thresholds stay fixed, like RSI 45 and 72. Changing the lengths shifts RSI’s distribution and breaks its relationship with those thresholds, so I keep them at their defaults.
Volume, Risk Management, and Signal Management
| Setting | Default | Suggested | Effect |
|---|---|---|---|
| Use Volume Filter When Available | On | On | On symbols with volume data, requires high volume for momentum and other signals |
| Volume MA Length | 20 | Keep default | Number of bars for the volume average |
| High-Volume Multiplier | 1.5 | 1.5–2.0 | Multiplier that defines high volume. Higher values mean fewer signals |
| OBV MA Length | 14 | Keep default | Number of bars for the average OBV is compared against |
| ATR Length | 14 | Keep default | ATR length used for STOP and the breakout check |
| Stop-Loss Method | Structure + ATR | Default for intraday, ATR for daily | How STOP is placed. ATR keeps the distance consistent |
| Target Method | Risk:Reward | Risk:Reward | How TARGET is placed |
| Structure Swing Lookback | 10 | 10–20 | Range for the recent low used as the STOP reference. Also affects the sixth score condition |
| Structure ATR Buffer | 0.2 | 0.2–0.3 | Buffer between the recent low and STOP |
| Stop ATR Multiplier | 1.5 | 1.5 | STOP distance for the ATR method |
| Risk:Reward Ratio | 1.5 | 1.5–2.0 | TARGET distance. At 2.0, the break-even win rate drops to about 33% |
| Clear Levels After SL/Target Hit | On | On | When off, levels remain after the trade resolves and the win rate isn’t tallied |
| Minimum Bars Between Signals | 5 | 3–5 | Minimum spacing between signals |
| Signal Only When Setup Becomes Fresh | On | On | Fires only on the bar where conditions newly line up |
| Wait For SL/Target Before Next Signal | On | On for intraday; consider off for daily | Blocks the next signal until the trade resolves |
| Allow Opposite Signal Before Exit (if wait is OFF) | On | On | With waiting off, whether an opposite signal can replace the open trade |
As the name says, Allow Opposite Signal Before Exit (if wait is OFF) only matters when Wait For SL/Target Before Next Signal is turned off. With waiting off, a new signal in the same direction always replaces the previous trade. This switch only decides whether an opposite-direction signal can replace it too.
On the display side, you can hide the markers, entry beam, boxes, ribbon, VWAP, card, and dashboard individually. Turn on Gradient Candle Coloring By Trend Strength, which is off by default, and the candles get painted from green to red based on the gap between Bull Score and Bear Score. It’s handy when you want to scroll back and see how the score evolved.
Setting Combinations by Use Case
| Use case | Settings to change | Goal |
|---|---|---|
| 15m day trading (based on defaults) | Maximum Range Width % to around 1% | Make the range read more realistic and cut down on excessive breakout signals |
| 1H–4H swing trading | Higher Timeframe to 4H or Daily, Minimum Trend Confluence to 5 | Reference the higher timeframe correctly and narrow it down to higher-conviction signals |
| Riding the bigger trend on the daily | Use Session VWAP Filter off, Stop-Loss Method to ATR | Remove the mostly meaningless VWAP check and increase trade turnover |
| Cutting down noise | High-Volume Multiplier to 1.7–2.0, Minimum Bars Between Signals to around 8 | Filter out moves without volume and back-to-back signals |
Repainting and Alerts
“Buy-Sell Signals using Multi-Logic Trading System” only evaluates signals when a bar closes. Markers don’t appear and disappear in the middle of a live bar. The higher-timeframe EMA also uses the last confirmed value in real time.
There is one fine point, though. On historical bars, the last bar right before the higher timeframe rolls over uses the freshly confirmed higher-timeframe value. In real time, that same bar is still using the previous value, so on that single boundary bar, the historical and real-time results can differ. It only affects a small number of bars, but it’s one more reason not to treat historical signals as a track record at face value.
There are four alert conditions available.
| Alert condition | What it means | Timing |
|---|---|---|
| ATS Pro BUY | Confirmed BUY signal | On bar close |
| ATS Pro SELL | Confirmed SELL signal | On bar close |
| ATS Pro Stop Hit | Price touched the open trade’s STOP | Triggers the moment price touches it, even mid-bar |
| ATS Pro Target Hit | Price touched the open trade’s TARGET | Triggers the moment price touches it, even mid-bar |
On top of that, with Enable Dynamic alert() Messages turned on, it can send messages that include the symbol, entry price, STOP, and TARGET. When you create an alert in TradingView, pick this indicator as the condition and choose the alert() function call option to receive them. Since every BUY or SELL arrives with its stop and target prices, it works well if you run your trading off mobile notifications.
Win Rate counts a TARGET touch as one win and a STOP touch as one loss. Fees and slippage aren’t included, and if both TARGET and STOP are touched on the same bar, it adds both a win and a loss.
Trades that get replaced mid-way because Wait For SL/Target Before Next Signal is off aren’t counted, and nothing is counted if Clear Levels After SL/Target Hit is off. The author also notes in the description that this win rate is a simple internal statistic and should be verified separately.
There’s also a cap on the number of markers. Each marker uses four labels, and the label limit is 500, so the oldest ones get deleted and only about the latest 120 remain. That’s fewer than you might expect.
If you want to see older signals, use Bar Replay to go back to that period, and you’ll see the markers drawn from the calculation up to that point.
Pairs Best With Pivot Points Standard: Check What Stands Between You and TARGET
“Buy-Sell Signals using Multi-Logic Trading System” pulls together a wide range of signal inputs, but it doesn’t look at horizontal levels sitting between entry and TARGET. The author also tells you to check for yourself “whether there’s enough room before the next major level.” If you’re going to pair it with something, I think TradingView’s built-in Pivot Points Standard is the easiest option. It automatically plots the day’s key levels (P, R1, S1, and so on) from the previous day’s high, low, and close.
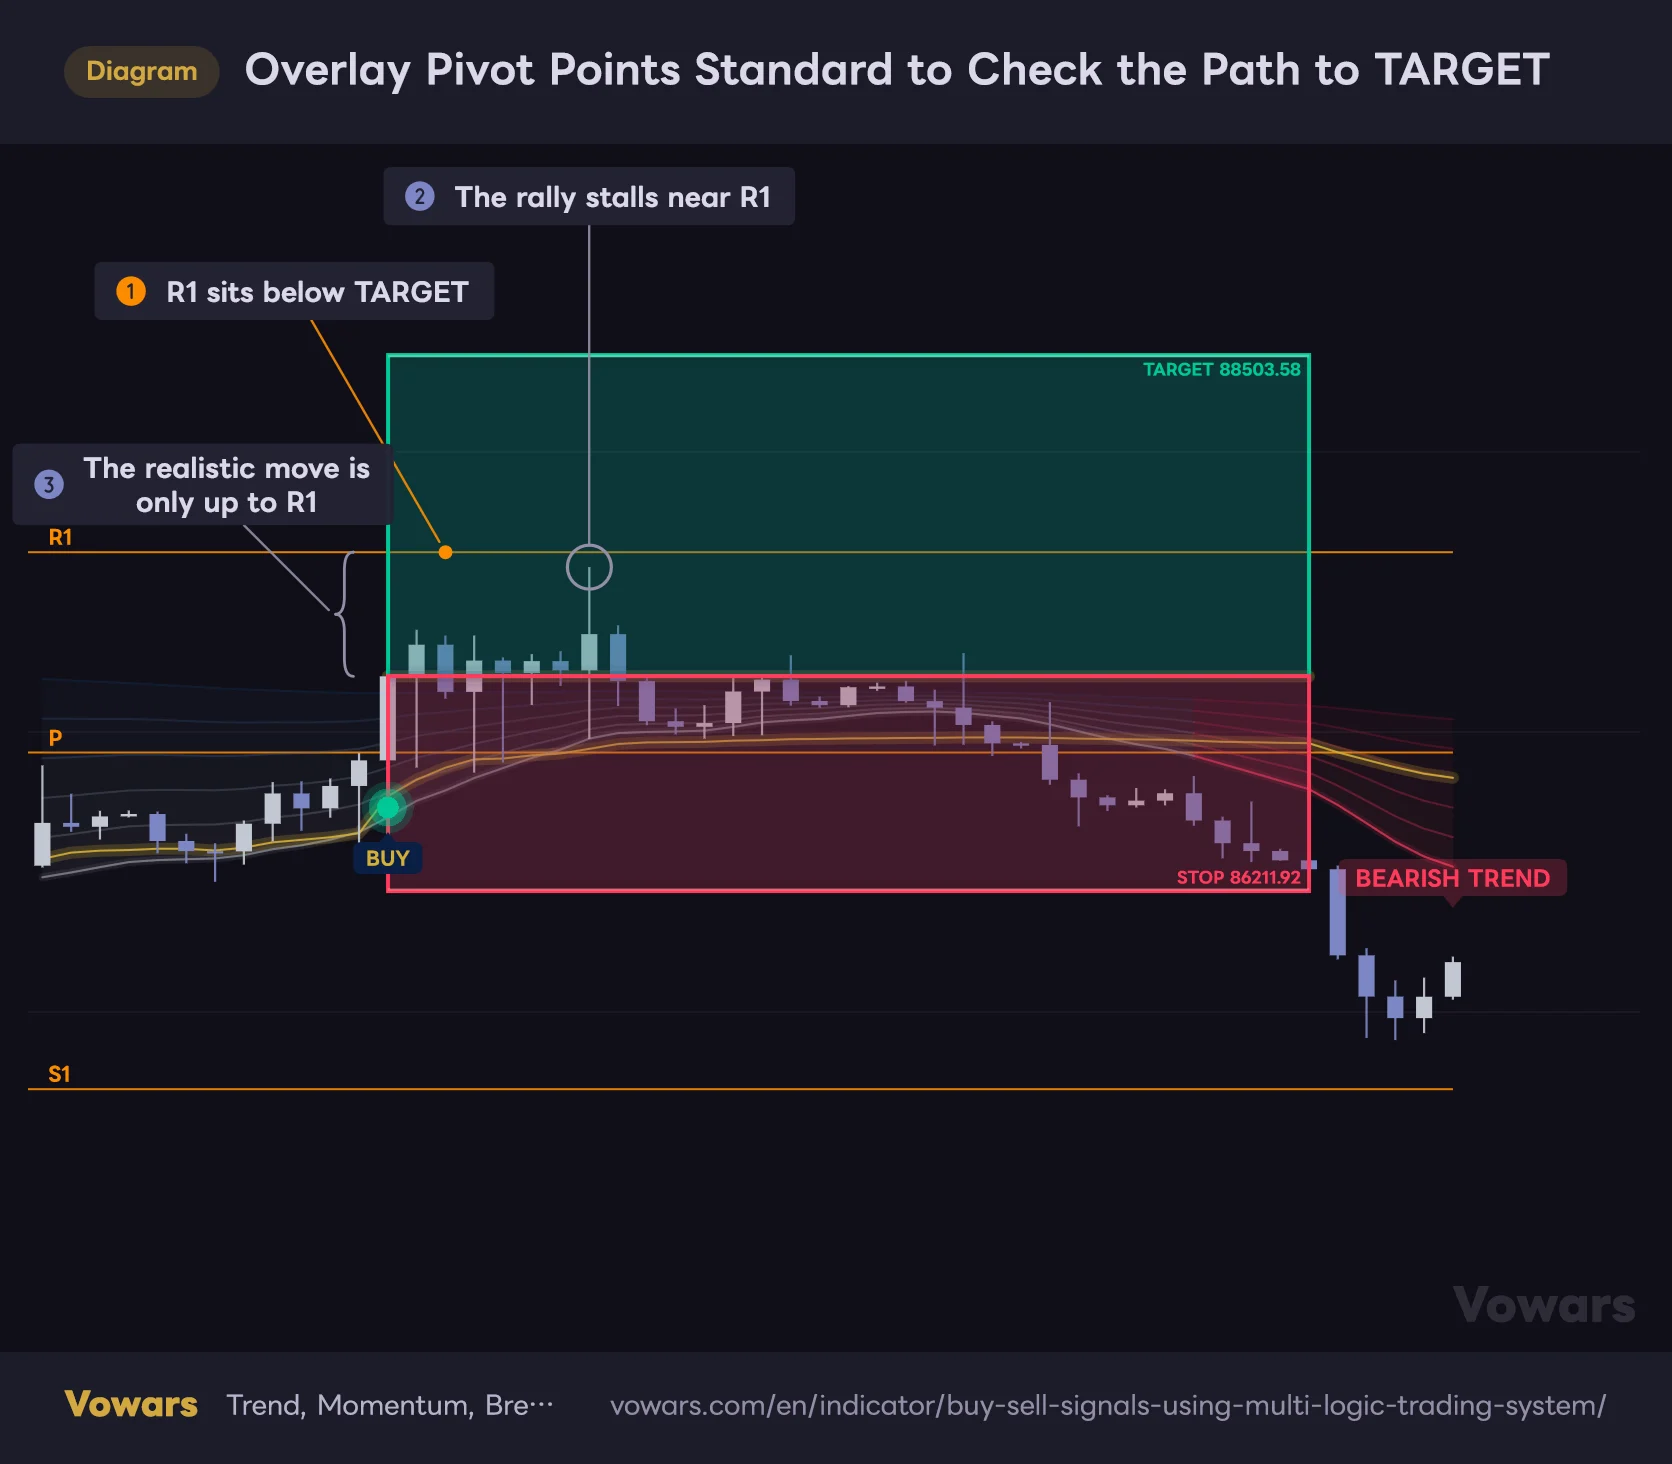
Overlay Pivot Points Standard to Check the Path to TARGET
“Buy-Sell Signals using Multi-Logic Trading System” doesn’t account for levels sitting in front of TARGET. Overlaying R1 from Pivot Points Standard shows at a glance what stands in the way.
Vowars DE ver.3.12.1
In the chart, R1 sits below the BUY’s TARGET (callout ①). Price stalls just short of R1 (callout ②) and then drops all the way to STOP. If you can see R1 at the time of entry, you can treat the move shown at callout ③, the distance to R1, as the “realistic target” and compare it to your stop distance to decide whether to pass on the trade.
My routine is simple.
- Check whether any lines like R1 or S1 sit between the entry and TARGET
- If there are, make sure the distance to that line is comfortably larger than the distance to STOP
- If it’s smaller, either pass or enter with the plan to take partial profits just before that line
You can switch the pivot period to daily, weekly, and so on in the Pivot Points Standard settings. On the 1H chart and above, switching to weekly pivots seemed to give me levels that held up better.
Where It Shines and What to Watch Out For
What you can count on
- STOP and TARGET are drawn with every signal, so you can see the risk/reward outlook on one screen
- The status of all four logics and filters is gathered in the dashboard, so you don’t have to hunt for inputs
- Signals only fire after the bar closes and never appear or vanish mid-bar
- Almost every display element and logic can be toggled individually, so you can strip it down to fit your style
- Alerts can include the entry, STOP, and TARGET prices
What to watch out for
- The marker doesn’t tell you which logic triggered the signal
- Higher Timeframe defaults to 1 hour, so on the 4H chart and above it won’t act as a higher timeframe unless you change it
- The range check uses a fixed 5%, so the classification is skewed depending on the timeframe and symbol
- Because it blocks new signals until the trade resolves, higher timeframes can go months without a signal
- The VWAP, entry beam, and ribbon all use overlapping shades of gold, making the lines easy to mix up
It works best on intraday charts of symbols with solid volume data: Bitcoin, index futures, and liquid large-cap stocks fit the bill. On symbols without volume data, the volume conditions are skipped automatically, so signals still fire, but the fifth score condition always scores 0. On symbols like FX, where the meaning of volume varies by data provider, I’d keep an eye on the dashboard’s Volume Ratio to see how the volume conditions are actually playing out.
A Multi-Logic Signal Tool That Shines When You Pick the Right Logic for the Market
 Image
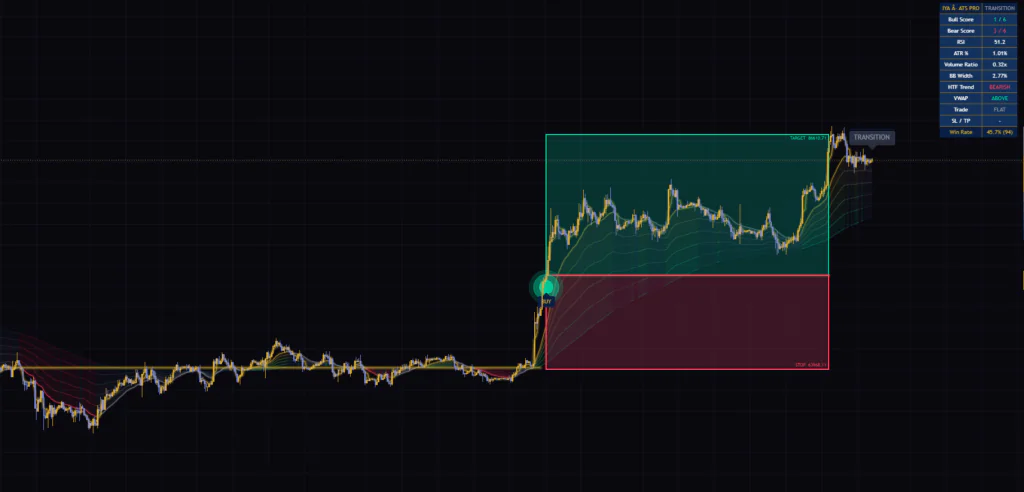
ImageAfter a few days with “Buy-Sell Signals using Multi-Logic Trading System”, my impression of it changed completely. It’s not the kind of indicator that tells you when to buy and sell just by being on your chart. It’s a framework for choosing the right logic and filters for the current market conditions. That’s exactly what the author means at the end of the description when they write, in essence, “trade according to the current market regime instead of forcing the same strategy onto every market.”
Used on the 15m chart with the defaults, the signal timing and the STOP/TARGET distances feel natural and the whole display hangs together nicely. On the 4H and daily charts, though, the filters won’t work as intended until you fix three things: the higher timeframe, VWAP, and range width. If you don’t mind putting in the time to tune the settings, it’s a handy indicator that keeps all your decision inputs in one place.
Signals only point to potential trades and don’t guarantee profits. The dashboard win rate is a simplified tally as well. Before trading it live, I recommend using Bar Replay on your own symbol and timeframe to step through the signals one by one and see what happened before and after each.