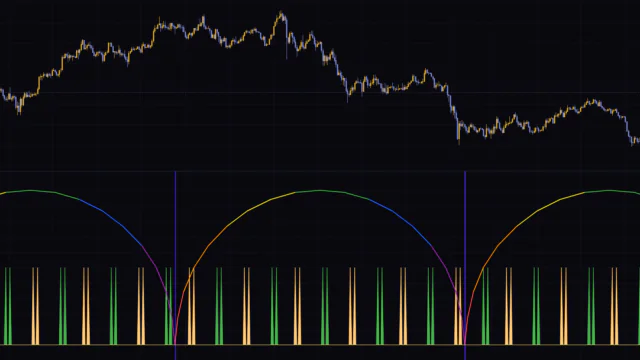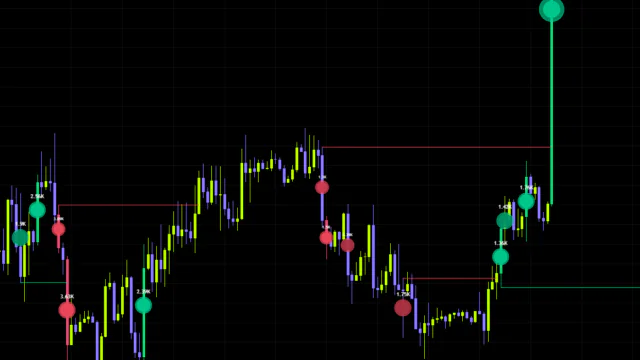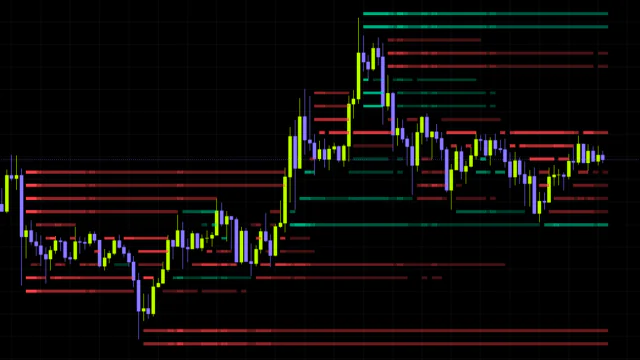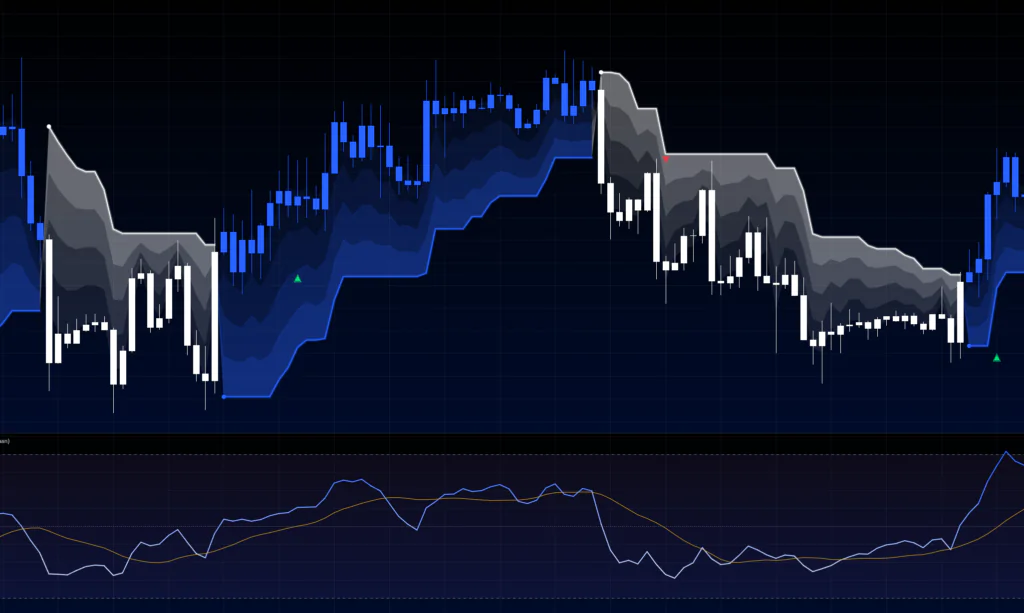


What this indicator is actually reading
In one sentence, Machine Learning RSI is an oscillator that digs up past bars where RSI was behaving the way it is right now, then puts what happened next to a vote.
A standard RSI is read through a fixed rule: above 70 is overbought, below 30 is oversold. Machine Learning RSI throws that framing out and cares far more about how RSI is behaving than about the number it prints. How fast is it moving, is that move accelerating, how extreme is it versus the last 100 bars, how far apart are the fast and slow RSIs — all of that gets bundled into a “momentum fingerprint” for the current bar, and the engine goes looking for past bars with a similar fingerprint.
Each historical match then votes: “price went up after this one,” “this one rolled over.” The tally becomes the current directional bias, and only after that bias clears two separate scores — Rank (setup quality) and Confidence (how sure the model is) — does a triangle marker finally print on the chart.
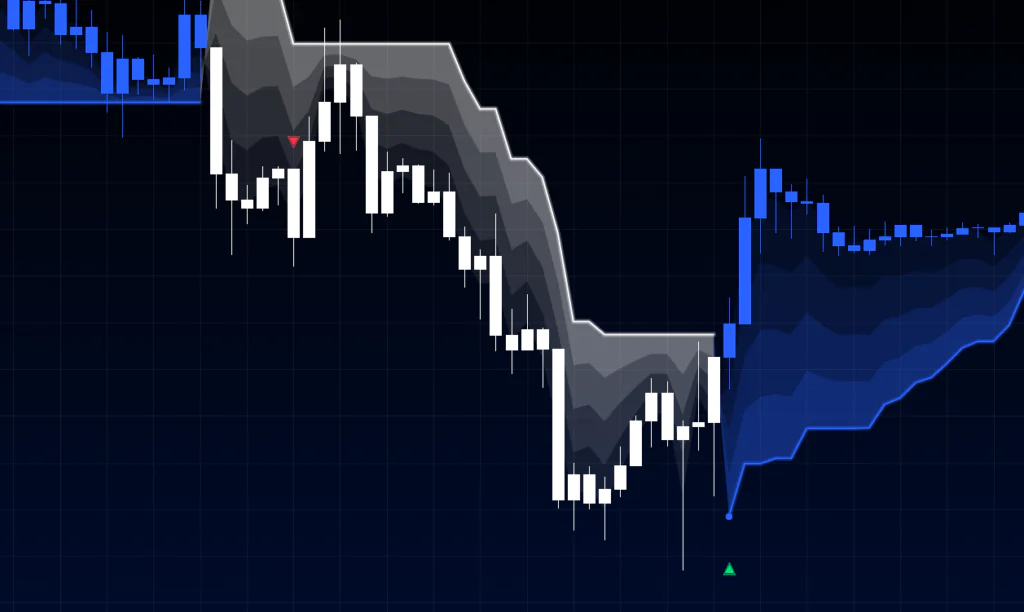
Machine Learning RSI breaks RSI down into eight separate measurements and decides direction by looking at what followed similar conditions in the past. A change in bias alone won’t print a signal — it has to clear both the quality and the conviction thresholds first.
Sorting out everything it draws on your chart
Once you add Machine Learning RSI, you get visuals in both the price pane and the lower pane. It’s a lot to take in at first, so it helps to split it out piece by piece.
| Where it appears | What you see | What it means |
|---|---|---|
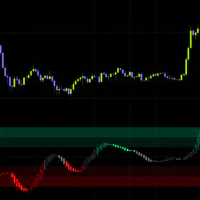
| Lower pane | ML RSI line | A 0–100 line: standard RSI with a conviction-based tilt, then smoothed |
| Lower pane | Signal line (SMA 14 by default) | A smoothed reference line over the ML RSI. Crosses work as a secondary trigger |
| Lower pane | 70 / 50 / 30 levels plus a tinted band | The overbought, neutral and oversold reference zones |
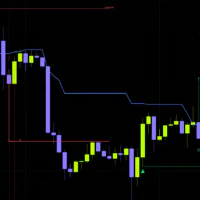
| Price chart | ML Supertrend and its glow | A trailing stop whose band width changes with model conviction |
| Price chart | Trend cloud | A four-layer gradient fill between the stop line and price |
| Price chart | Candle coloring | Regime color matching the Supertrend direction (default: uptrend blue, downtrend white) |
| Price chart | Triangle markers | Long (up) and short (down) entry cues that cleared every condition |
| Price chart | Small dots | The bar where the Supertrend flipped direction |
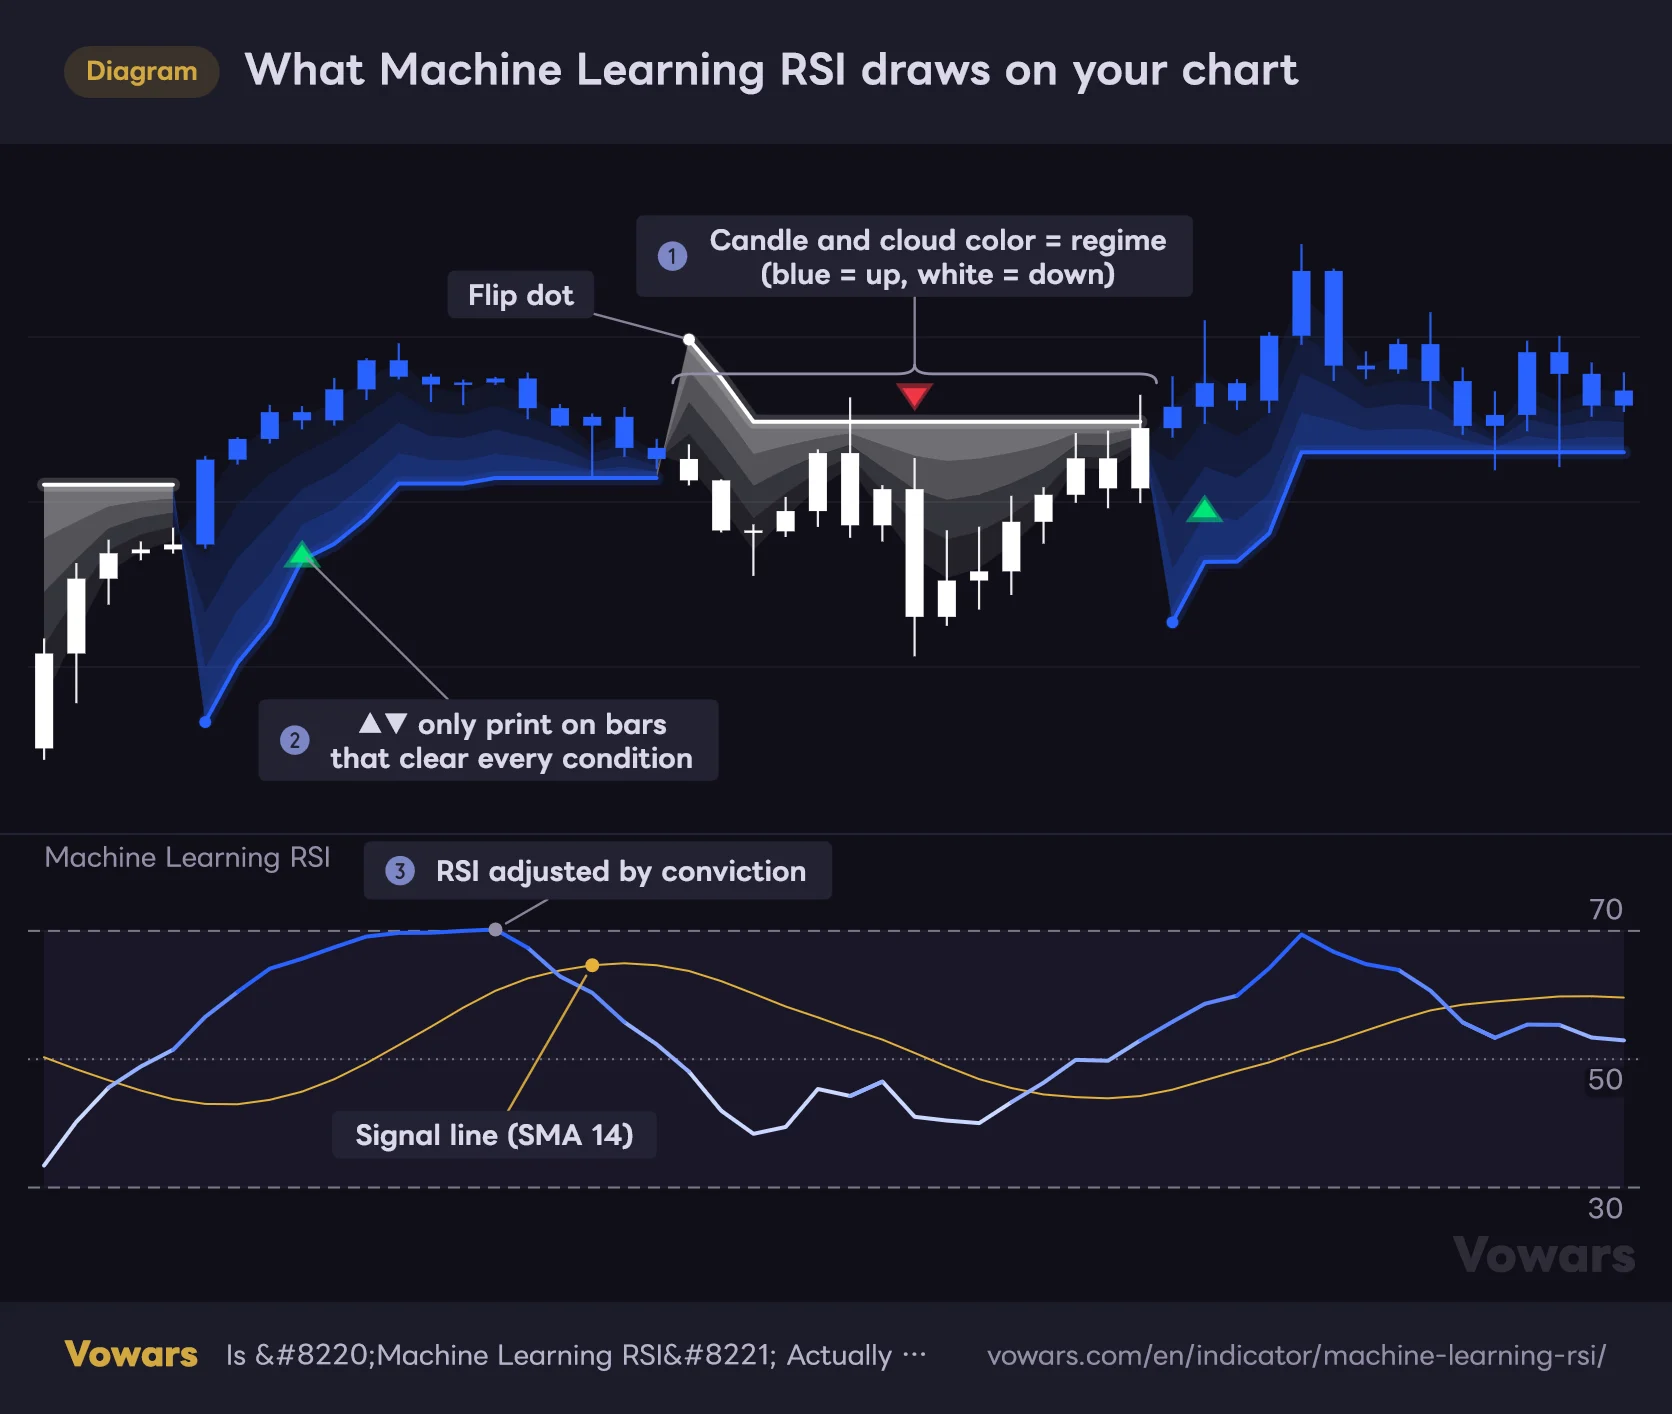
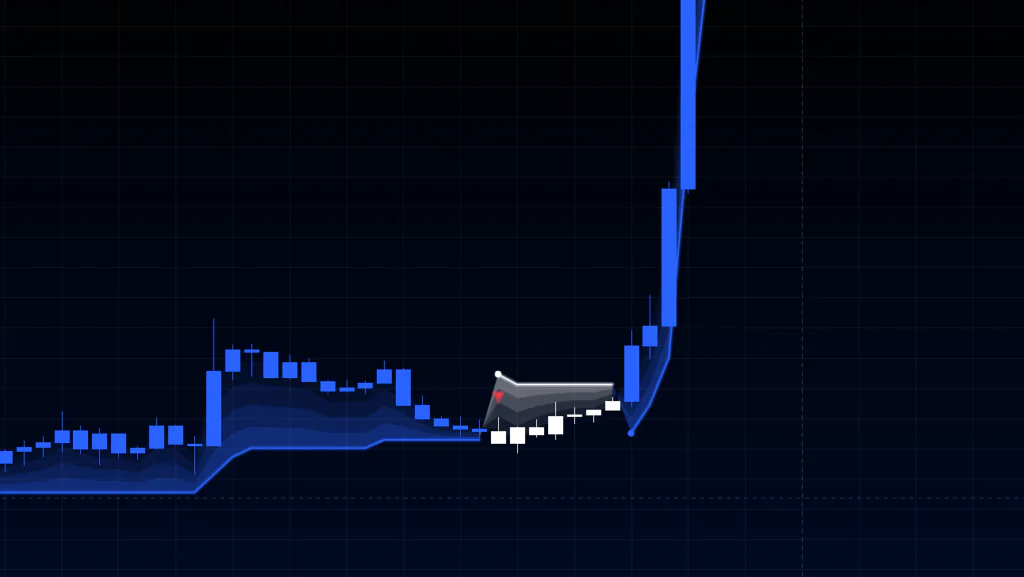
Here’s what that looks like on a chart. The key point: candles, cloud and stop line all take their color from the same thing — the direction of the stop. Wherever you look, the regime color agrees, so color alone tells you which side the market is on.
What Machine Learning RSI draws on your chart
The upper pane shows the regime and the trade cues; the lower pane shows an RSI adjusted by model conviction.
Vowars DE ver.3.11.0
The default palette is a little unusual: blue for up, white for down. If you’re used to green and red, recoloring is probably the first thing you’ll want to do. The triangle markers are the exception — they ship as lime for longs and red for shorts, so those read clearly out of the box.
Entry markers are plotted at the lowest low (longs) or highest high (shorts) of the last 5 bars. The height of the triangle isn’t your entry price — it’s just placement to keep the marker off the candles. The signal itself is established at the close of that bar.
Under the hood: eight RSI features, matched against history
1. Building eight features out of one RSI
Machine Learning RSI takes the base RSI (default 14) and computes these eight measurements on every bar.
- RSI value — the raw reading itself
- RSI slope — how much it has moved versus 3 bars ago
- RSI acceleration — the change in that slope: is momentum igniting or fading
- Distance from neutral (50) — which way it leans, and by how much
- RSI percentile rank — how extreme the current reading is within the last 100 bars
- RSI volatility — how erratic RSI itself is (steady momentum versus jumpy momentum)
- Fast/slow RSI spread — the gap between the half-length and double-length RSIs
- RSI regime — how far a 20-period smoothing of RSI sits from 50
The percentile rank is the one worth calling out. Plenty of instruments rarely tag 70 or 30 at all, but because the engine also asks “is this extreme by this market’s own recent standards,” it isn’t chained to the classic 70/30 levels. That design fits price action like Bitcoin’s, where RSI can stay pinned high through an entire leg up.
2. Banking history and labeling the outcome
On every closed bar, those eight features get stored alongside “what price did over the next 4 bars.” The cap on how many rows are kept is Memory Depth (bars) (default 500).
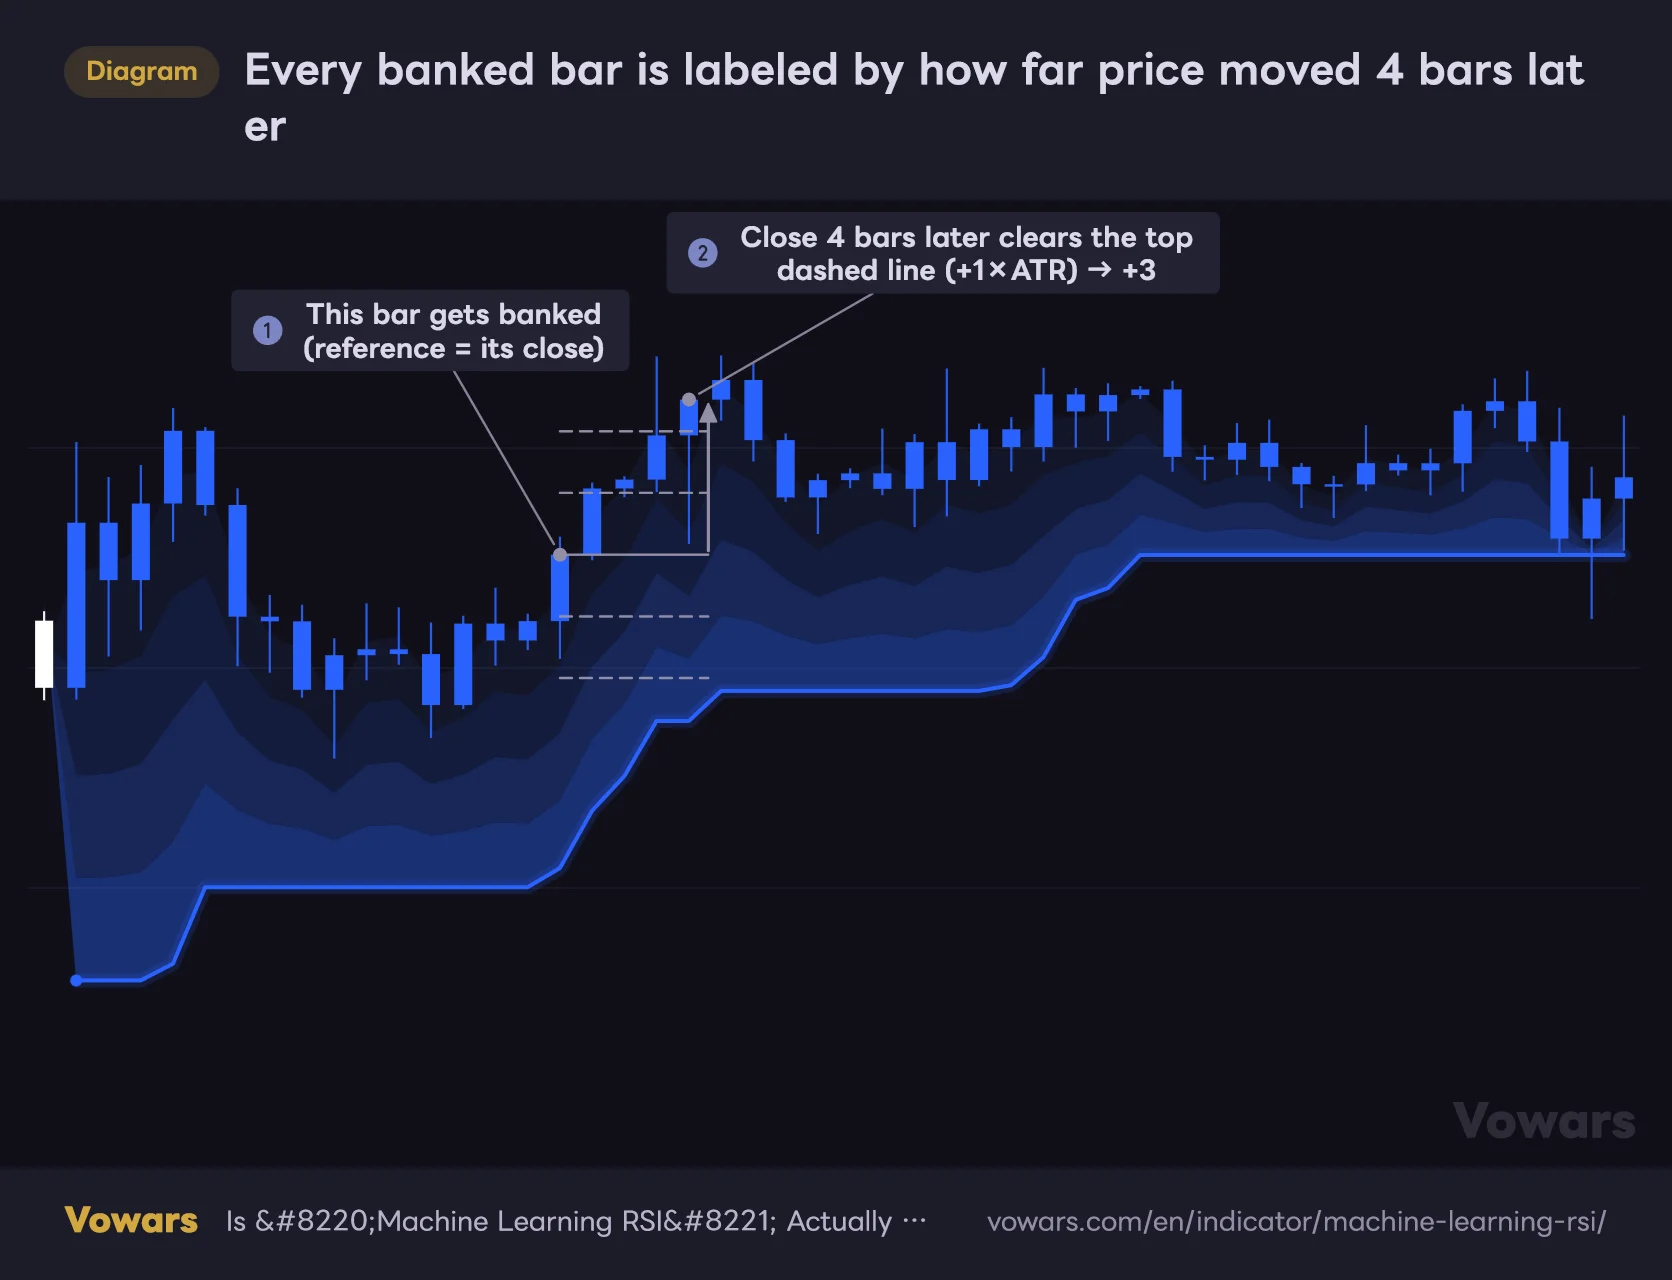
The “what price did” part is measured against ATR. Using Learning Sensitivity (×ATR) (default 0.5) as the yardstick, a close 4 bars later that’s within 0.5× ATR is labeled +1, up to 1× ATR +2, and beyond that +3 — giving a graded label from −3 to +3. It’s not a crude green-candle/red-candle split; each move is weighted by whether it was meaningful relative to volatility at the time.
Every banked bar is labeled by how far price moved 4 bars later
Each stored bar gets a label from −3 to +3 depending on whether the close 4 bars later cleared 0.5× or 1× ATR.
Vowars DE ver.3.11.0
These labels become the weight of each bar’s vote in the next step. A +3 bar casts a bullish vote three times as strong as a +1 bar.
Outcome labels are always judged on the next 4 bars — roughly 4 hours on the 1H, roughly 4 days on the daily. What Machine Learning RSI learns is short-horizon price behavior, and the higher your timeframe, the longer the implied hold per signal. Worth keeping in mind when picking a chart to run it on.
3. Finding the closest matches and letting them vote
The engine measures the gap between the current bar’s features and each stored bar’s features, then keeps the closest Analog Count (k) (default 8). It compresses those gaps logarithmically instead of using them raw, so one wildly mismatched feature won’t blow up the similarity read on its own. Outlier-resistant, in other words.
Those 8 matches each vote, and closer ones carry more weight. A positive tally means bullish, negative means bearish. When the tally lands in the middle, it’s treated as no direction at all, and no signal can come from it.
Of the stored bars, only every 4th one is eligible as a match. Neighboring bars overlap so heavily that they add nothing, so the engine thins them out to keep the pool diverse. Set Memory Depth (bars) to 500 and your actual candidate pool is around 125 — worth remembering when you tune.
4. Learning which features matter, automatically
With Auto-Optimize Weights (on by default), the engine uses the banked history to ask, on every bar, “which feature separates the bullish outcomes from the bearish ones most cleanly?” and reassigns the weights accordingly. Features doing the heavy lifting get weighted up; the rest lose influence. No feature ever drops to zero, though — there’s a floor built in.
The optimizer needs at least 60 banked rows before it kicks in, so you won’t see true behavior right after loading a chart, or on symbols with thin history. More on that in the caveats below.
5. Filtering through Rank and Confidence
A direction alone prints nothing. This next part is arguably the heart of Machine Learning RSI.
| Score | What it measures | What feeds it |
|---|---|---|
| Rank | Setup quality | Agreement among the matches, how tightly clustered they are, alignment with trend direction, healthy volatility, regime fit, RSI slope fit, and how long the current call has held. Penalties are then subtracted for chop, stretched conditions and rapid recent flips |
| Confidence | Model conviction | Mostly agreement and tightness of the matches, plus credit for how long the call has persisted and slope fit. Heavy deductions if the engine has been flipping repeatedly |
By default, nothing prints unless Rank is 60 or higher and Confidence is 50 or higher. One practical detail before you touch anything: Rank realistically tops out around 95 and Confidence around 90. Assume they’re true 100-point scales and crank the gate to 80, and you’re asking for far more than you think. The default 60 is effectively demanding close to 70% of the achievable score.
The other easy-to-miss detail: on the bar where the call flips, the persistence credit is zero. Since signals only fire on that flip bar, Confidence has to clear 50 on agreement and tightness alone. In my runs, most of the skipped signals were caught right here on Confidence.
The ML Supertrend: a trailing stop that breathes with conviction
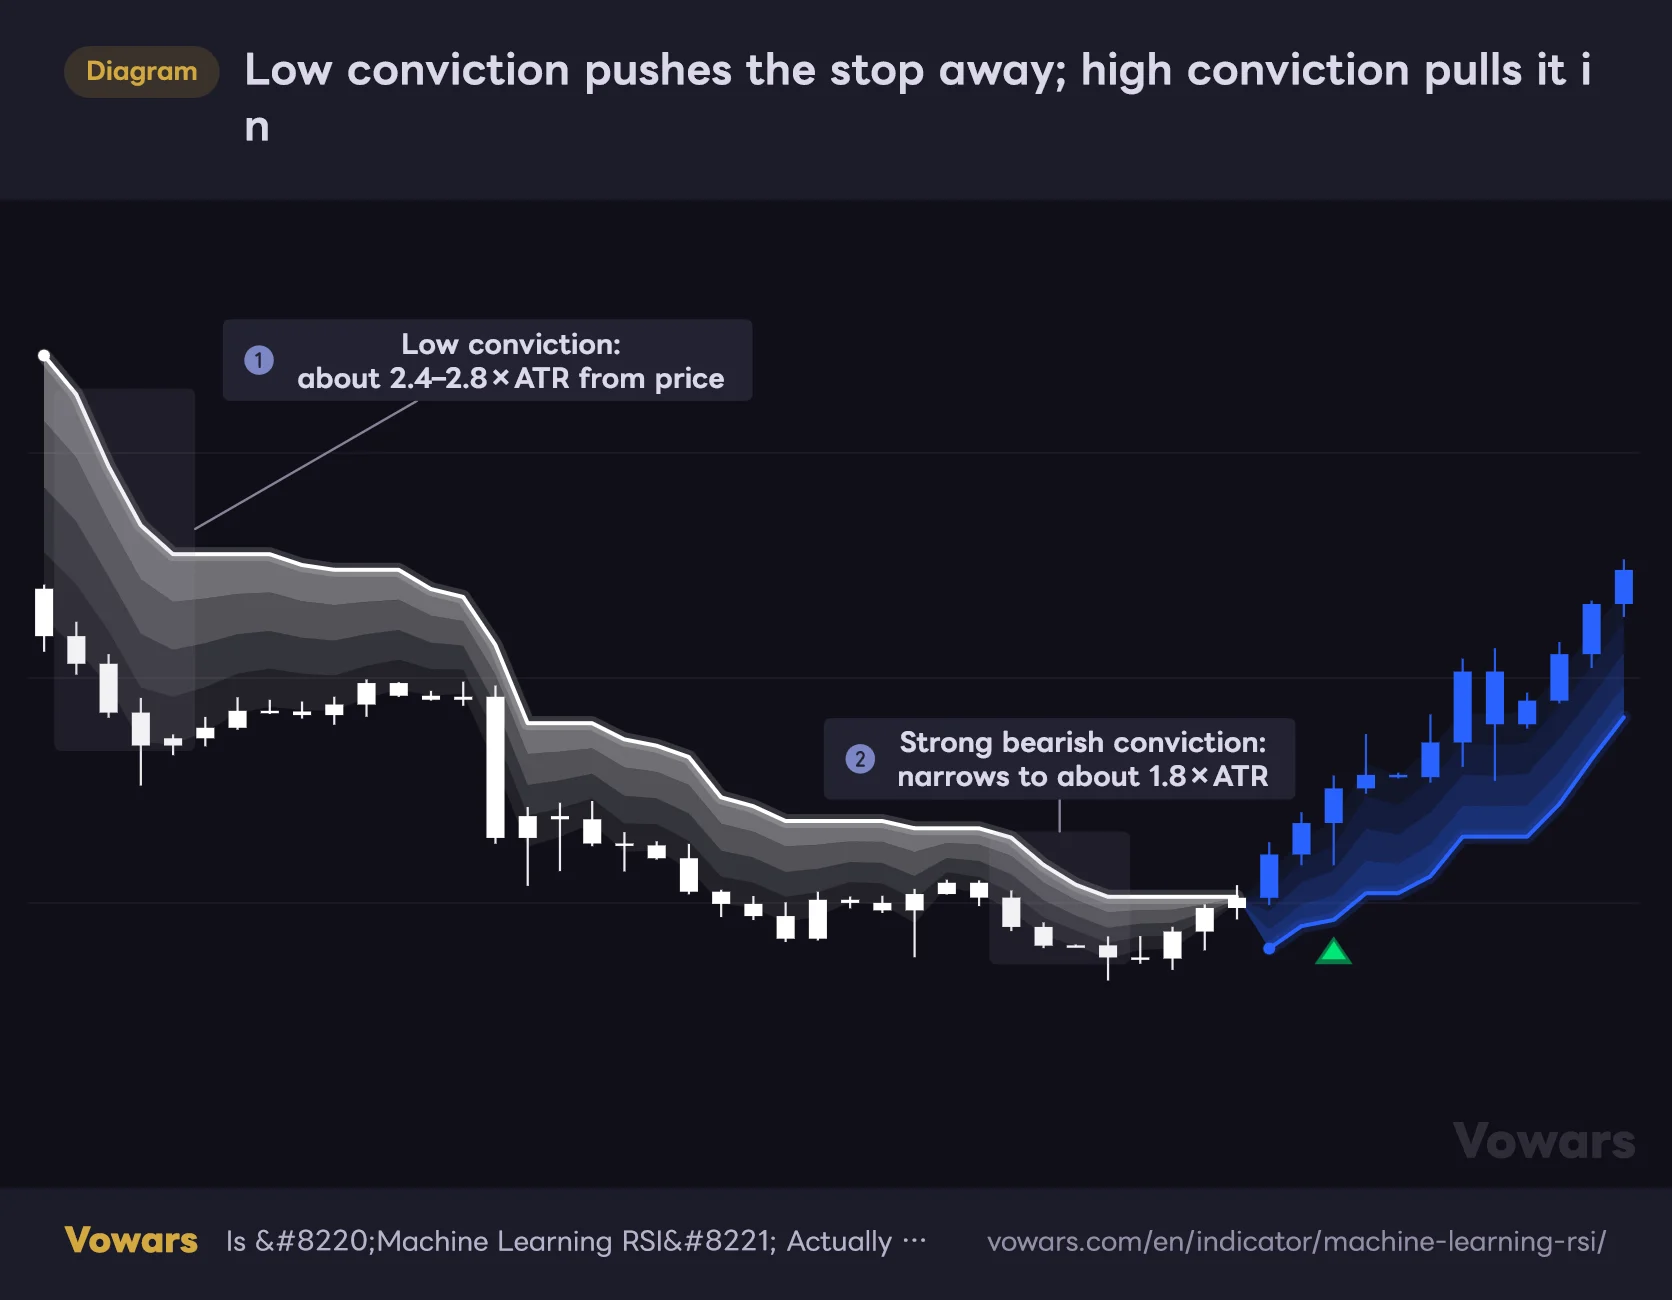
The line in the price pane looks like an ordinary Supertrend, but the band width isn’t fixed.
- High conviction — bands tighten, the stop trails closer to price, and trend flips are picked up sooner
- Low conviction, or chop detected — bands widen to stay out of the way of whipsaw
On defaults (ATR Multiplier 1.5, ML Band Adaptivity 1), the effective multiplier swings roughly between 1.5× and 3.0×. When conviction is near zero you’re effectively running a loose 3.0× stop, and framing it that way makes the behavior easier to read. The ATR length here is hard-set at 10.
Low conviction pushes the stop away; high conviction pulls it in
The trailing stop never sits tighter than 1.5× ATR and widens up to 3.0× as conviction fades.
Vowars DE ver.3.11.0
As ② shows, conviction works regardless of direction. In a downtrend, strong bearish conviction pulls the stop in just the same. When the stop is flat, though, its distance to price is just carried over from where it last moved. If you want to read the current width, look at bars where the stop is actually moving.
This line isn’t just decoration. Through Trend Gate (Signals must align with trailing stop), its direction determines whether a signal can fire at all: longs only while it reads up, shorts only while it reads down. Candle coloring follows the same direction.
Putting it to work on a Bitcoin chart
1Leave it on defaults and read the regime first
Drop it on the Bitcoin 1H and the first thing to do is look at the candle colors and the direction of the Supertrend — not the wiggles in the ML RSI. You just want to know which side the market is on. When a trend is running, the stop tracks alongside price and the cloud stays thin. With no direction, the line drifts away from price and the cloud fattens up, so you can eyeball a range before analyzing anything.
2Check where momentum sits on the ML RSI
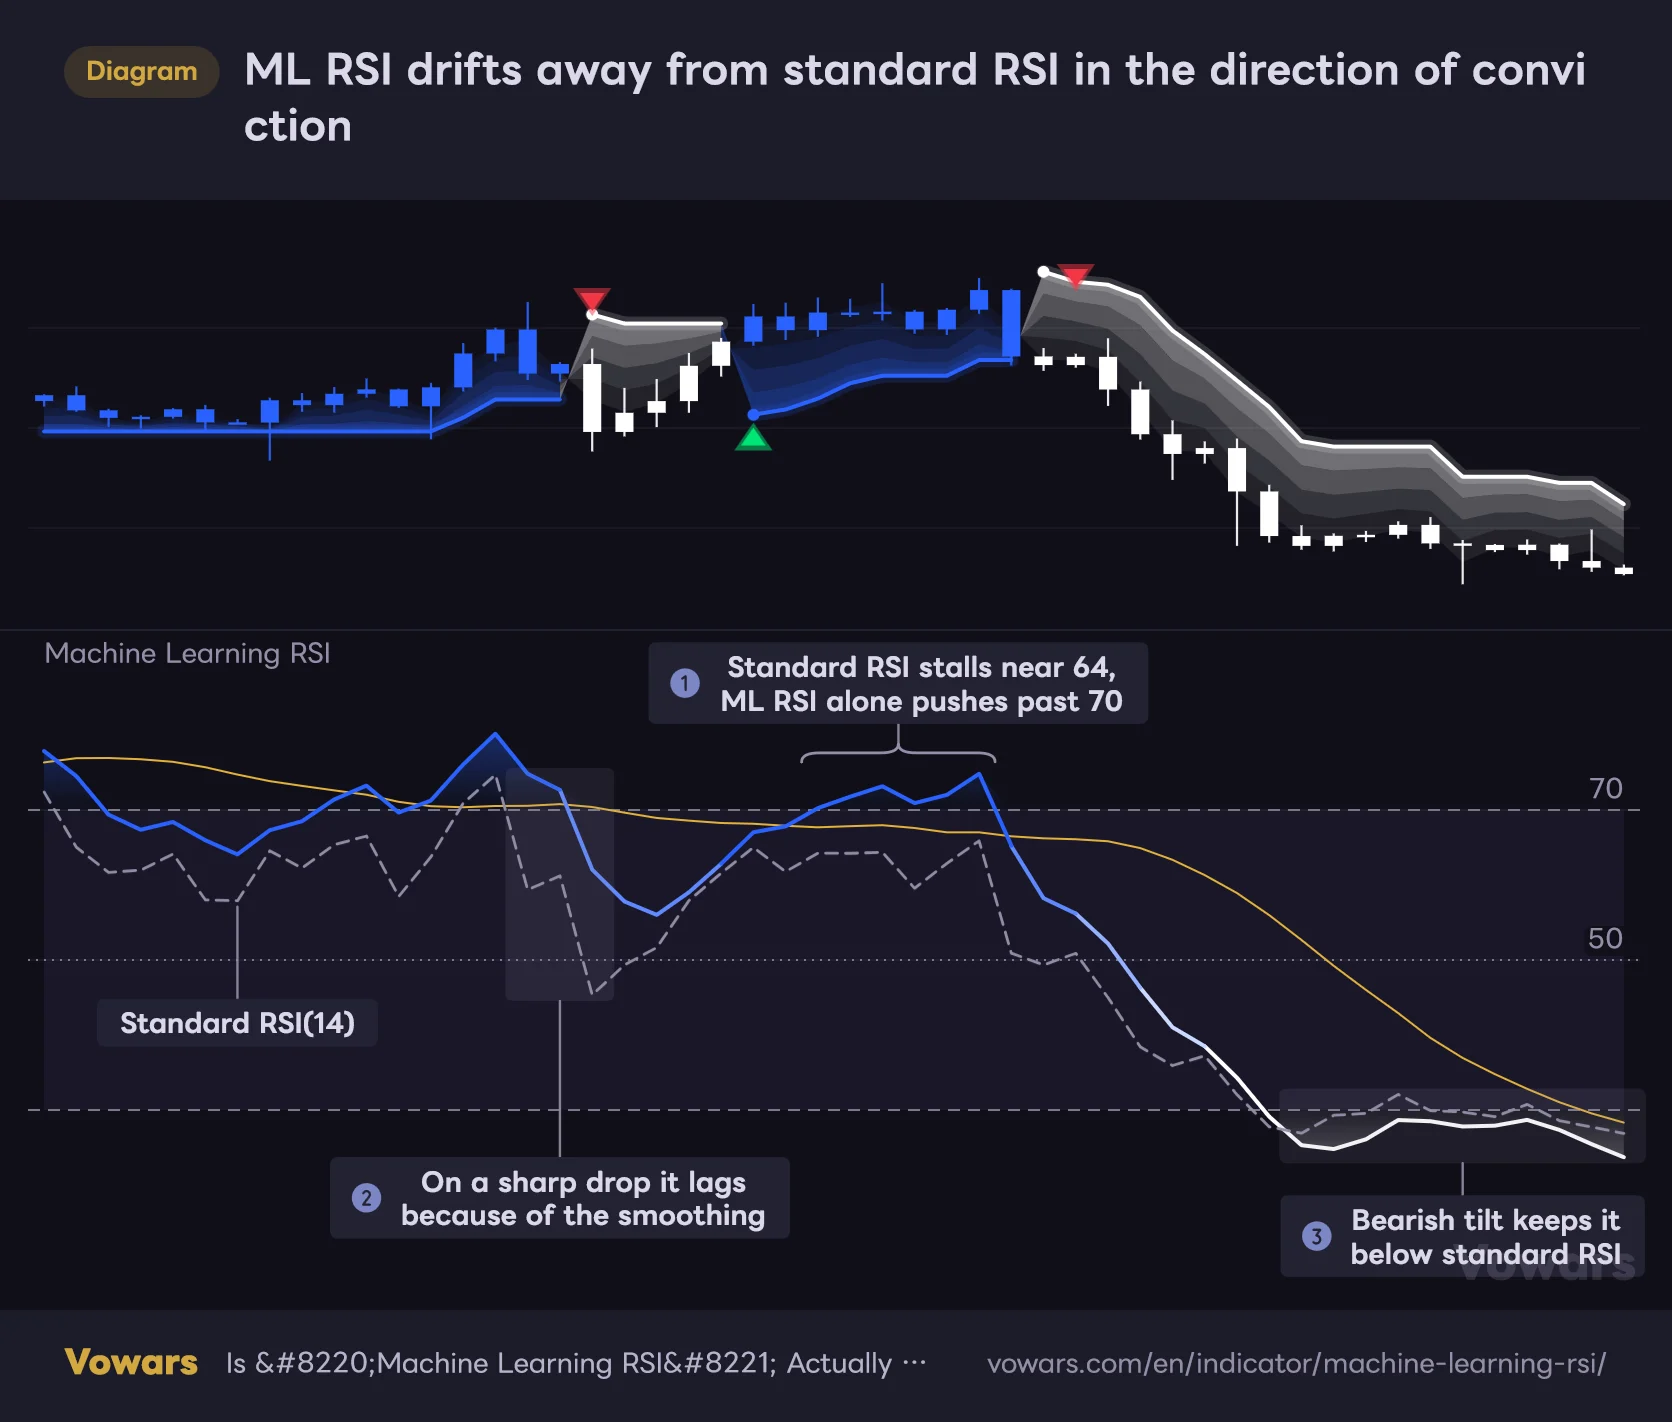
The lower-pane line is standard RSI with a conviction-based tilt added, then smoothed over 3 bars. At full conviction that tilt can push the line up or down by about 18 points, which is why it can reach 70 or 30 earlier than a plain RSI. If a plain RSI prints 64 while this one shows 73 on the same bar, that’s the tilt doing its job, not a bug.
ML RSI drifts away from standard RSI in the direction of conviction
The dashed line is a standard RSI(14). Bullish conviction lifts ML RSI, bearish conviction drags it down, and the result is smoothed over 3 bars.
Vowars DE ver.3.11.0
As ② shows, the smoothing also means it lags a standard RSI on sharp pullbacks. An ML RSI break below 70 can come a little after the plain RSI’s.
Reading it is straightforward: above 50 favors the bulls, below 50 the bears, and pushes beyond 70 or under 30 mark strong momentum. A cross of the signal line (SMA 14 by default) works as an early heads-up that a full signal may be coming.
3Watch a few weeks of signals before touching anything
This is the step people skip, and it matters most. Every filter is on by default, so on something like Bitcoin that alternates sharply between trend and range, the marker count gets thinned out considerably. Spend a few weeks watching how often signals appear on your timeframe, decide whether that’s too many or too few, and only then start adjusting. Jump straight to moving thresholds and you’ll have no idea what caused what.
4Set alerts so you’re not glued to the screen
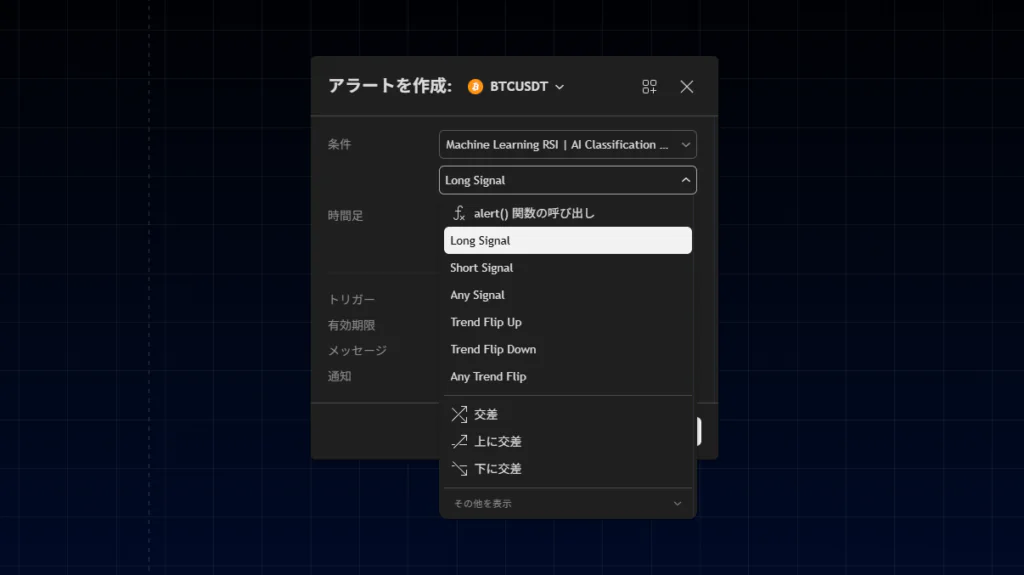
Machine Learning RSI ships with six alert conditions: long signal, short signal, any signal, trend flip up, trend flip down, and any trend flip. There’s also a message format that includes the ticker, the timeframe, and the Rank and Confidence at the moment it fired — so you can judge setup quality straight from the notification. A Rank 90 alert and a Rank 61 alert deserve very different treatment, even when both say long.
Every gate a signal has to clear
Getting a single triangle on the chart takes a surprising number of boxes ticked. In order:
- The analog vote clears the neutral zone and commits to one side
- Trend Gate (Signals must align with trailing stop) — direction must agree with the Supertrend (when enabled)
- Volatility Band — ATR rank sits at or above the floor (20 by default) and at or below the 85 ceiling (when enabled)
- Chop Filter — the bar isn’t flagged as range-bound (when enabled)
- With all of the above satisfied, the call flips to the opposite side
- Rank clears its threshold, and Confidence clears its own
- At least 5 bars have passed since the previous signal
- The bar is closed
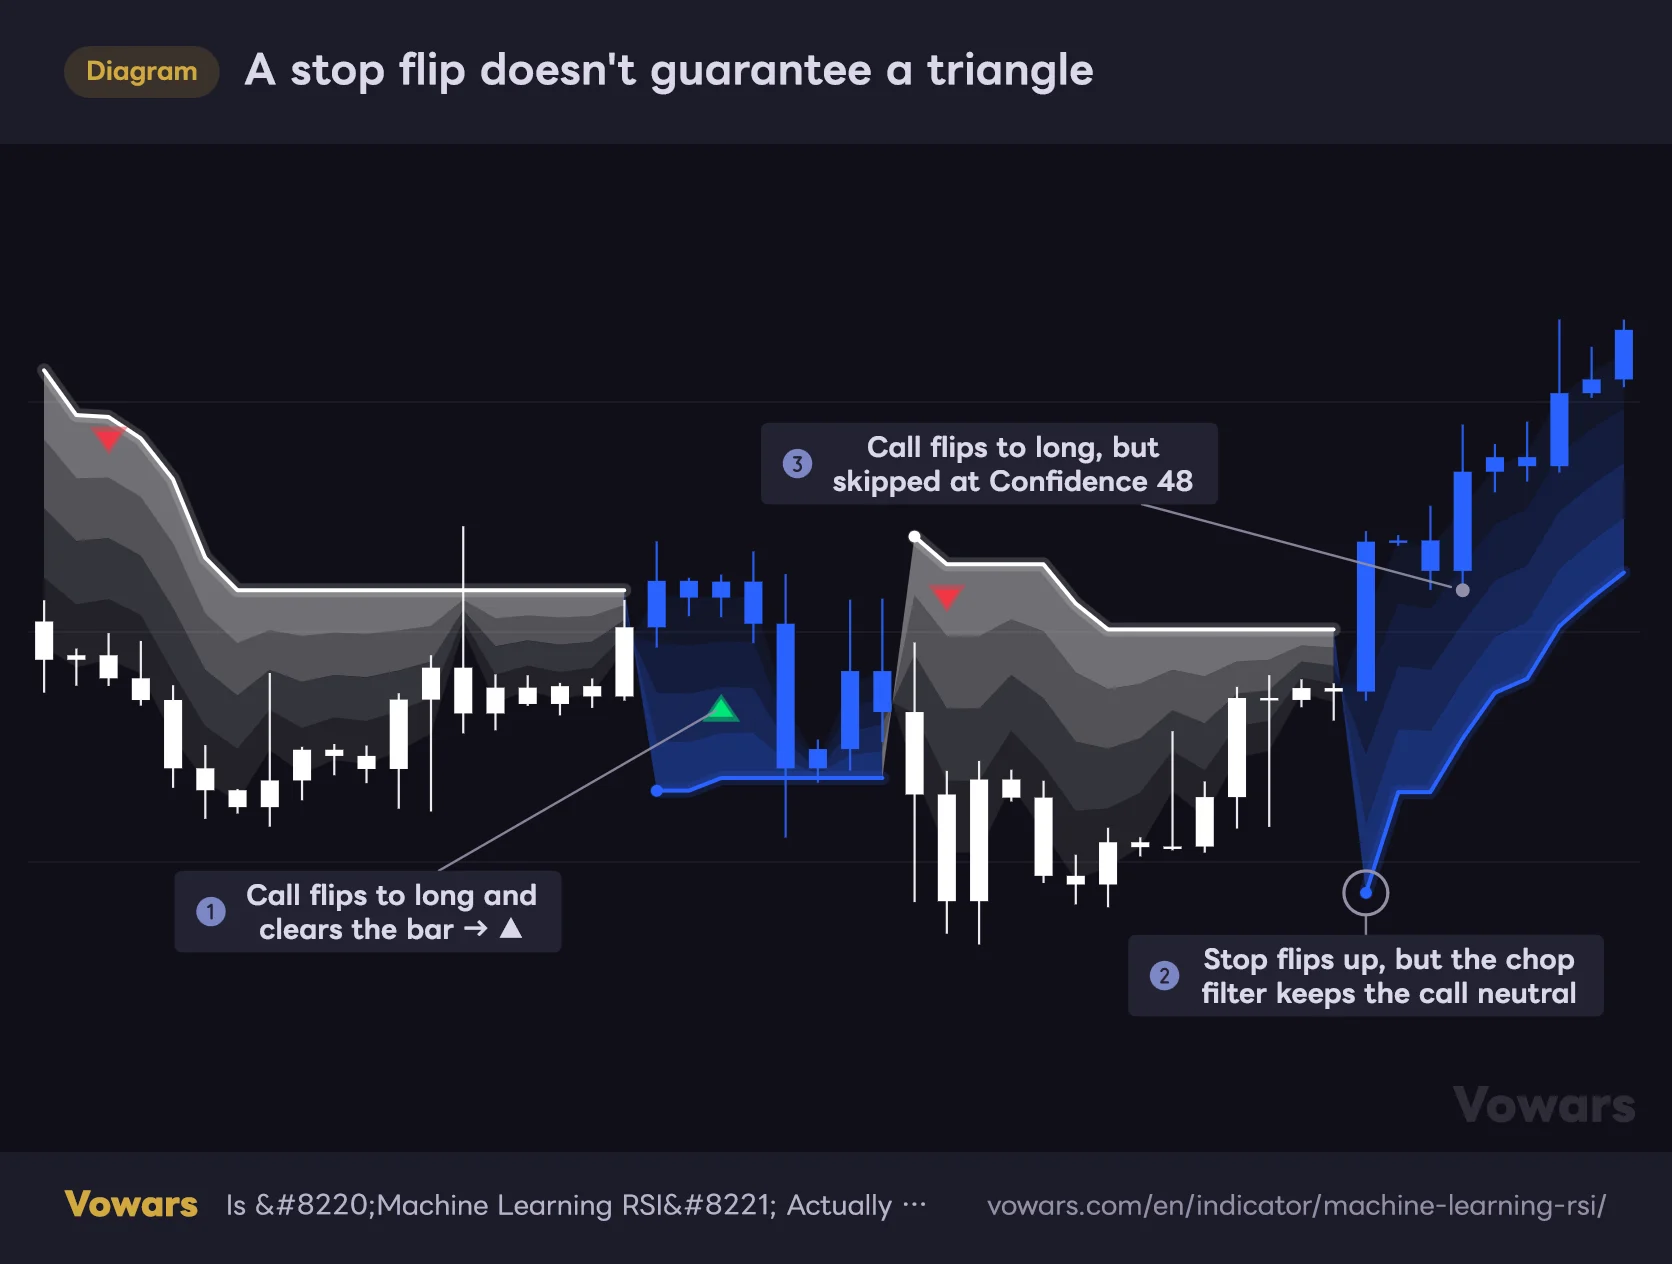
The common misconception: a Supertrend flip and a triangle marker are two different things. The stop can flip up without a ▲ if the model’s call doesn’t change, and a ▲ can show up a few bars after the flip.
A stop flip doesn't guarantee a triangle
▲▼ only print when the model's call flips and that bar also clears the Rank and Confidence thresholds.
Vowars DE ver.3.11.0
Bar ③ shows a particularly important behavior. If a long signal is skipped for lack of Confidence on the flip bar, the call itself stays switched to long, so no ▲ follows in that direction even once Confidence recovers. The next ▲ only comes after the call flips back to short and then to long again. As the figure shows, that can mean sitting out an entire move.
Fail any single gate above and no marker appears, even if the bias just flipped. In a Bitcoin range, the Chop Filter alone wipes out a large share of candidates. “Nothing fired all day” is normal behavior — and if you respond by grinding the thresholds down, you’re dismantling the best thing about this indicator yourself.
Settings in detail, and what to run
The learning engine
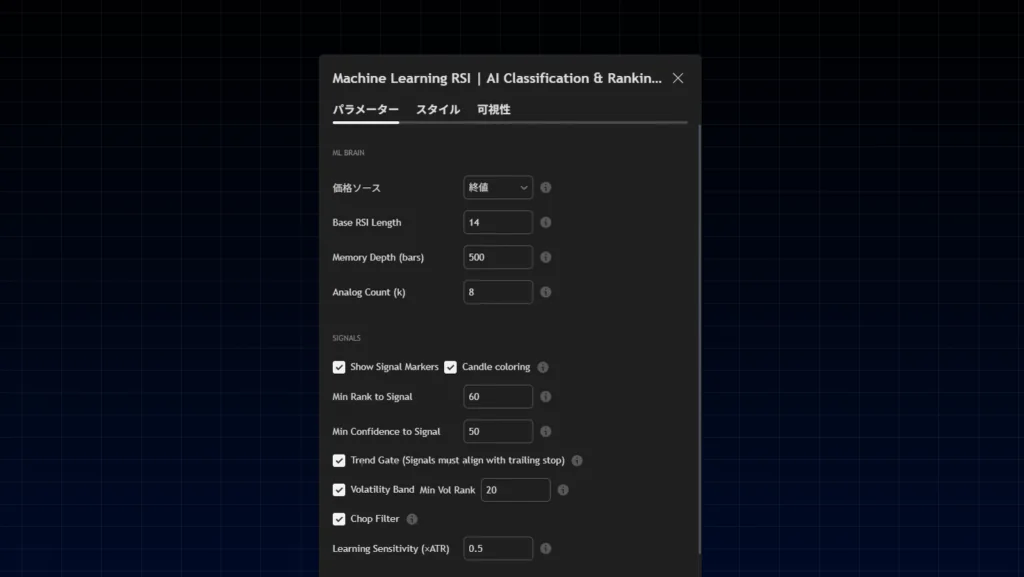
| Setting | Default | Suggested | Effect |
|---|---|---|---|
| Price Source | close | close (hl2 on wick-heavy symbols) | The series all eight features are built from. Changing it shifts the whole tool’s character, so close is the safe start. On low-cap alts with messy wicks, hl2 steadies things noticeably |
| Base RSI Length | 14 | 14 (9–10 for scalping, around 20 for swing) | The core RSI period. A fast RSI at half this length and a slow one at double are derived from it. Shorten it for quicker reactions and more signals; lengthen it for a smoother, more deliberate read |
| Memory Depth (bars) | 500 | 400–600 (800–1000 on daily and above) | How many past bars are banked. Only about a quarter are eligible as matches, so dropping below 300 thins the pool and the read gets jumpy. Deeper captures more regimes but adapts more slowly to a recent change in character |
| Analog Count (k) | 8 | 8–12 (around 10 on Bitcoin intraday) | How many matches vote. Fewer is sharper but one odd match can flip the read; more is steadier but blurs distinct setups. Rule of thumb: raise it if signals feel erratic, lower it if they feel sluggish |
| Learning Sensitivity (×ATR) | 0.5 | 0.5 (0.8–1.0 for fewer, better setups) | The bar a past move must clear to count as meaningful. Lower it and small moves enter the training set — more signals, more noise. Raise it and the engine learns from fewer, decisive moves only |
Signals and filters
| Setting | Default | Suggested | Effect |
|---|---|---|---|
| Min Rank to Signal | 60 | 55–65 (around 70 for high-conviction only) | The quality gate. With a realistic ceiling near 95, 70 is already demanding and 80-plus shuts signals off almost entirely. Watch frequency on defaults first, then move it in steps of 5 |
| Min Confidence to Signal | 50 | 45–60 | The conviction gate. Flip bars get no persistence credit, so this is usually what blocks a signal. If you feel you’re missing too much, try around 45; to reliably filter out split votes, go to around 60 |
| Trend Gate (Signals must align with trailing stop) | On | On (off only for counter-trend traders) | Blocks any signal that fights the Supertrend. Switch it off and you start getting mean-reversion entries into dips and rallies — along with noticeably more fakeouts |
| Volatility Band | On | On | Only permits signals while ATR rank sits inside a healthy window. The ceiling is fixed at 85, so signals automatically shut off mid blow-off or crash |
| Min Vol Rank | 20 | 20 (30–40 if you want more energy) | The floor that screens out dead markets. To avoid Bitcoin weekends and thin-liquidity hours, around 30 makes a real difference |
| Chop Filter | On | On | Flags a bar as range-bound when the fast/slow EMA spread divided by ATR is small, blocking signals and widening the Supertrend bands. It kills off exactly the conditions analog-matching systems handle worst |
| Show Signal Markers / Candle coloring | Both on | Depends on your setup | Purely visual — neither affects the calculations or signal logic. If you stack other indicators, turning candle coloring off keeps things readable |
Auto-optimization and feature weights
| Setting | Default | Suggested | Effect |
|---|---|---|---|
| Auto-Optimize Weights | On | On | Learns how important each of the eight features currently is. The answer differs by symbol and timeframe, so letting it work this out beats guessing by hand |
| Adaptation Speed | 1 | 0.1–0.3 | How fast learned weights move toward newly computed ones. The default of 1 replaces the weights outright every bar, leaving them unstable. 0.1–0.3 smooths out short-term noise, and the drop in flip-flopping is obvious in use |
| Feature Weights (RSI Value and 7 others) | All 1.0 | Leave alone | Manual weights that only apply with auto-optimization off. You decide which features drive the matching, but moving them without a reason breaks the similarity read |
Supertrend and the RSI signal line
| Setting | Default | Suggested | Effect |
|---|---|---|---|
| Show ML Supertrend | On | On | Turning it off removes the line, cloud and flip dots. The trend direction logic keeps running underneath, so this is purely about what you see |
| Supertrend Source | hl2 | hl2 | The series the bands center on. hl2 uses the middle of the bar so wicks throw it around less; close makes the stop react more to closing prints |
| ATR Multiplier | 1.5 | 1.5 (2.0–2.5 to ride trends longer) | The base band width, scaled by adaptivity — even on defaults the effective width ranges from about 1.5× to 3.0×. Raising it detects flips later but keeps you from getting shaken out on pullbacks |
| ML Band Adaptivity | 1 | 0.5–1 (around 0.3 for stability) | How strongly conviction reshapes band width. At 0 you have a plain vanilla Supertrend. Lower values behave more predictably; higher values let the stop tighten aggressively when conviction is strong |
| Type (RSI Signal Line) | SMA | SMA or EMA | The moving average drawn over the ML RSI. None hides it; SMA + Bollinger Bands adds bands so you can see when ML RSI is stretched |
| Length (RSI Signal Line) | 14 | 14 (around 9 for earlier crosses) | Shorter hugs the ML RSI and crosses more often; longer gives a slower reference that gets faked out less |
| BB StdDev | 2.0 | 2.0 | Only active with SMA + Bollinger Bands. Wider bands flag only extreme excursions; tighter bands get touched far more often |
 Image
ImageFour setups for four different jobs
Riding Bitcoin trends without overthinking it
Leave Trend Gate (Signals must align with trailing stop), Volatility Band and Chop Filter all on, and only drop Adaptation Speed to around 0.2. Keep the Rank and Confidence gates at their defaults. That narrows signals to moments where you’re with the regime, there’s energy in the market, and it isn’t ranging. It pairs well with Bitcoin on the 1H to 4H.
When you only want the A-plus setups
Push Min Rank to Signal to 65–70, Min Confidence to Signal to around 60, and lift Min Vol Rank to about 30. Raise Learning Sensitivity (×ATR) to roughly 0.8 as well, and the engine only learns from moves that actually went somewhere. Run this and you’ll have weeks with zero signals — fine, as long as you can sit on your hands.
When you want to miss fewer moves
If the “skipped on the flip bar, then sat out the whole move” pattern bothers you, one option is dropping Min Confidence to Signal to around 45. The Rank gate stays where it is, so low-quality setups still don’t get through. But you’ll also let in more split votes, so don’t take every ▲ at face value — use the Rank and Confidence in the alert to prioritize.
Fading the edges of a range
Switch Trend Gate (Signals must align with trailing stop) off and Chop Filter off, and you’ll start getting counter-trend signals inside ranges. Understand what that means: you’re deliberately unlocking the exact conditions this tool handles worst. Only run it alongside something that identifies the edges of the range — horizontal levels, volume profile, whatever you use. On its own, it will chop you up.
What I liked, and what to watch out for
What you can count on
- Signals are selective out of the box — no wall of arrows cluttering the chart
- Rank and Confidence give you numbers, so you can weight each signal instead of treating them all the same
- Not tied to fixed 70/30, so it avoids premature counter-trend calls during Bitcoin legs where RSI stays pinned high
- The Supertrend band expands and contracts on its own, naturally backing off when there’s no direction
- Trend direction, momentum position and entry cues all come from a single indicator
- Alerts carry Rank and Confidence, so you can triage a setup from the notification alone
What to watch out for
- A long settings list, and it takes time to work out what’s driving what
- It needs a run-up before the learning engages, so thin-history charts won’t show true behavior
- The learning horizon is locked at 4 bars, which makes it a poor fit for position-trading decisions
- Being an analog-matching system, it struggles with price action that has no precedent
- Once a signal is skipped, the same direction stays quiet — you can sit out an entire move
- The default blue-and-white palette isn’t intuitive until you’ve retrained your eye
Caveats, and how not to use it
On repainting
The entry triangles are built to fire only on closed bars, so you won’t see a signal appear and then vanish mid-candle. That part you can trust.
That said, the ML RSI line and the Supertrend line do update with price while the current bar is forming. That’s the same as a standard RSI or Supertrend, and the usual rule applies: don’t treat an unconfirmed value as a decision.
Both the memory bank and the auto-tuned weights accumulate from the left edge of the chart forward. Change how much history is loaded and the same bar can carry a different amount of run-up behind it, so the display won’t line up exactly. When reviewing past price action, load plenty of history first and exclude the first few hundred bars from anything you conclude. If you step through bars with Bar Replay, make sure there’s enough history before your replay start point too.
No lookahead, but performance is context-dependent
The training labels are built from “the 4 bars that followed an already-closed past bar.” So it isn’t peeking at future price to generate signals — that much is clear from the design.
At the same time, as the author openly acknowledges, this isn’t a trained neural network — it searches for similar precedents within the chart and classifies from them. So results shift substantially with symbol, timeframe, memory depth and filter settings. Nothing about the AI label makes it right more often.
Don’t trade Machine Learning RSI in isolation
Rank and Confidence quantify how well the historical precedents line up. They aren’t win rates and they aren’t expectancy. A Rank 85 signal failing is completely ordinary. Stop placement and position sizing are yours to define, separately from this tool. Using the Supertrend line as a stop reference is perfectly sound, but size accordingly: low conviction means a wider stop, and a wider stop means more risk per unit.
The best pairing: a simple horizontal line
What Machine Learning RSI doesn’t know is where price actually sits. The analog vote looks only at the shape of momentum, not at how much room there is to the nearest high or low. That’s exactly why tools that mark key price levels complement it so well — and the simplest, most effective one is a horizontal line at the recent high or low.
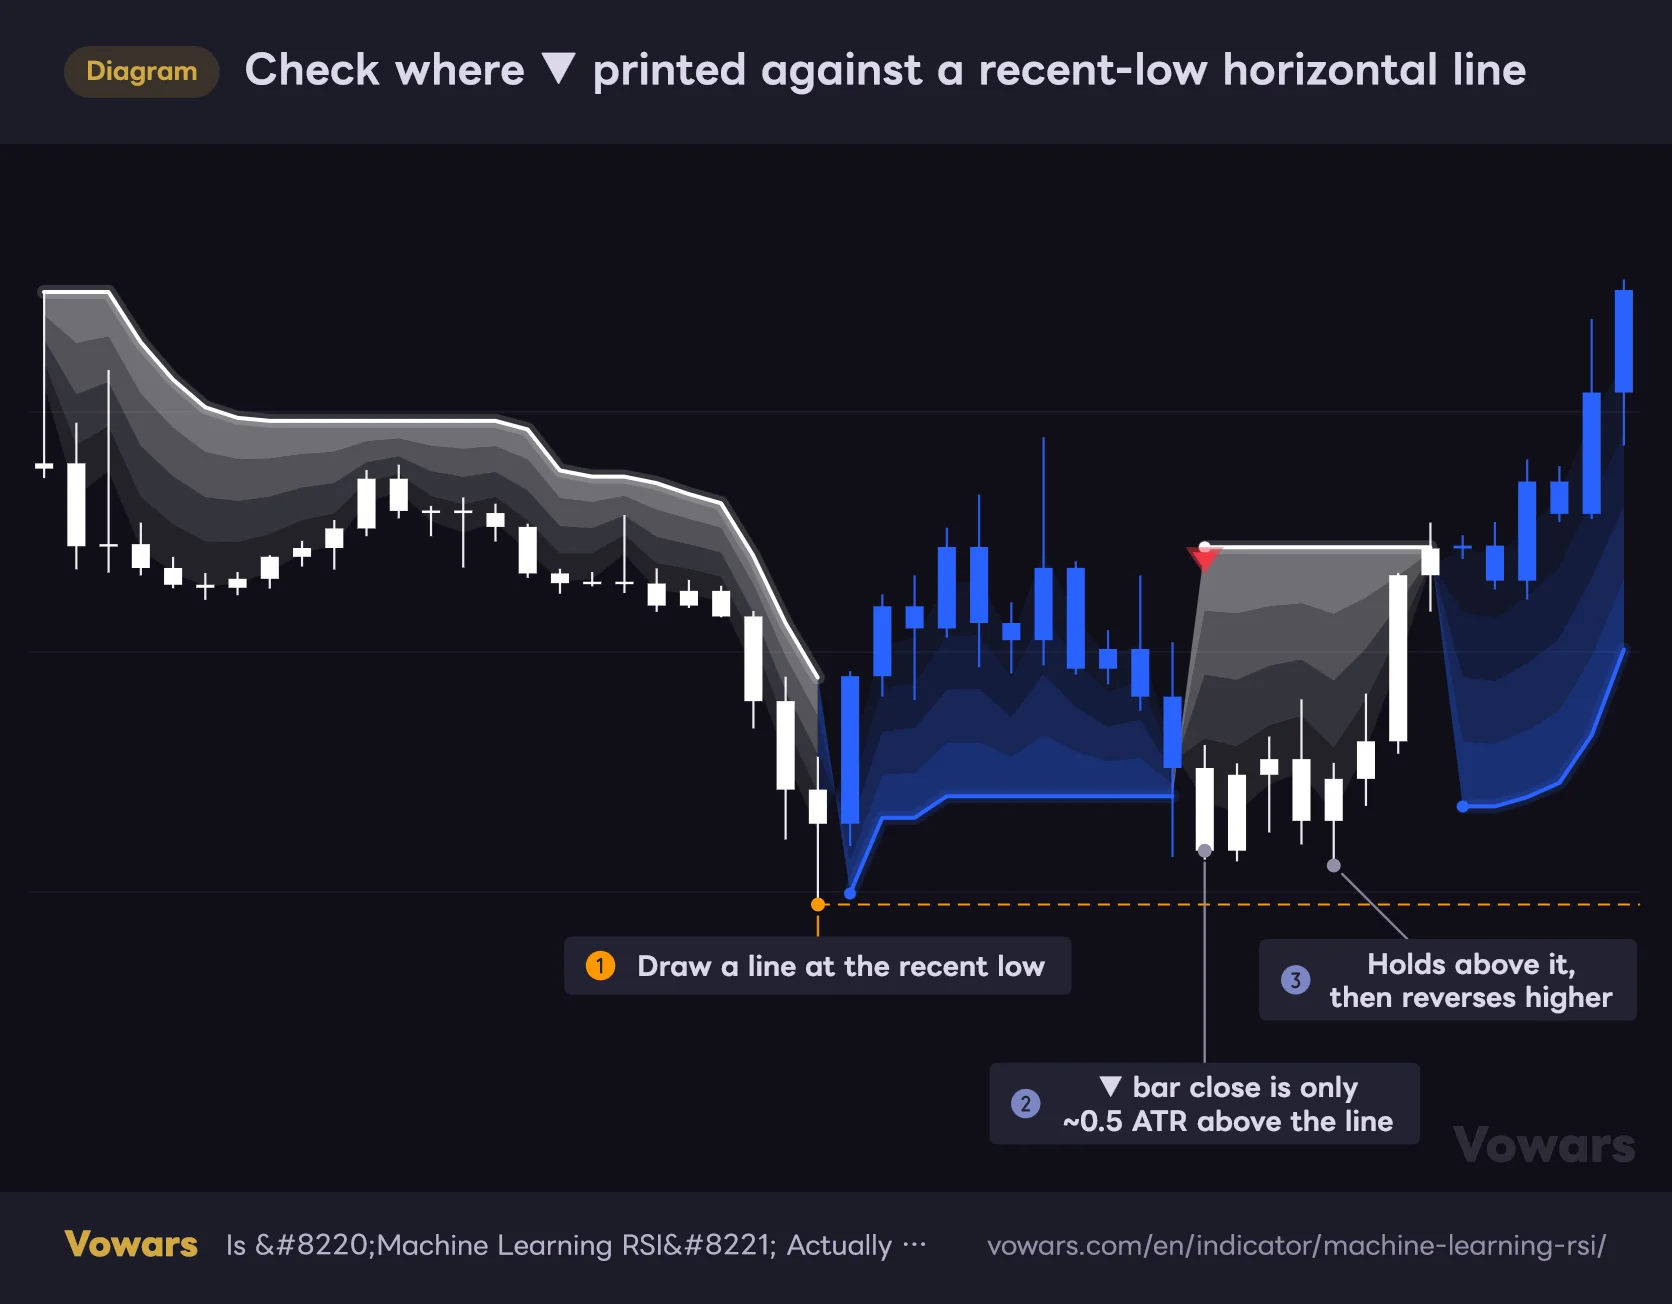
Check where ▼ printed against a recent-low horizontal line
Triangles don't know where price sits. If support is right below, there isn't much room left to the downside.
Vowars DE ver.3.11.0
The workflow is simple: when a triangle prints, check the distance to the nearest level in the direction of the signal. As in the figure, if the ▼ bar closes only about 0.5 ATR above support, there’s little room left to the downside — so you skip it, or wait for a clean break of the level. Other pairings worth considering:
- Volume profile — finer-grained than a horizontal line, marking high-volume price areas as levels
- Higher-timeframe trend — with a 4-bar learning horizon, the read skews short-term by nature. Simply checking the daily or 4H direction and skipping signals that fight it changes how the tool feels
- Volume tools — the volatility filter is ATR-based, so volume itself is never looked at. Adding something that gauges whether a breakout has real participation fills that gap
Machine Learning RSI already has three filters built in: trend, volatility and range detection. Layer on something that does a similar job and you end up double-filtering, at which point signals essentially stop appearing. If you add anything, pick a different kind of information — where price sits, or how much volume is behind it.
Who this is actually for
| Type of trader | Fit | Why |
|---|---|---|
| Values signal quality over signal count | Excellent | The double gate plus the filters make it selective by design |
| Primarily trend-following | Excellent | The trend-direction gate and the Supertrend already lean that way out of the box |
| Enjoys dialing in settings | Excellent | Plenty of inputs, and they genuinely change how it behaves |
| Wants to trade the arrows mechanically | Mixed | Without understanding the scores, it’s easy to lower the gates and gut the edge — and skipped signals mean missed moves |
| Trades mean reversion inside ranges | Mixed | That runs against the design, and means switching filters off |
| Keeps charts minimal | Poor | Line, cloud, candle coloring and markers — it’s a lot of visual weight |
An AI RSI that makes silence work for you
Plenty of indicators claim “AI” and “machine learning,” and plenty turn out to be a couple of moving averages in a trench coat. Machine Learning RSI isn’t one of them: it genuinely banks past states, searches for similar ones, has them vote, and adjusts which features matter. The name and the contents line up, and that deserves credit.
Running it on Bitcoin, what I appreciated most was how much of the time it says nothing at all. The Chop Filter mutes it through ranges, and the volatility band shuts it down when things go quiet. If you’re tired of indicators that spray arrows across the screen, that silence is the feature.
On the complaints side: the sheer number of settings, the default colors, and the way a skipped signal leaves that direction quiet for a while. Adaptation Speed in particular swaps out the learned weights every single bar at its default value, so I’d drop it the moment you install.
Taken as a whole — a heavily filtered, high-spec RSI bundled with an adaptive Supertrend — this is a well-built piece of work. Internalize two things — Rank and Confidence don’t really run to 100, and Confidence struggles on flip bars — and tuning the thresholds stops being guesswork. It’s not a self-contained holy grail, but it adds one genuinely useful question to your discretionary read: what did momentum like this lead to last time?
1. Drop Adaptation Speed to 0.1–0.3 / 2. Recolor the uptrend and downtrend to something you can read at a glance / 3. Before touching any threshold, watch signal frequency on defaults for a few weeks. Get those out of the way and you’ll skip a lot of wasted effort.