

“Strong Burst Fader” Turns Over-Extension Into Heat You Can Read at a Glance
After price rips in one direction, there’s always that moment where you think “okay, that’s got to be too far.” Eyeballing it is the hard part. Slap Bollinger Bands on and you can see that price touched the band, but how far past it price actually went is something you can’t read at a glance.
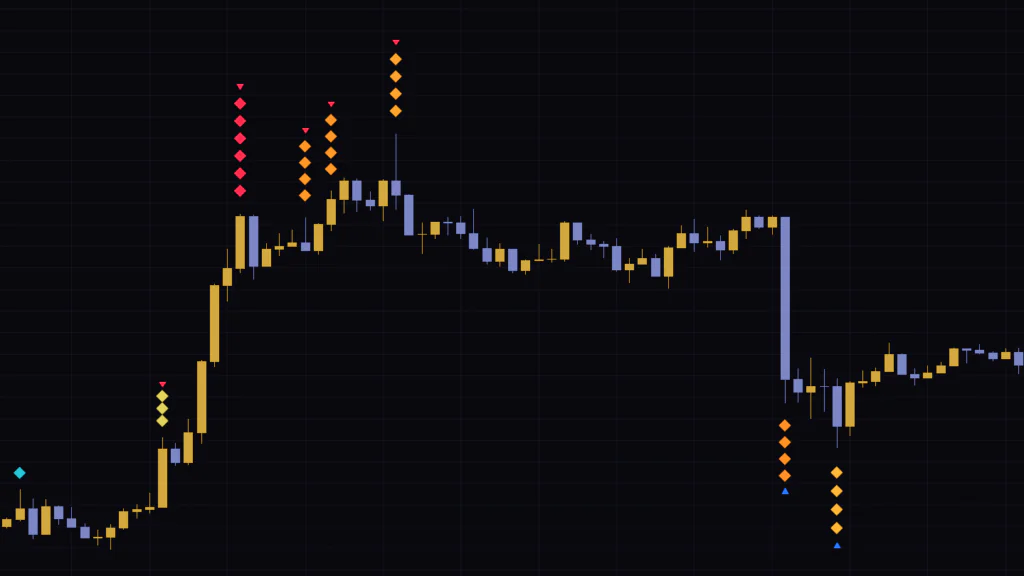
“Strong Burst Fader” does one job: it measures exactly that. Under the hood it keeps an envelope built from a moving average plus and minus ATR (the average range of a single bar), then counts how far the wick punched outside that envelope. Diamonds stack above (or below) the offending bar, and the deeper the punch, the taller the stack and the hotter the color runs, from cyan up to red.
The developer frames “Strong Burst Fader” as a mean-reversion tool. The “Fader” in the name is trader-speak for taking the other side of a move, and the core idea is to find bars that have run too far and lean against them.
All “Strong Burst Fader” draws on your chart is diamond stacks and small arrows. The moving average it references and the envelope it measures against are never plotted. Your chart stays clean, but the flip side is that you’re left picturing where the band sits.
What Actually Shows Up on the Chart
The Diamond Stack Is a Ruler for How Far Price Stretched
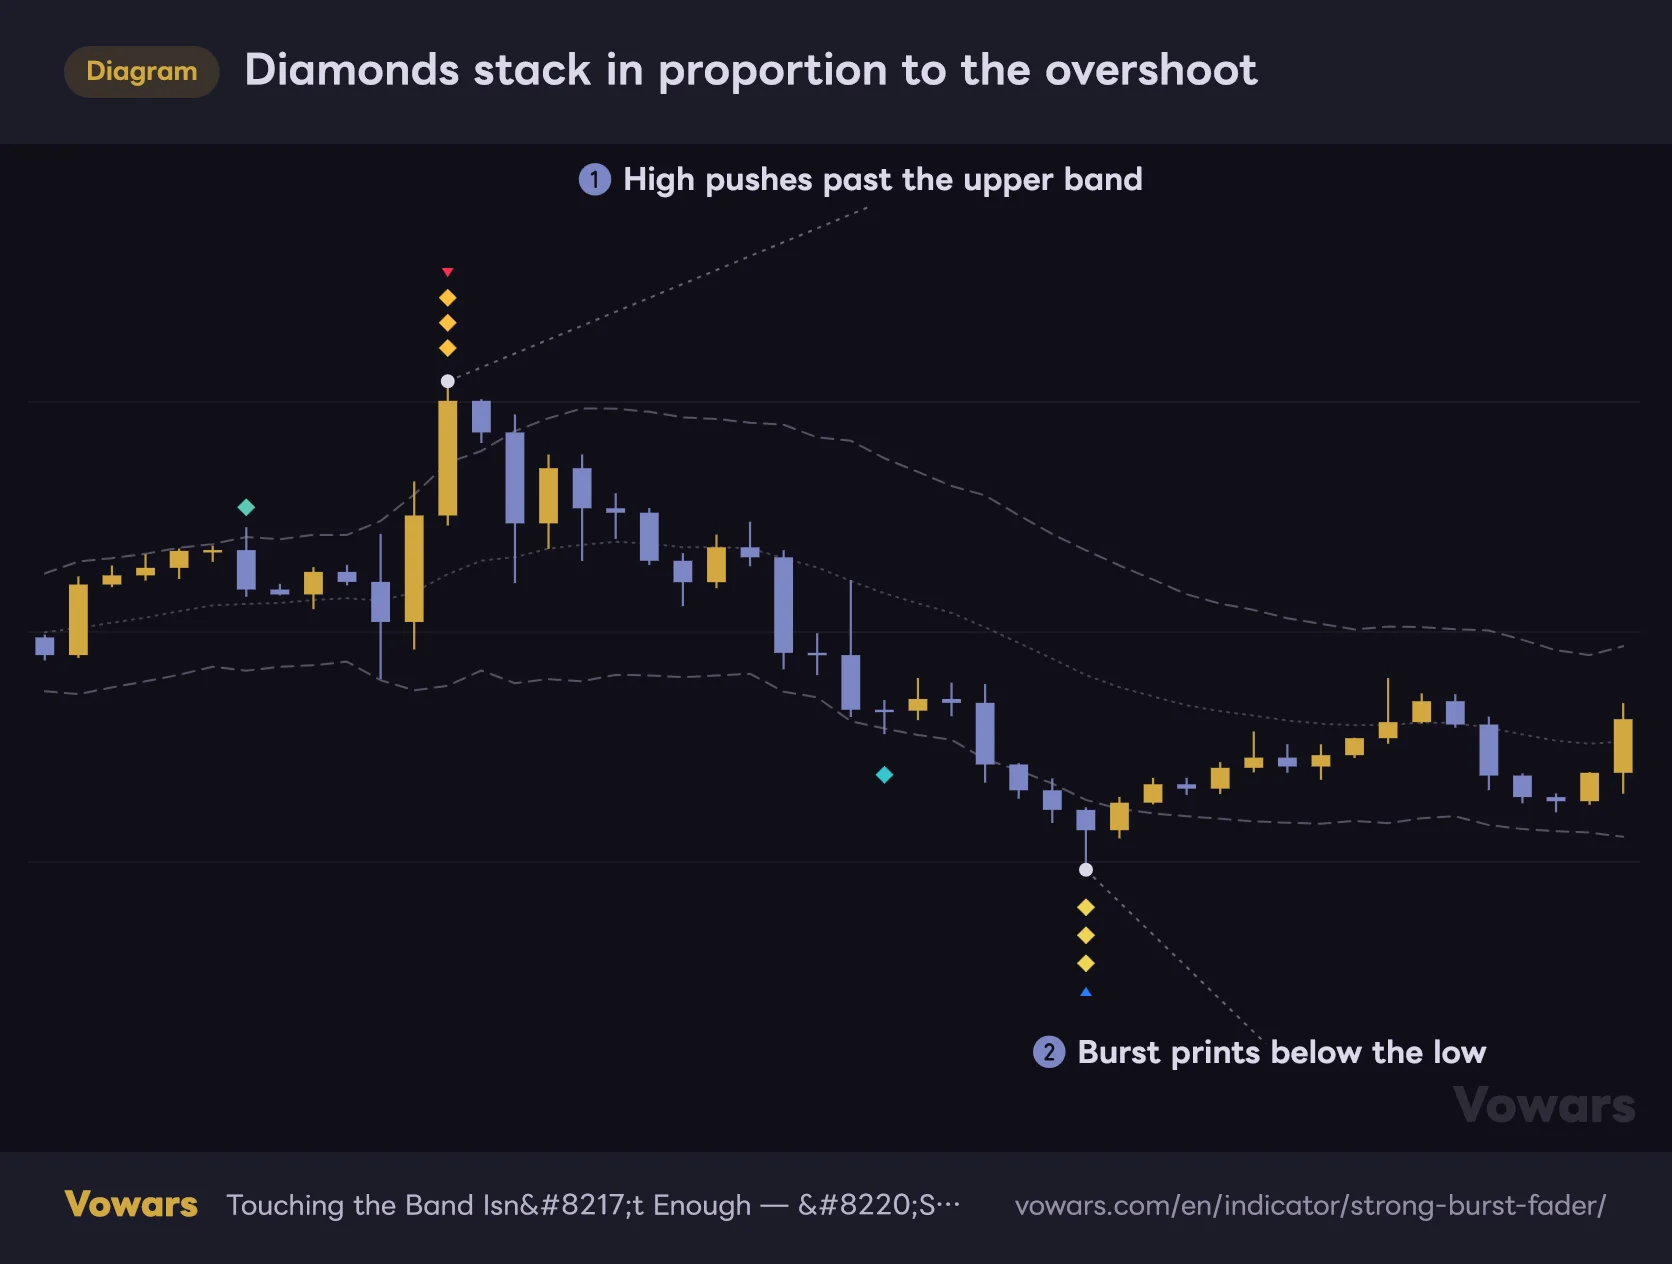
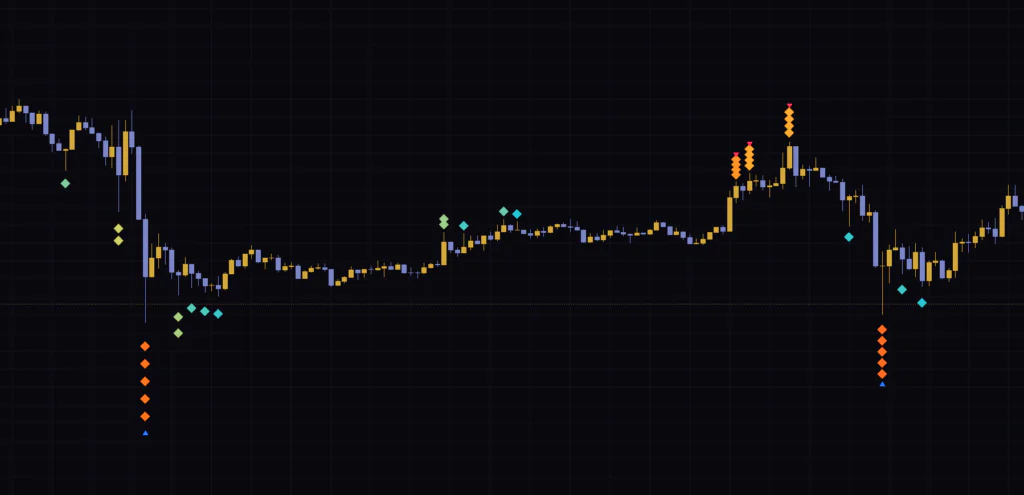
Every extra diamond means another 0.5 ATR of stretch beyond the band. On defaults, anything under 0.5 ATR gets a single diamond, and once you clear 2.5 ATR you’re at the six-diamond cap. The easiest way to think about it is that stack height is a ruler for how abnormal the move is.
Diamonds stack in proportion to the overshoot
The dashed band and dotted basis are drawn here to explain the mechanics. Neither appears on your actual chart, only the diamonds and arrows.
Vowars DE ver.3.5.0
One thing to be clear on: the diamonds themselves carry no price information. The first one sits 0.6 ATR off the wick, and each one after that is spaced 0.45 ATR further out. That’s purely for legibility, so there’s no reading like “price should retrace to the sixth diamond.” What you read is height and color, nothing else.
Four Colors, Cyan Through Red
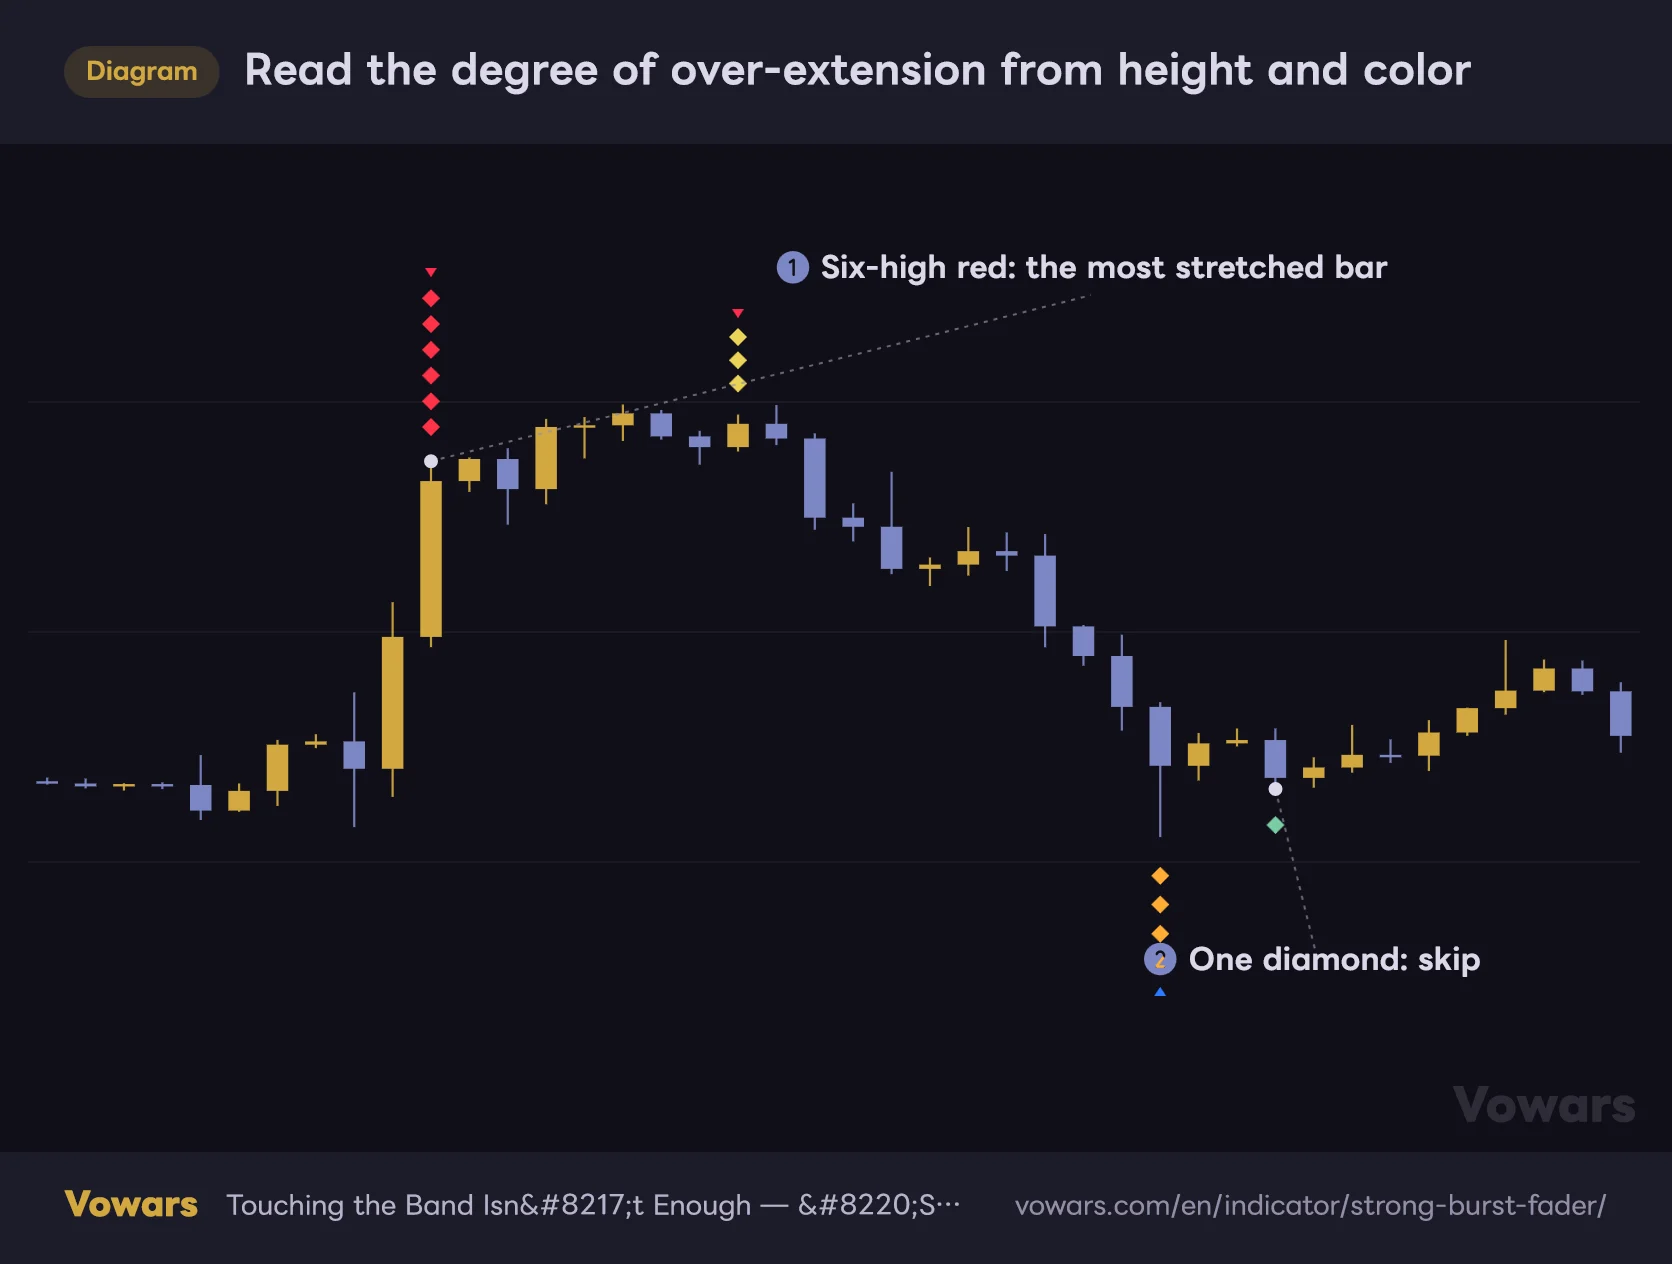
Color is worked out separately from height, hitting the hottest red once the stretch reaches 3.0 ATR. Out of the box, Mild is cyan (#26c6da), Warm is yellow (#ffd54a), Hot is orange (#ff7a1a) and Extreme is red (#ff2b4e). The four stops blend smoothly, so in practice you’ll see plenty of yellow-green sitting between cyan and yellow.
Read the degree of over-extension from height and color
The taller and redder the stack, the more overextended that bar is. A single cyan diamond just means price barely peeked out.
Vowars DE ver.3.5.0
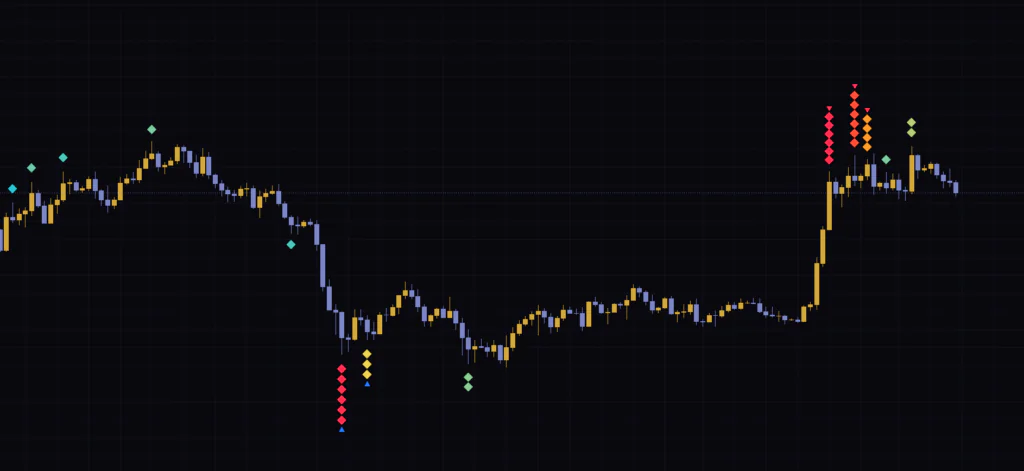
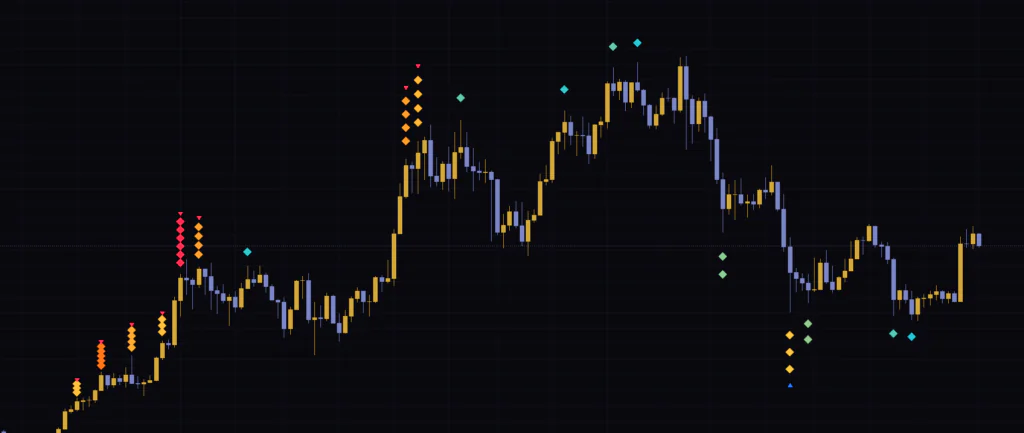
I dropped it on the BTC daily and scrolled back about four and a half months: 11 stacks total, and only three of those reached the six-high red. Tall stacks are genuinely rare, and you feel that within minutes of using it. The flip side is that the small cyan and yellow-green stacks show up constantly, and reacting to those will wear you out.
Above or Below Is What Sets Direction
Color only encodes depth, so red doesn’t mean short and cyan doesn’t mean long. Direction comes from where the stack sits. A stack above the high says price stretched too far up; a stack below the low says it stretched too far down.
Once a stack clears a certain height, a small arrow prints at the tip. A red ▽ above an up-stack means the move is overextended to the upside, so you’re looking for a short. A blue △ below a down-stack means the opposite. Arrow color is fixed and has nothing to do with diamond color, so don’t be thrown when a red ▽ shows up on top of a cyan stack.
Why It Looks the Way It Does
The Reference Is a Moving Average Plus and Minus an ATR Multiple
On defaults it runs an EMA 20 with a band set 2.0x ATR(14) above and below. Any bar whose wick pokes outside that band counts as a burst. Because the overshoot is divided straight through by ATR, gold, Bitcoin and a sleepy FX pair all get scored on the same ruler. A 3 ATR stretch means the same thing no matter what you’ve got loaded.
Beyond EMA you can pick SMA, HMA, WMA, VWMA or RMA for the basis. The developer’s take is that on markets with clean volume, VWMA pulls the band closer to where business actually got done.
Only the Bar Where the Stretch Peaks Gets a Stack
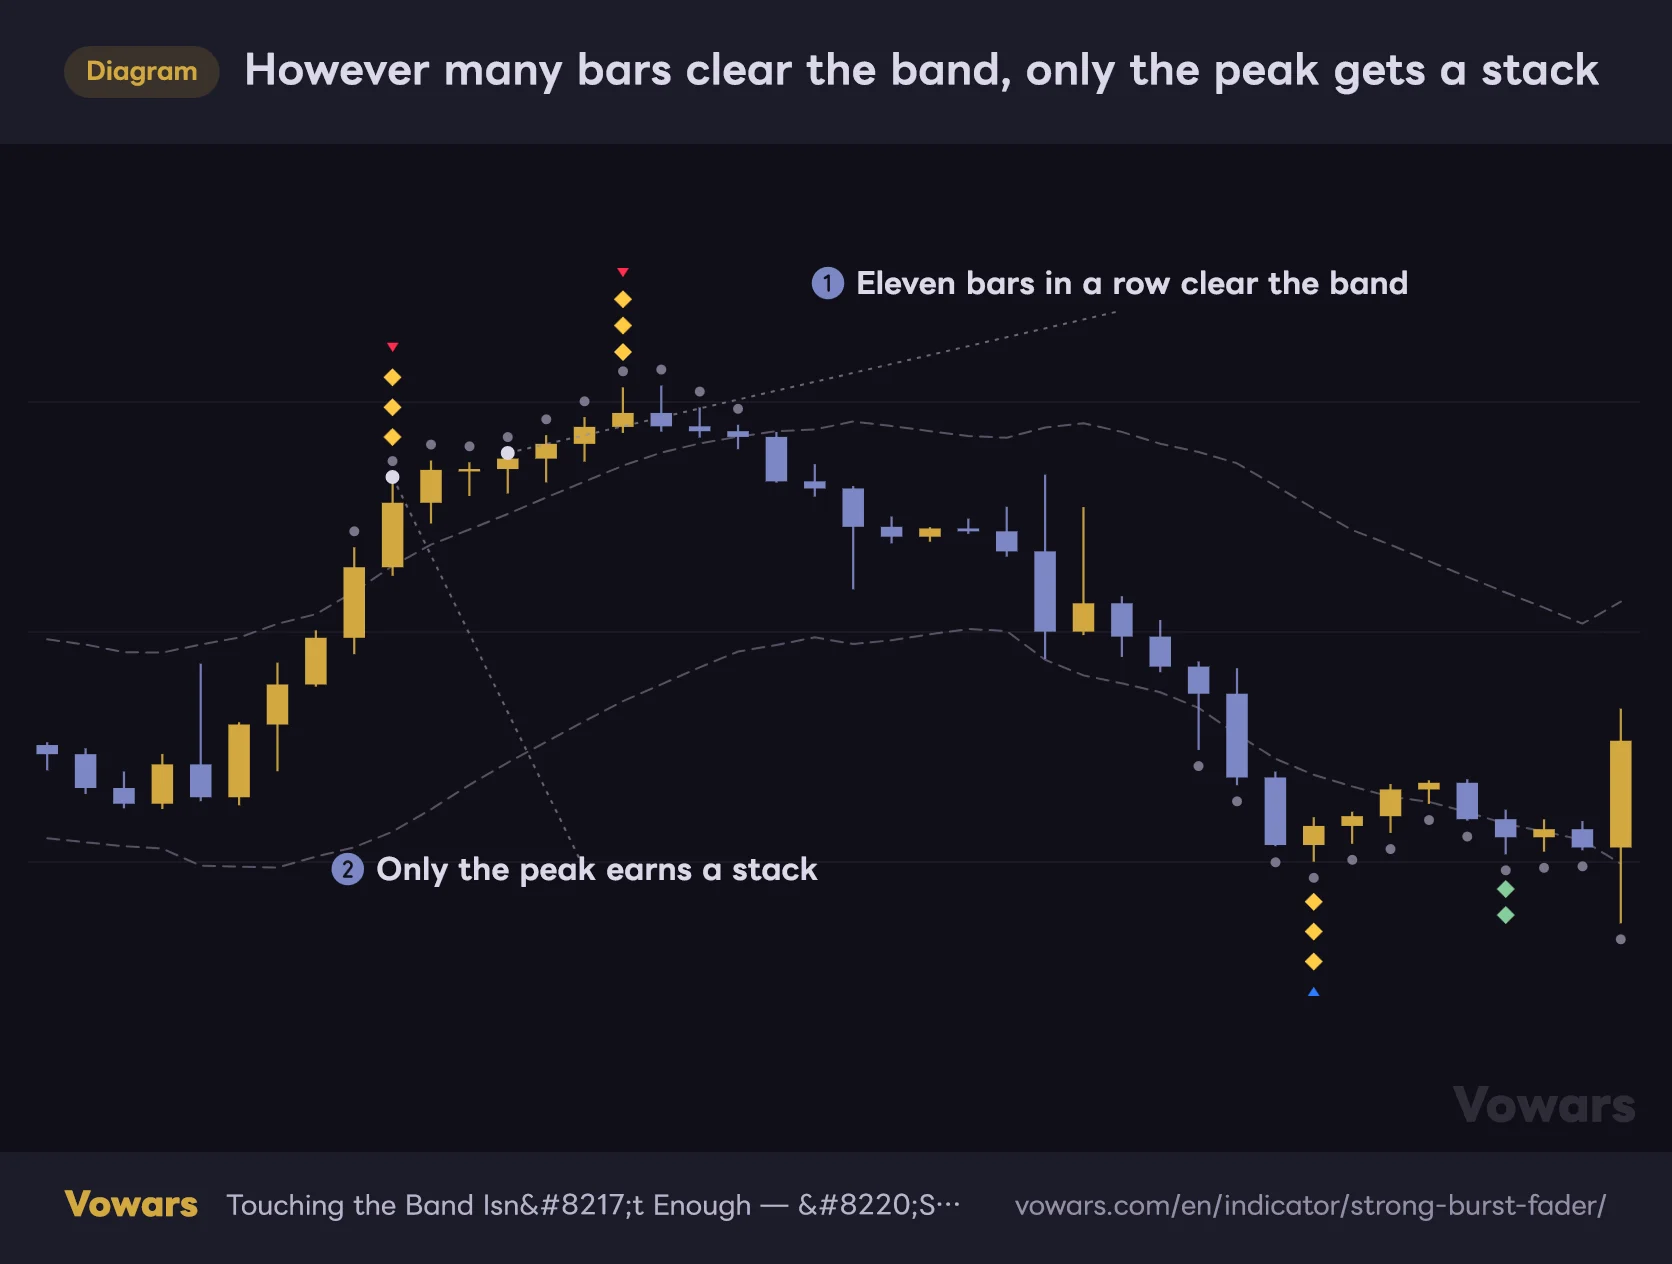
In a vertical rip or flush, bar after bar closes outside the band. Stacking diamonds on every one of them would turn the screen into a wall of red, so “Strong Burst Fader” only builds a stack on the bar whose stretch beat the bars either side of it. One thrust, one column.
However many bars clear the band, only the peak gets a stack
The small grey dots mark bars whose wicks cleared the band. Eleven in a row do so on the upside, yet only two of them get a diamond stack.
Vowars DE ver.3.5.0
That said, it isn’t a strict one-per-move rule. If the stretch eases off and then builds again, you’ll get two stacks inside what is really a single leg. On the 1H I ran into stacks landing on adjacent bars and overlapping into a diagonal smear. The faster the tape, the more often it happens, so it’s worth knowing about.
Whether an Arrow Prints Comes Down to Stack Height
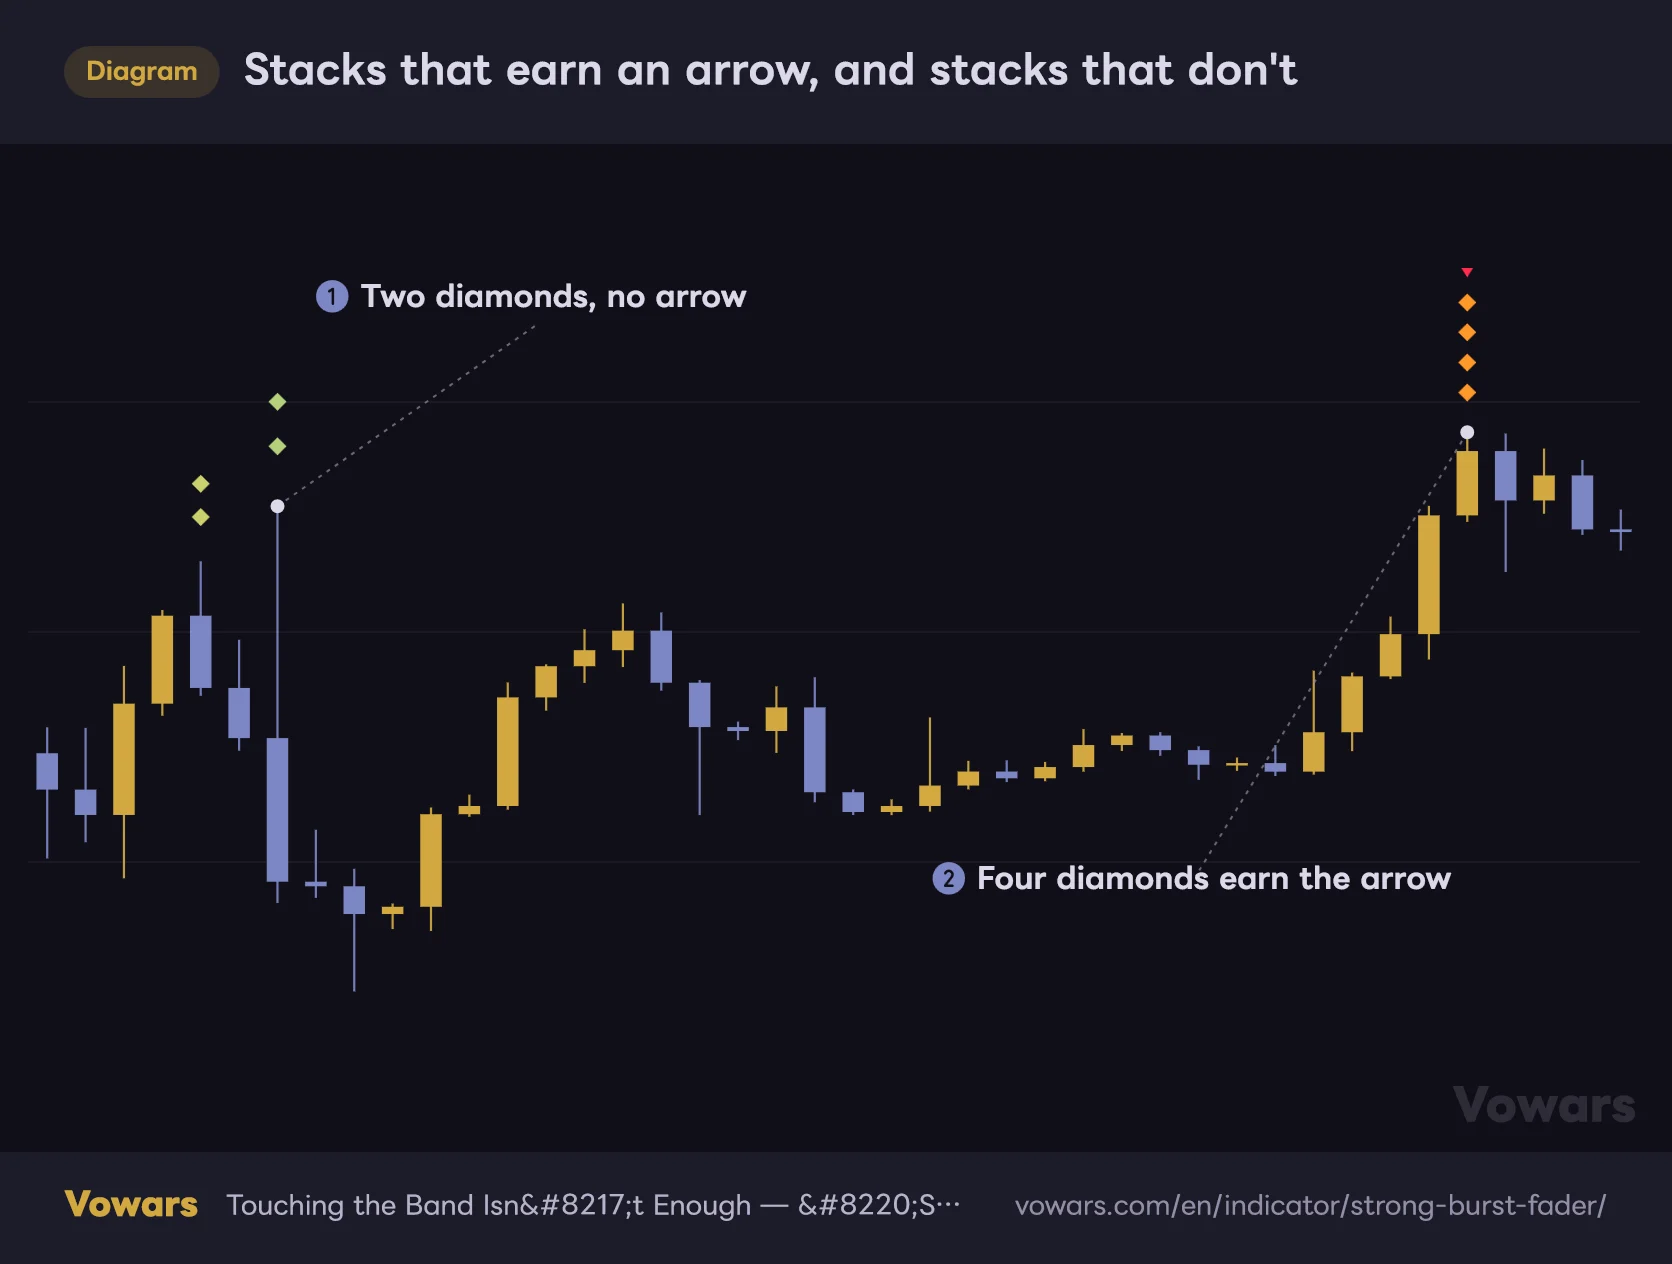
Arrows only print on stacks that reach the height set in Min stack height to flag a fade. The default is 3, so anything with two diamonds or fewer stays unmarked.
Stacks that earn an arrow, and stacks that don't
The small arrow at the tip of a stack is the fade cue. On defaults it needs at least three diamonds to appear.
Vowars DE ver.3.5.0
In practice that arrow does a lot of work as a filter for which stacks deserve attention. On the BTC daily, only five of those 11 stacks earned one. That’s roughly once a month, so on the daily this is purely an alert-and-wait tool.
How to Actually Trade It
The developer lays out exactly two plays: fade an overextended stack, or sit on your hands. It’s simple, but being able to tell those two apart is basically the whole game. Broken down into steps, it goes like this.
1Hunt for tall, hot stacks
 Image
ImageStart with stacks of five or more, orange through red. One- and two-diamond cyan or yellow-green stacks are just minor pokes and you can ignore them here. Using the arrow as your first filter is the quickest way to sort them.
2Check that the stack marks the climax
The bar carrying the stack is the most stretched bar of that thrust. But if a taller stack prints after it, you haven’t seen the climax yet. Check that the stack stands alone rather than continuing.
3Wait for price to reclaim the band
The cleanest setup the developer describes is a six-high red stack with a ▽ on it, where that bar then closes back inside the band. Since the band isn’t drawn, dropping a single EMA 20 on the chart makes the reclaim far easier to judge. Stack above means short, stack below means long.
4Park the stop beyond the wick that built the stack
If price accepts beyond that wick, what you were calling over-extension was real expansion and you were on the wrong side of it. The developer’s first target is the basis (EMA 20 on defaults), and if price cuts through that, the opposite band.
Where It Shines and Where It Falls Apart
The clearest thing I took away from using it is that this tool only earns its keep in the pause after a one-way run. In a trend that just keeps going, the stacks come one after another and fading every one of them bleeds you out.
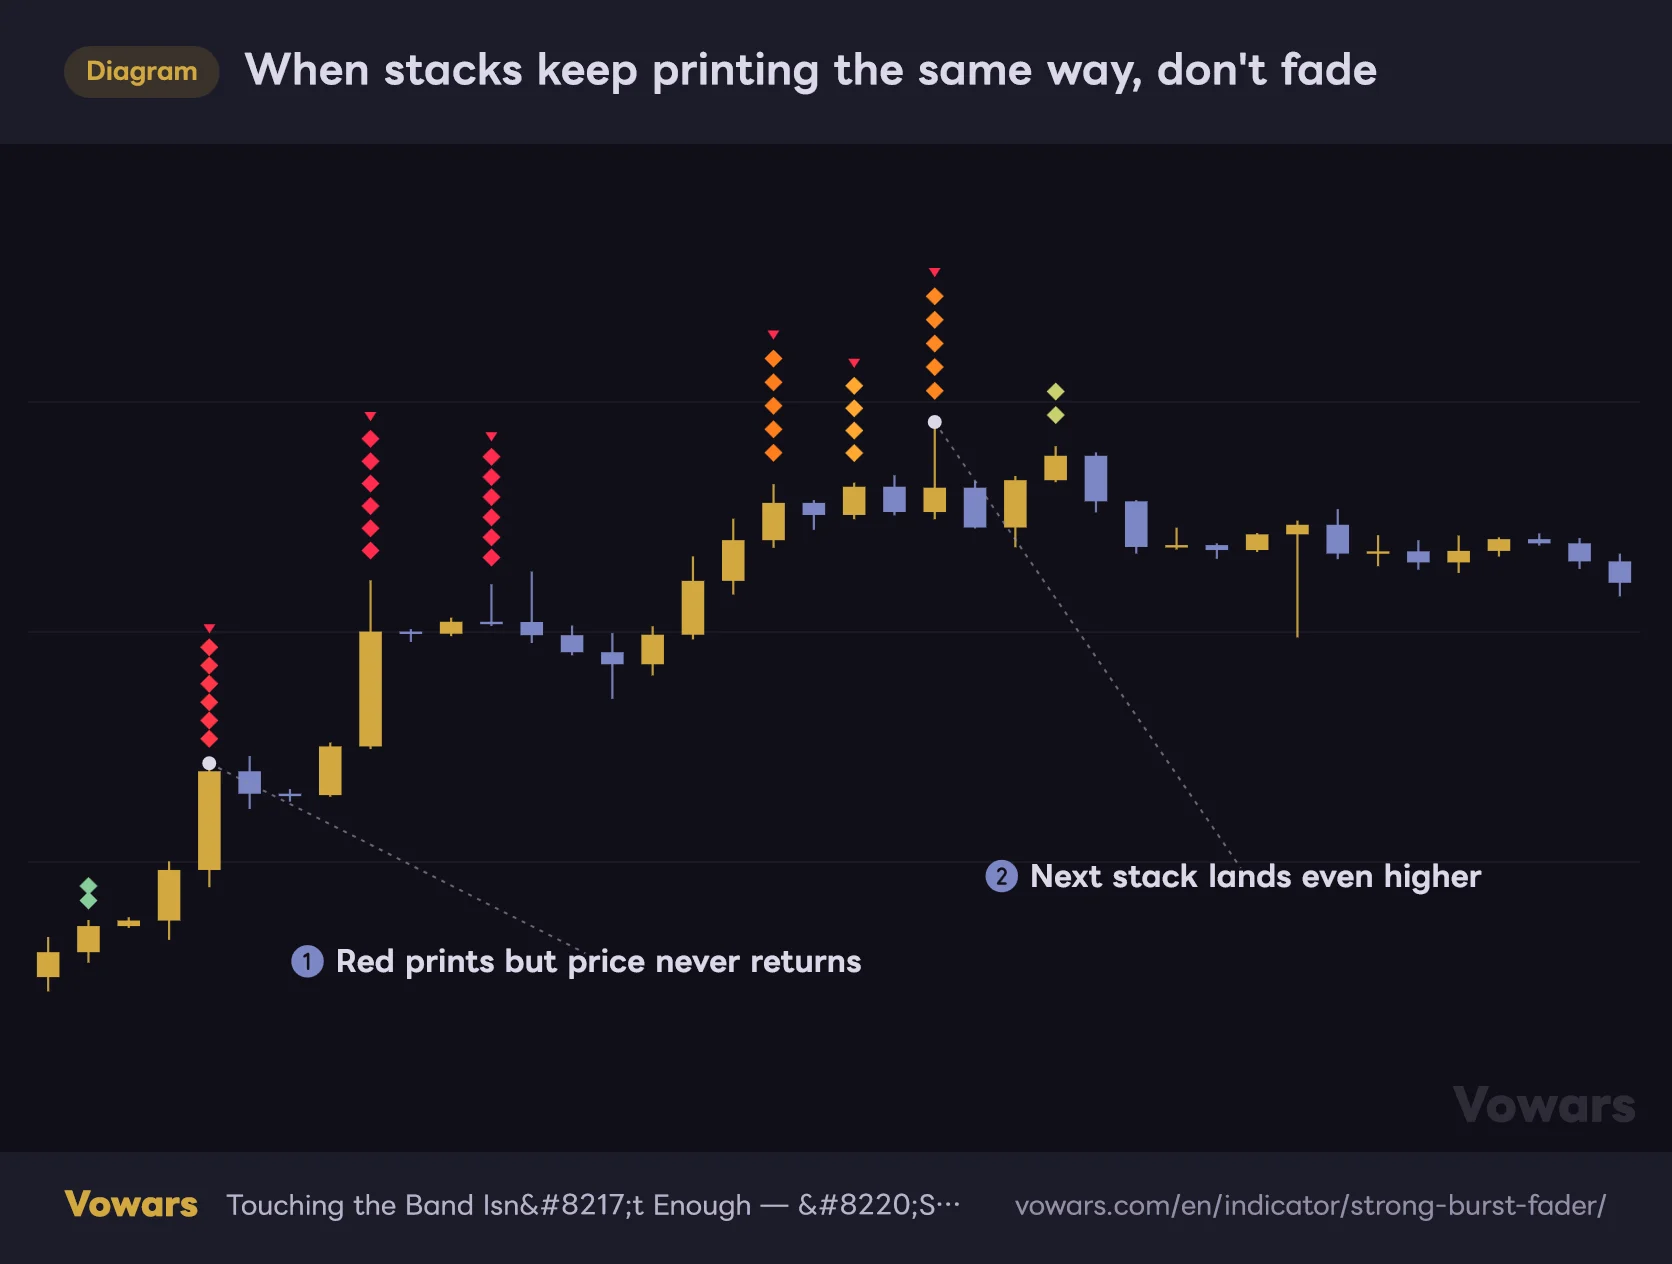
When stacks keep printing the same way, don't fade
A red stack prints, price doesn't come back, and the next one lands higher still. That sequence is acceptance rather than over-extension.
Vowars DE ver.3.5.0
The pattern in the diagram is the market accepting higher prices. Short the first red stack and the second and third will squeeze you. The developer calls this acceptance and says outright to stand aside when you see it.
The BTC daily served up the same thing. Late August printed two six-high red stacks and one four-high orange in quick succession, and price didn’t roll over straight away. It chopped sideways for a while before slowly grinding lower. Whoever jumped on the first stack had the worst seat in the house.
Where it works
- Right as a vertical rip or flush starts to stall
- Bars that spear the edges of an established range
- One-off spikes off news or data releases
- Comparing several symbols on one common scale
- Traders who refuse to clutter their chart with lines
Where it struggles
- Strong trends printing stack after stack the same way
- Dead, low-volatility tape where nothing prints at all
- Anyone wanting a single self-contained entry trigger
- Fast trading that needs a read on every single bar
Which Trading Style It Suits
Judging by how often stacks print, the daily suits swing to position trading: 11 stacks in four and a half months on BTC, five of them with arrows. Drop to the 1H or 4H and the pace turns into day-trading territory, with roughly six arrows across ten days. The 5m and 15m still print stacks, but they fire the instant news or data spikes the tape, so if you’re scalping, switching Require closing burst (close beyond band) on to strip out pure wick pokes makes it far more manageable.
Because the overshoot is scored in ATR, the “how many ATR past the band” scale holds up no matter what timeframe you’re on. A 3 ATR stretch on the 5m and a 3 ATR stretch on the daily are equally abnormal within their own context. The same logic is what makes cross-symbol comparison work.
Settings and What I’d Run
There are a fair few inputs, but only the top group actually changes what prints. They sit mixed in with purely cosmetic settings, so here’s the whole lot sorted out.
| Setting | Default | What I’d run | What it does |
|---|---|---|---|
| Basis source | close | close | Price input the basis is built from. Close is fine as-is |
| Basis type | EMA | EMA / VWMA | Type of basis. On markets with trustworthy volume, VWMA hugs real business |
| Basis length | 20 | 20 to 34 | Basis lookback. Longer means a steadier band, leaving only deep stretches |
| ATR length | 14 | 14 | ATR lookback driving both band width and diamond spacing |
| Band width (ATR beyond basis = burst starts) | 2.0 | 2.0 to 2.8 | How wide the band sits. Wider means fewer bursts and shorter stacks |
| ATR per stack step | 0.5 | 0.5 to 0.7 | Stretch per diamond. Raise it and stacks grow more reluctantly |
| Max stack height (diamonds) | 6 | 6 | Stack cap. Lower it and the Extreme alerts start firing more often |
| Heat saturates at (ATR beyond band) | 3.0 | 3.0 to 3.5 | Stretch at which color maxes out. Raise it and red gets rarer |
| Require closing burst (close beyond band) | Off | On for lower timeframes | On counts only bars that also close outside the band, filtering wick-only pokes |
| Confirm on bar close (non-repaint) | On | On | Judges on closed bars only. Off lets the newest stack move around |
| First diamond offset (× ATR from wick) | 0.6 | 0.5 to 0.8 | Gap between the wick and the first diamond. Cosmetic only |
| Stack spacing (× ATR) | 0.45 | 0.35 to 0.5 | Spacing between diamonds. Tighten it for a more compact stack |
| Tint background on extreme bursts | Off | On | Tints the column behind max-height stacks so they’re easy to spot |
| Show fade arrows on oversized bursts | On | On | Prints the ▽ / △ on stacks that clear the threshold |
| Min stack height to flag a fade | 3 | 3 to 4 | Minimum height to earn an arrow. Raise it to narrow what gets flagged |
Why These Numbers
The default 2.0 on Band width (ATR beyond basis = burst starts) sits at roughly the same width as 2-sigma Bollinger Bands. If you want to stop stacks printing nonstop in trends, widening to around 2.5 shrinks the measured overshoot itself, so stacks come out shorter and cooler. Go the other way and tighten toward 1.5 to catch smaller exhaustion in ranges, and you’ll get a flood of small cyan stacks for your trouble.
Stretching Basis length out toward 34 is about stopping the basis from chasing price. With EMA 20, a sharp rip drags the basis up with it, the band catches up to price, and the stretch looks like it resolved when it didn’t. A longer setting makes that far less likely.
Push Min stack height to flag a fade to 4 and arrows only appear on stretches of roughly 1.5 ATR or more. On something like the daily, where stacks are already scarce, that’s over-filtering, so tune it against the timeframe you actually trade.
Stack height is driven by ATR per stack step and color by Heat saturates at (ATR beyond band), and the two don’t talk to each other. Move one without the other and you end up with mismatches like a six-high stack that’s still yellow. If you tighten the step size, walk the saturation point down with it to keep the display coherent.
Max stack height (diamonds) is a visual cap, but it doubles as the trigger for the Extreme alerts and the background tint. Drop it to 4 and hitting four diamonds counts as maxed out, so those alerts fire a lot more often. Set it below Min stack height to flag a fade and you’ll never see an arrow at all.
Setups for Different Jobs
- Cutting the noise — Band width (ATR beyond basis = burst starts) at 2.5 to 2.8, ATR per stack step at 0.7, Min stack height to flag a fade at 4. Only genuinely blown-out moves survive.
- Turning up the sensitivity — Band width (ATR beyond basis = burst starts) at 1.5 to 1.8, ATR per stack step at 0.35, Heat saturates at (ATR beyond band) at 2.0. Picks up the smaller stretches inside a range.
- Running it on lower timeframes — switch Require closing burst (close beyond band) on. Bars that spear out and snap back stop counting, and the stack count visibly calms down.
- Running it on higher timeframes — Basis length around 34 and Tint background on extreme bursts on. The tint flags the kind of extreme bar you only see every few months.
The Mild / Warm / Hot / Extreme colors are all yours to change. On a dark theme the stock palette reads fine, but on a light theme the cyan tends to wash out, so darkening Mild alone cuts down on misreads.
Setting Up Alerts
There are four alerts. Pick “Strong Burst Fader” in TradingView’s alert dialog and the condition dropdown gives you these.
- Up burst (fade short) — an up-stack has printed
- Down burst (fade long) — a down-stack has printed
- Extreme up — an up-stack has topped out at max height
- Extreme down — a down-stack has topped out at max height
The first two fire on any stack, arrow or no arrow. A single cyan diamond sets them off, so anywhere below the daily you’ll be pinged constantly. Realistically you want only the two Extreme alerts armed. They’re evaluated on bar close, so you won’t get one firing mid-bar and then vanishing.
What to Know Before You Rely on It
The Stack Always Lands One Bar Late
“Strong Burst Fader” decides a bar is the peak by checking whether its stretch beat the bars on either side. Since it has to compare against the next one, nothing is settled until that next bar closes. So the stack confirms one bar after the peak and is then drawn back onto the peak bar.
Watching live it feels like the stack just appeared, but the bar it’s describing is already one behind you. The developer is upfront that this lag is inherent to the read rather than a defect. When you’re timing an entry, work from the assumption that by the time you see the stack, a bar has already gone by.
With Confirm on bar close (non-repaint) left on, which is the default, a stack that has printed never disappears or shifts. Turn it off and the live bar gets evaluated too, so the newest stack can appear, vanish, or change height and color. Leave it on whenever you’re stepping through history with Bar Replay or reviewing past charts.
A Tall Stack Is Not a Reversal Call
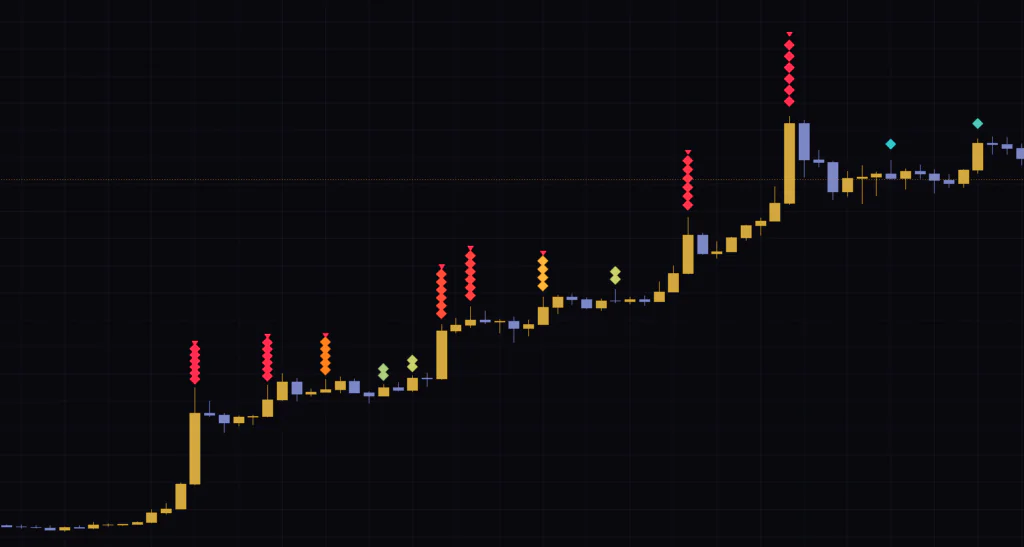
This one trips people up. Height and color rank how stretched the move is, full stop. Neither says anything about the odds of a reversal. The developer says as much himself: it’s a framework for directing attention, not a backtested edge. A six-high red is not a top call, and plenty of the time price simply carries on.
The Band Is Invisible, So the Reclaim Is on You
As mentioned in the how-to section, the indicator gives you no way to eyeball the “price closed back inside the band” condition. Plotting a moving average that matches your Basis type and Basis length, or laying a faint Keltner Channel on the same settings, makes it much easier to run. This is the price of the developer’s clean-chart philosophy, and opinions will differ on whether it was worth paying.
Pairing It With Other Tools
It can’t call direction on its own, so pairing it with something is the assumption going in. These three worked best for me.
EMA 20 (Making the Basis Visible)
This was the single biggest upgrade. Plotting one moving average on the same period as Basis length makes both the reclaim and your first target obvious at a glance. It’s one line, so you barely give up any of the clean-chart benefit.
A Higher-Timeframe Trend Filter
This is about dodging the tape where stacks print in series. Check the daily EMA 200 or whatever higher-timeframe read you trust. If the bigger picture is clearly up, take only the down-stacks (the long side) and skip the up-stacks. That alone keeps you out of most of the squeezes shown earlier.
Using What RSI and Stochastics Can’t Tell You
Once an oscillator pins to its ceiling or floor, it has nothing left to say about how much further price went. “Strong Burst Fader” keeps measuring past that point, so you can use stack height to rank moves after RSI has already maxed out. RSI at 80 might look toppy, but if the stack is only two diamonds high, there’s still room.
Is “Strong Burst Fader” Worth a Slot on Your Chart?
 Image
ImageIf mean reversion is your bread and butter, yes. Upgrading your information from “price touched the band” to “price went this many ATR past it” is enough on its own to sharpen the line between the setups you skip and the ones you take. Being ATR-normalized, it also travels across symbols and timeframes without you touching a single input, which counts for a lot day to day.
That said, it isn’t a complete system. You supply the directional call, and with the band hidden you’ll be borrowing something else to manage the exit. Above all it demands the discipline to sit out when stacks are printing in series. The tall red ones are exactly the ones that grab your eye, and whether you can leave them alone is what separates a good month from a bad one.
Traders who hate adding lines to a chart, and traders who want their fade timing quantified rather than eyeballed, should get on well with it. If you’re after a finished “this prints, you buy” signal, it’ll leave you wanting.