
 IndicatorSignal Forge
SIGNALSDASHBOARDS
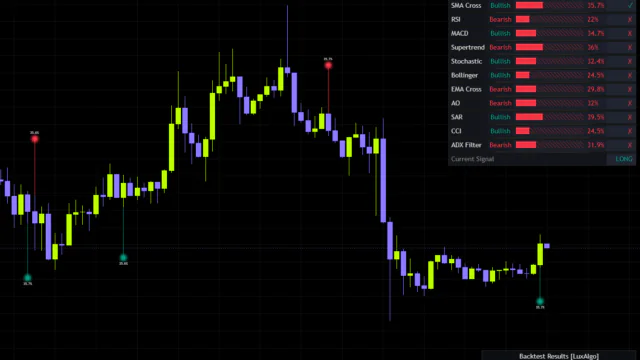
“Signal Forge” Fuses 11 Technical Filters Into a Single Signal You Can Test On the Spot
Difficulty
Advanced
このページは日本語でもご覧いただけます。
日本語で見るIndicators that pull multiple metrics or timeframes into a single on-chart table. They’re used for MTF (multi-timeframe) analysis and for screener-style monitoring of multiple symbols.
All that information can slow things down and clutter the chart. We check what’s being aggregated, when it updates, and whether the data is dense enough to read at a glance without overload. Practicality carries extra weight here: we look at whether features that seem handy actually help in real trading.
IndicatorSignal Forge
SIGNALSDASHBOARDS
Add Vowars as a preferred source
See more Vowars articles in Google's Top Stories and AI answers. Google's settings page will open. Select Vowars there.
Add on GoogleNew article notifications
Get a browser notification when we publish a new indicator review. You can turn it off at any time.