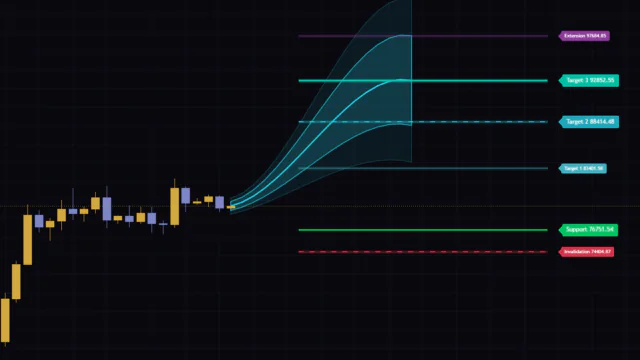


One diamond, and you get the SL plus four profit targets
“Trend Target Ribbon” is a TradingView indicator that, on the bar where the trend flips, draws the entry, stop loss (SL) and profit targets (T1 to T4) on the chart all at once. Trend direction comes from the ALMA (Arnaud Legoux Moving Average), a moving average known for reacting quickly with little lag.
Most trend indicators stop at telling you “up or down.” Everything after that, where to get in, where to cut it and where to take profit, is on you to draw by hand. “Trend Target Ribbon” takes that job off your plate. What sets it apart is that the moment it signals a flip, it lays out a full plan built around one unit of risk (1R).
I ran it on Bitcoin’s 5-minute, daily and weekly charts and followed what kind of plans it printed and how each one played out. Short version: the auto-drawn plans are genuinely well done. But the way it places the SL has a quirk you won’t notice just by looking at the chart, and I can see it burning anyone who doesn’t know about it. This review walks through everything in order, quirk included.
Four things show up on your chart
| Element | What it looks like | What it tells you |
|---|---|---|
| Ribbon | Green band below the ALMA (white line), red band above it | Whether the current trend state is bullish or bearish |
| Candle color | Brighter or duller green/red | How strong the trend’s momentum is |
| Diamonds | Green below the bar, red above the bar | The bar where the trend flipped |
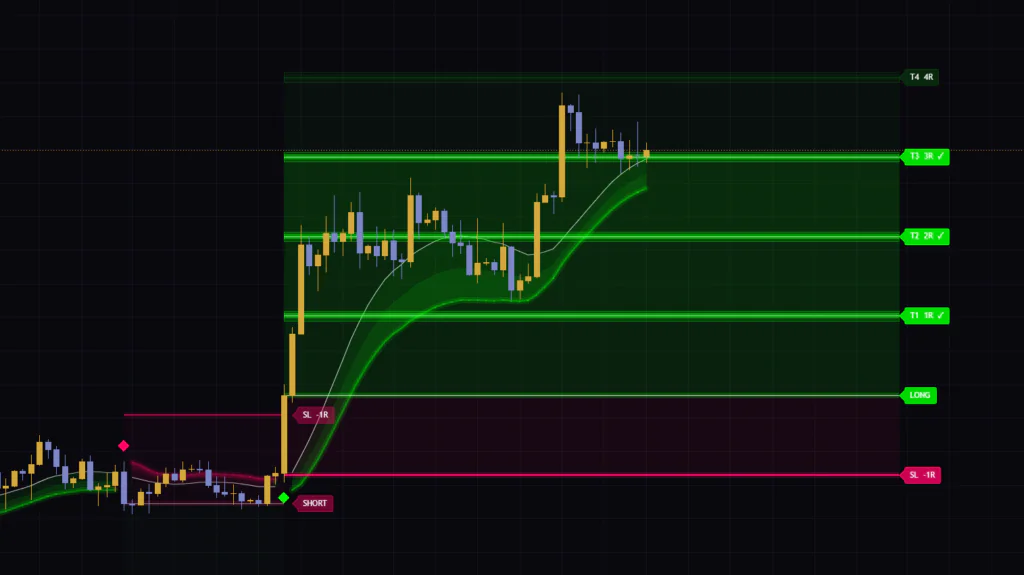
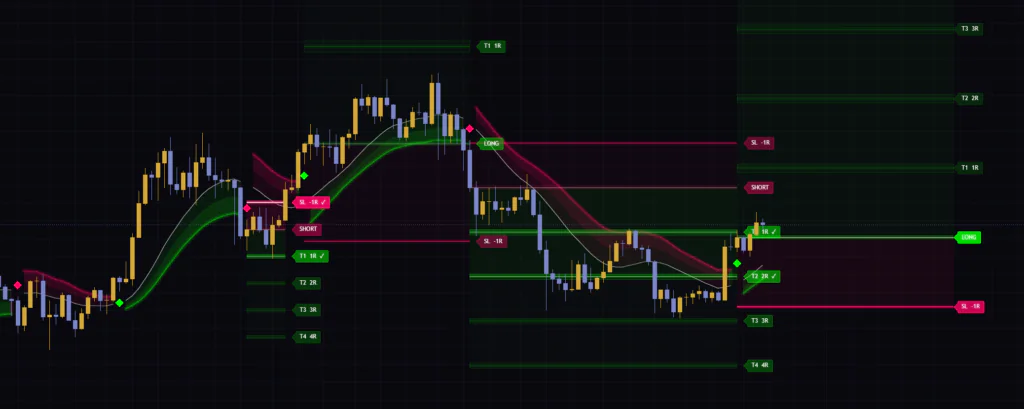
| Plan lines and labels | LONG/SHORT, SL -1R, T1 1R to T4 4R | Entry price, SL, profit targets and whether they’ve been hit |
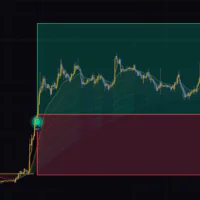
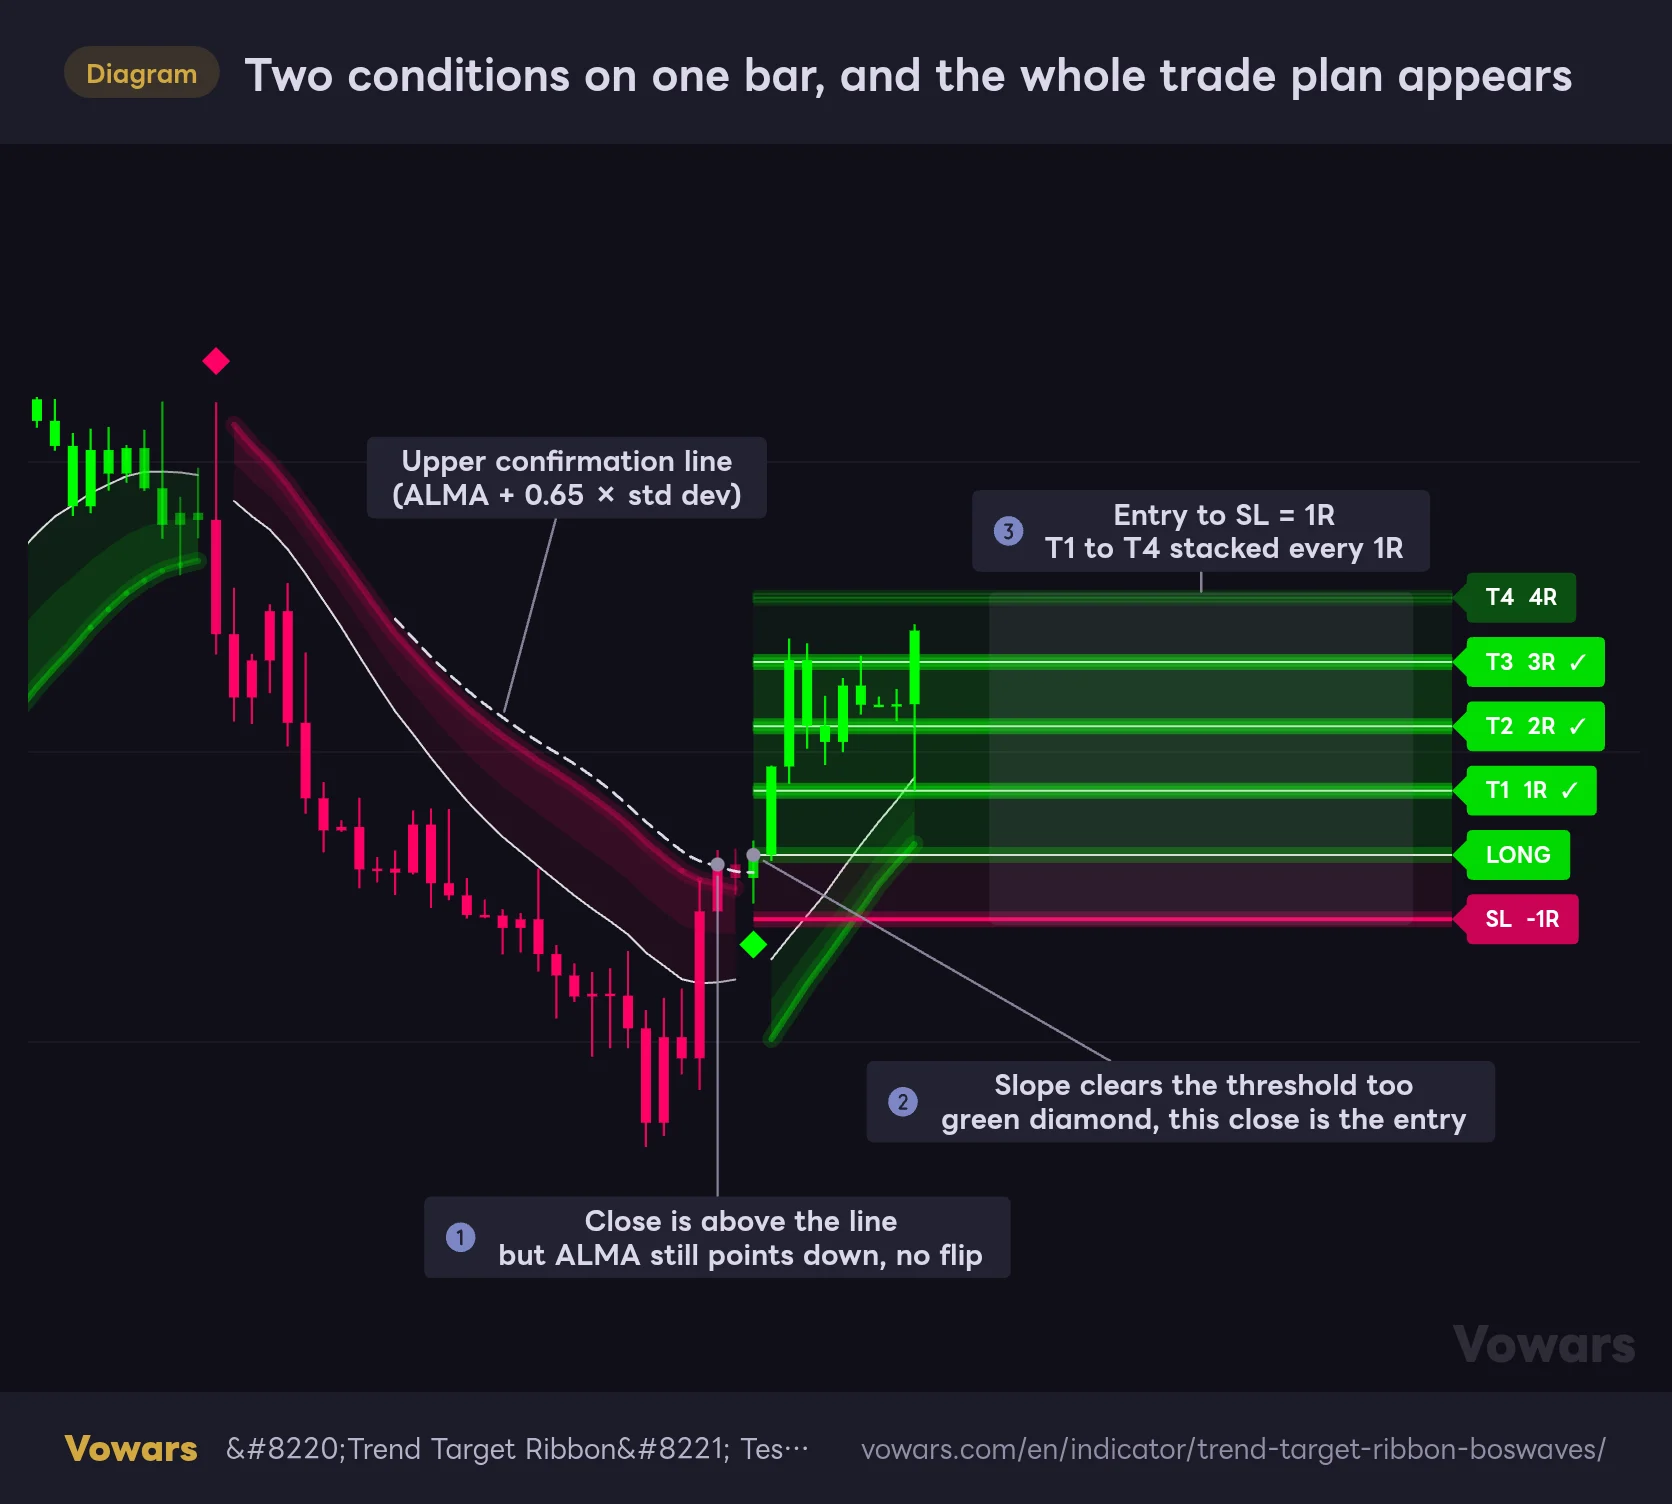
The plan lines are what really grab your attention. The close of the bar with the green diamond becomes the entry price, as shown in Figure ②, and the distance from there to the SL is “1R.” The profit targets then stack up in equal 1R steps, as in Figure ③.
Two conditions on one bar, and the whole trade plan appears
A close above the confirmation line alone won't print a diamond. The plan only appears once the slope agrees.
Vowars DE ver.3.12.19
1R is the distance from your entry to your SL. So T2 2R is a target sitting twice that distance away. It’s the yardstick traders use to measure results as multiples of a single loss, and you can plug it straight into your position sizing too.
A flip needs two conditions to line up at the same time
For a bullish diamond, these two things have to happen. The bearish side is simply the mirror image.
- The bar closes above the “confirmation line”. The confirmation line sits at the ALMA plus 0.65 standard deviations and isn’t plotted on the chart
- The ALMA is clearly sloping up. Its rise over the last 3 bars, divided by ATR (the average range of a single bar), has to be above 0.08
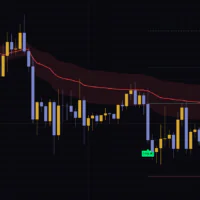
The “both at once” part matters, and it shows most after a sharp V-shaped bounce. Going back to the first figure, the bar at Figure ① already closed above the confirmation line. But the ALMA was still pointing down, so no diamond. Two bars later, at Figure ②, the slope condition finally clicked and the green diamond printed.
Flips come a little late. Whether that bugs you is a matter of taste. Because the switch happens after price has already lifted off the low, there are frustrating moments. On the 5-minute chart I saw several cases where the bounce had basically played out by the time the diamond showed up. The trade-off is that price just chopping back and forth around the ALMA rarely triggers a flip, so it does its job as a filter.
Once it flips, it stays there until the opposite setup appears
“Trend Target Ribbon” has no “neutral” state to fall back to. Once it turns bullish, it stays bullish until both bearish conditions line up. In my testing, the Neutral color in the settings (dark gray by default) only showed up at the far left of the chart, before the very first flip.
In other words, if the market goes sideways in the middle of a bullish state, the display stays green. Reading green as “the last confirmed flip was up” rather than “price is going up right now” matches what’s actually happening.
Candle brightness is momentum, ribbon width is volatility. They look alike but aren’t
“Trend Target Ribbon” repaints the candles themselves green or red. How bright they get depends on a “momentum score” that combines how steep the ALMA slope is with how far the close sits from the ALMA. The higher the score, the brighter the color. The lower it is, the duller it gets.
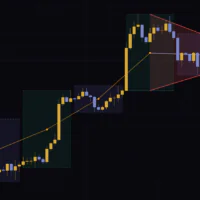
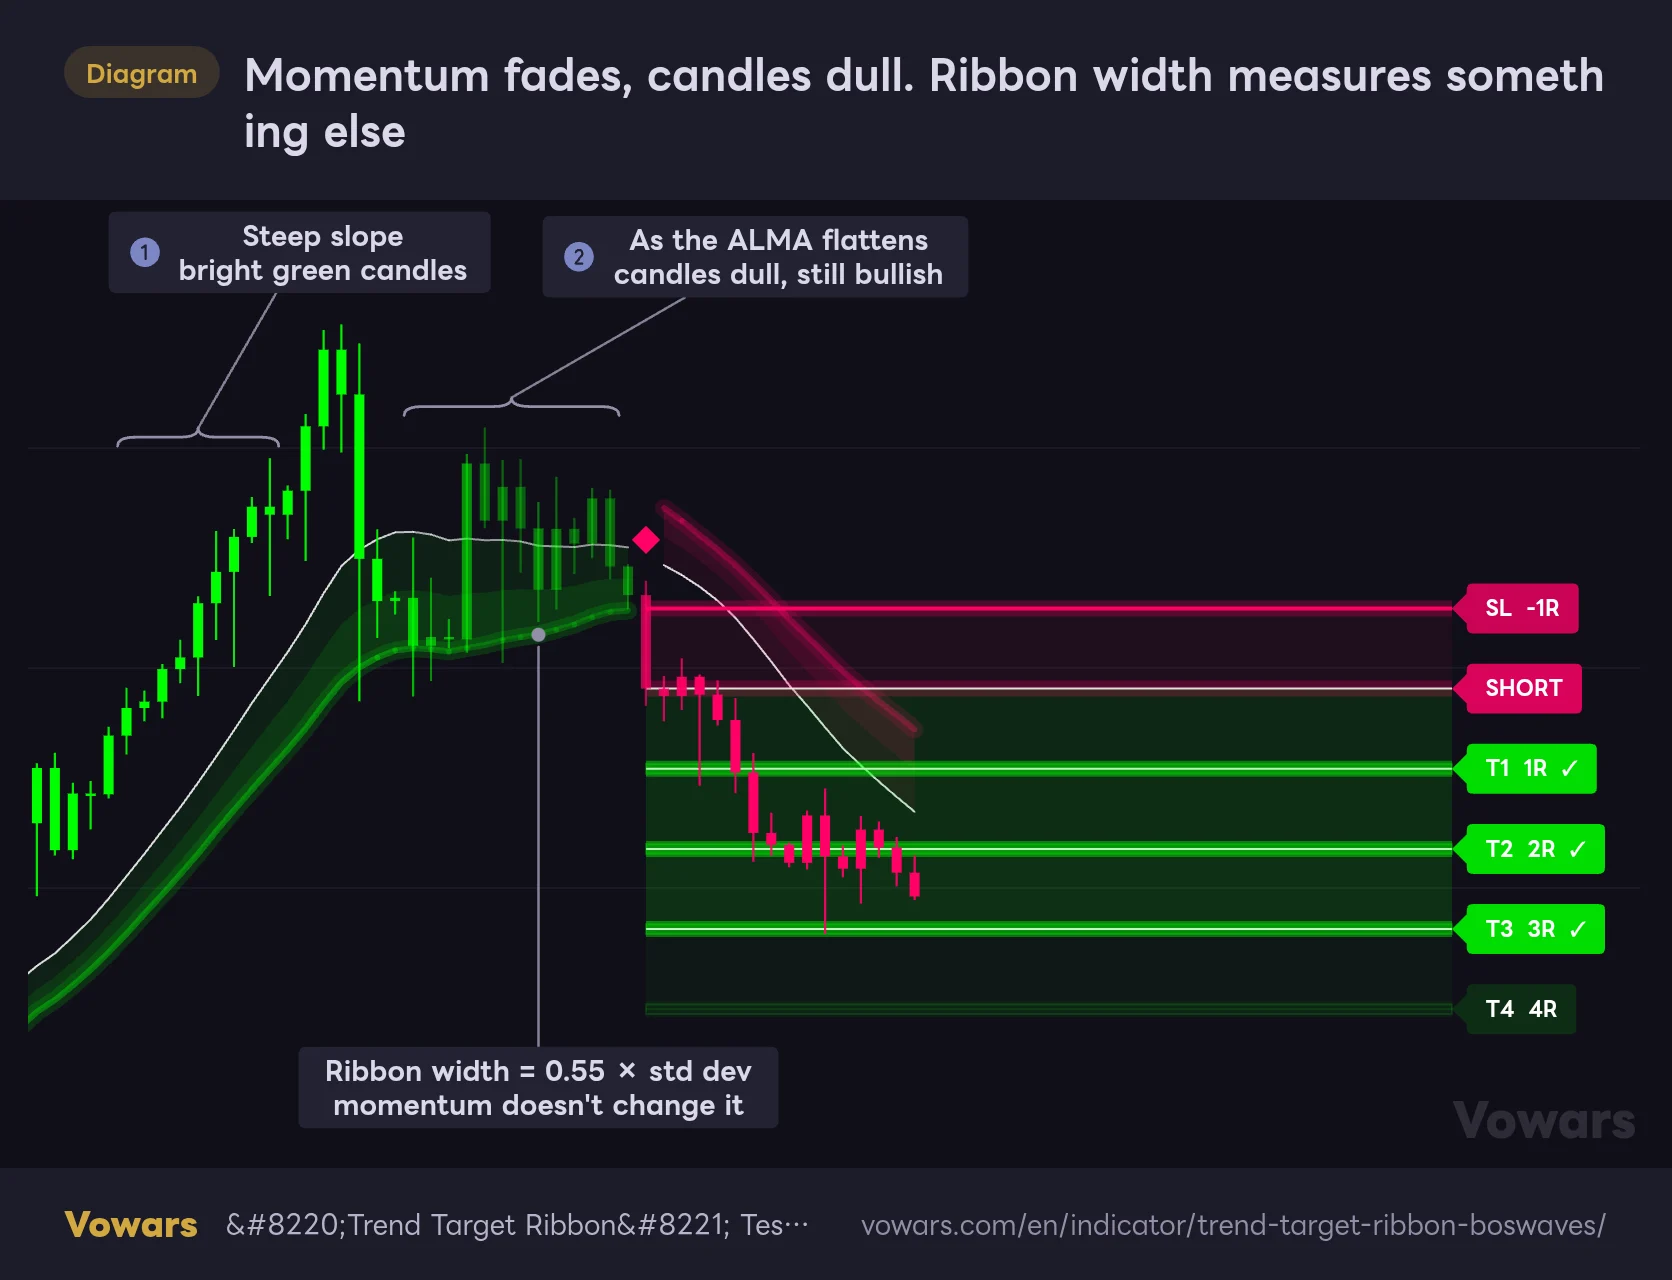
In the strong uptrend leg at Figure ①, the candles are painted a crisp, bright green. Then, at Figure ②, where the ALMA starts to flatten, the candles dull out even though the state is still bullish. A red diamond follows and the trend flips bearish, so the color fading out was warning of weakening momentum before the diamond did.
Momentum fades, candles dull. Ribbon width measures something else
Candle brightness shows momentum. Ribbon width shows volatility.
Vowars DE ver.3.12.19
Where people often get tripped up is the ribbon width. The ribbon runs from the ALMA out to 0.55 standard deviations, so it widens when volatility is high and narrows when it’s low. The ribbon’s fill opacity stays constant too. What the momentum score actually changes is the opacity of the ribbon’s edge line and the white ALMA line, plus the candle color.
Right after a dump or any other violent move, the ribbon gets wider. What it’s showing is how volatile price is. If you want to read momentum, look at how bright the candles are instead.
Another thing I noticed is that the momentum score maxes out pretty fast. Once the ALMA slope and the distance from it line up even moderately, it hits full score, so in a trending leg almost every bar is equally bright. The shading only really stands out when the slope starts flattening mid-trend. For me, using it as “it’s fading, be careful” made more sense than “it’s bright, get in.”
How the plan lines evolve from birth to finish
The plan lines keep changing their look as each new bar comes in. This is the fun part. Here’s the full sequence in order.
1The plan is born on the flip bar
The close of the diamond bar is the entry price. Lines extend 30 bars forward from there, with LONG (or SHORT), SL -1R and T1 1R to T4 4R labels on the right edge. With every new bar, the right end of the lines shifts one bar further out.
2Lines brighten as price closes in on a target
When the close gets within 0.65R of a target, that target’s line and zone gradually light up. It’s a small touch, but a helpful one. You can tell at a glance which target is close, so it’s easy to get your bearings when you come back to the screen.
3A wick touch earns a ✓
Hits are judged on the high and low. Price doesn’t need to close beyond the level. One wick tagging it is enough to turn it into “T1 1R ✓,” and the line stays lit up white.
4Touch the SL and it’s over
Starting from the bar after entry, the plan stops the moment the low (the high for a SHORT) touches the SL, and the label changes to “SL -1R ✓.” If a single bar tags both a target and the SL, it’s treated as a stop-out, and that bar’s target doesn’t get a ✓.
5The next flip freezes it in a faded color
If an opposite diamond appears before the SL is touched, the live plan is cut off on that bar and stays on the chart as a faded record. By default up to 4 plans are shown, including the live one, and the oldest disappears each time a new plan is created.
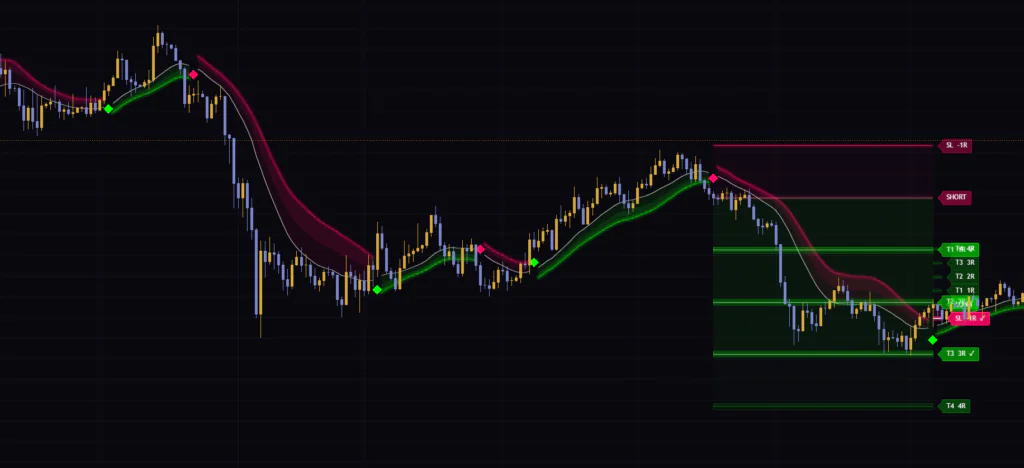
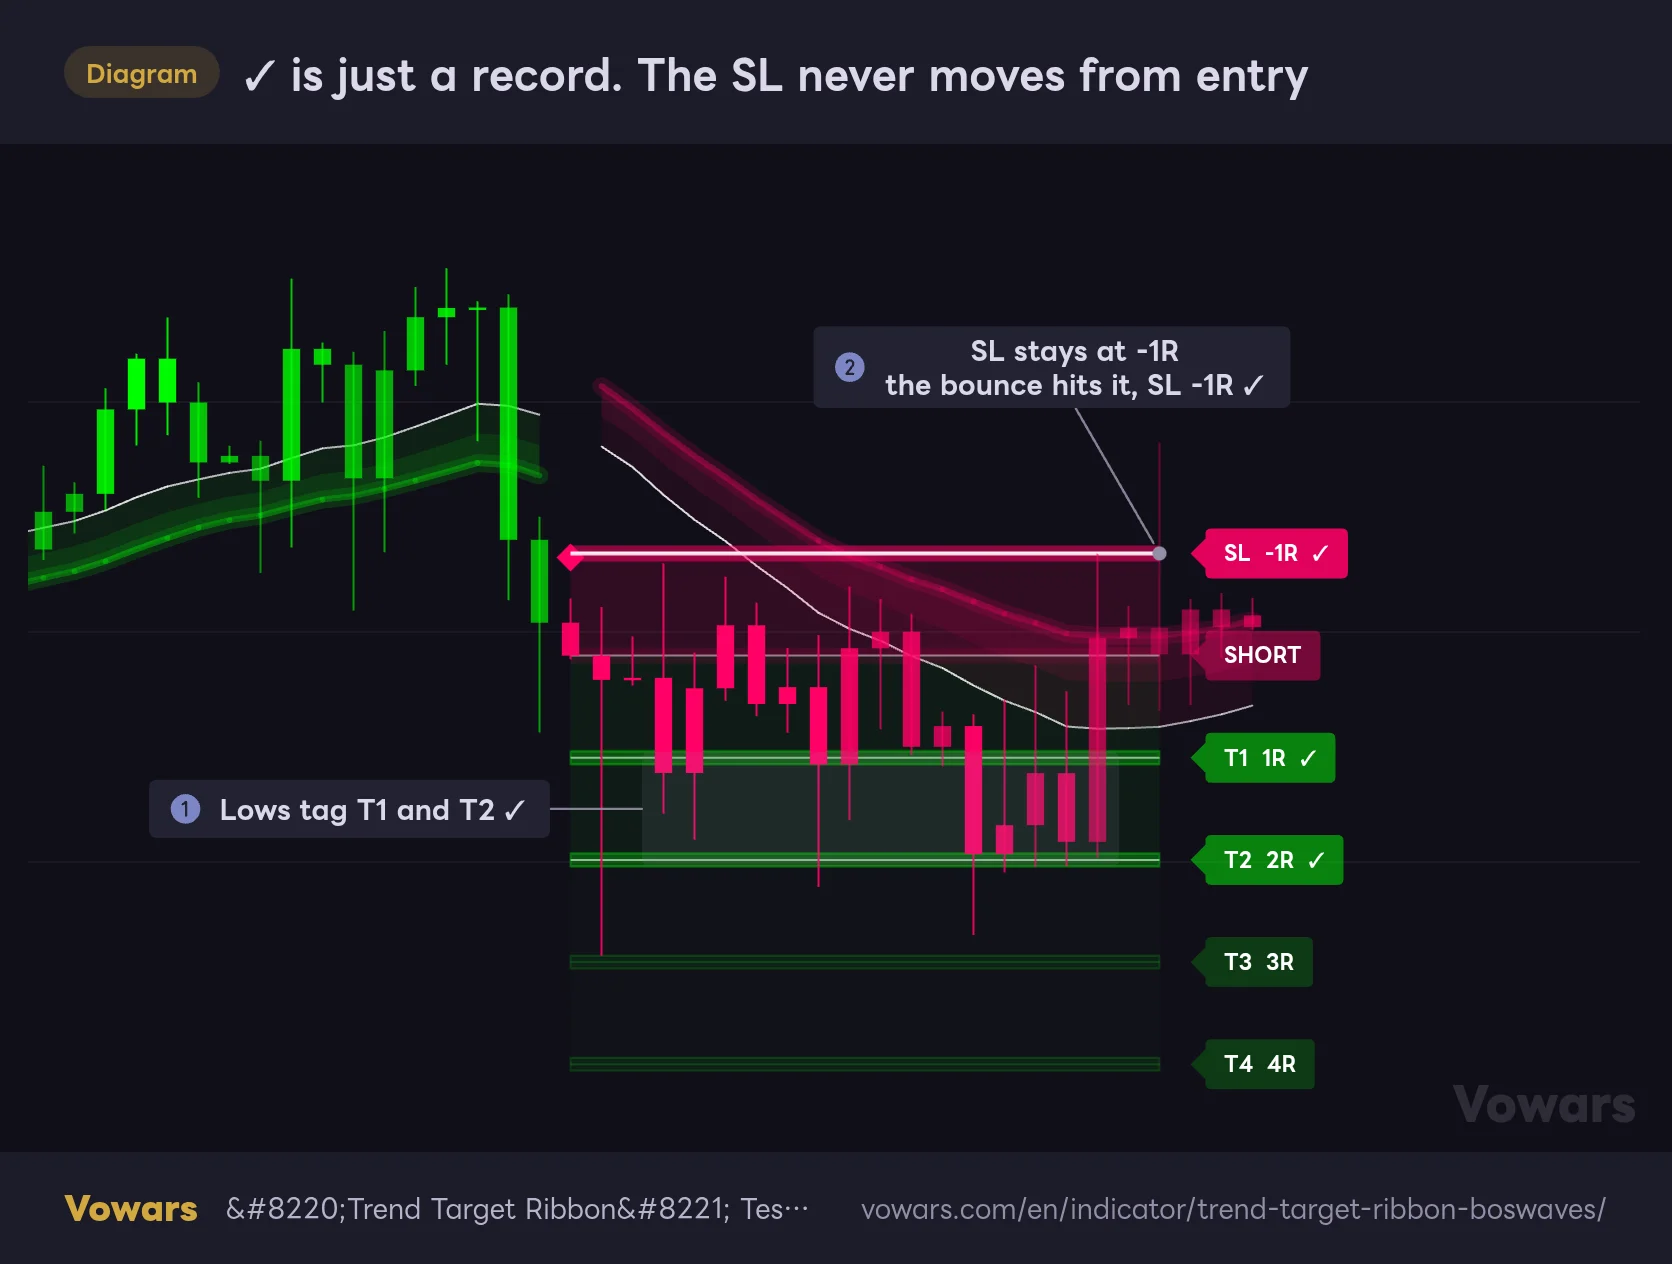
This next part matters. The SHORT at Figure ① reached T1 and T2. But price then reversed and touched SL -1R at Figure ②, ending the plan. The SL never moves from where it was first placed. That stays true even after all four targets have a ✓.
✓ is just a record. The SL never moves from entry
Even after T2 is hit, the SL stays exactly where it started.
Vowars DE ver.3.12.19
So when you see a record like “T2 ✓, then SL ✓,” what that trade actually made depends on how you managed it. Things like taking half off at T1 and moving the rest of the stop to breakeven are up to you. Personally, I don’t see much point in scanning the records and counting “this indicator went X wins, Y losses.”
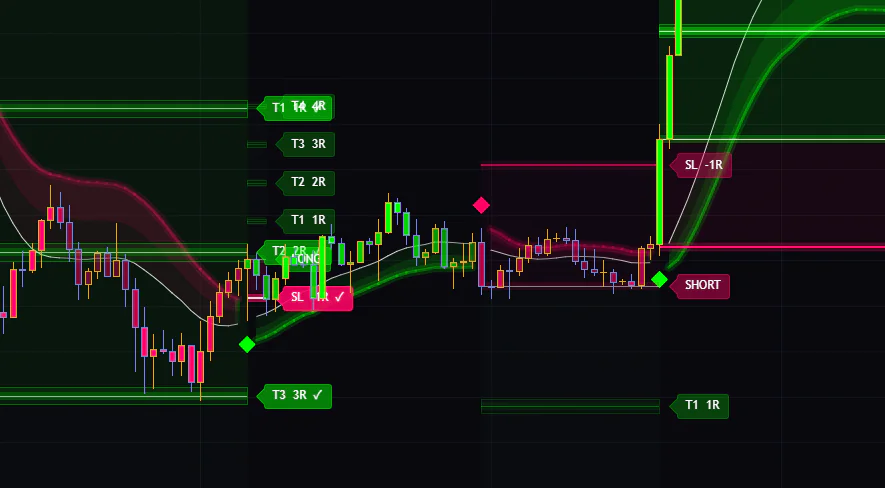
One more thing. After a plan ends at the SL, no new plan is drawn until the next diamond, even if the trend state keeps pointing the same way. On the daily chart, the bullish flip in July got stopped out almost immediately, and the stretch where price kept climbing in a bullish state was left with no plan at all.
What bugged me most: how the SL distance is decided
There’s a setting called Stop Structure Lookback, and from the name alone you’d expect it to “place the SL at the low (or high) of the last 12 bars.” On top of that, if the SL distance comes out narrower than Minimum Stop ATR (0.75 × ATR) it gets widened, and if it’s wider than Maximum Stop ATR (3 × ATR) it gets trimmed.
But when I compared the plans side by side, the SL levels didn’t line up with recent swing lows or highs at all. Reading 1R off the price scale on the 5-minute chart, the LONG around 13:00 had about 80, while the SHORT around 14:00, just 30 minutes later, had about 310. That’s almost a 4x gap in a window where ATR barely changed. Exactly the ratio between the 0.75x floor and the 3x cap. It didn’t look like a coincidence.
Digging into why, it turns out the low (or high) used as the SL reference is not taken from the last 12 bars, but from past flip bars in the same direction. For a LONG, it’s “the lowest low among the last 12 bullish flip bars.” Until there have been 12 flips in the same direction, there’s no reference at all, so the SL defaults to the 0.75 × ATR floor. After that, the reference tends to be a low from months back. If that low is far below the entry, the SL pins to the 3 × ATR cap. If it’s above the entry, it pins to the 0.75 × ATR floor instead.
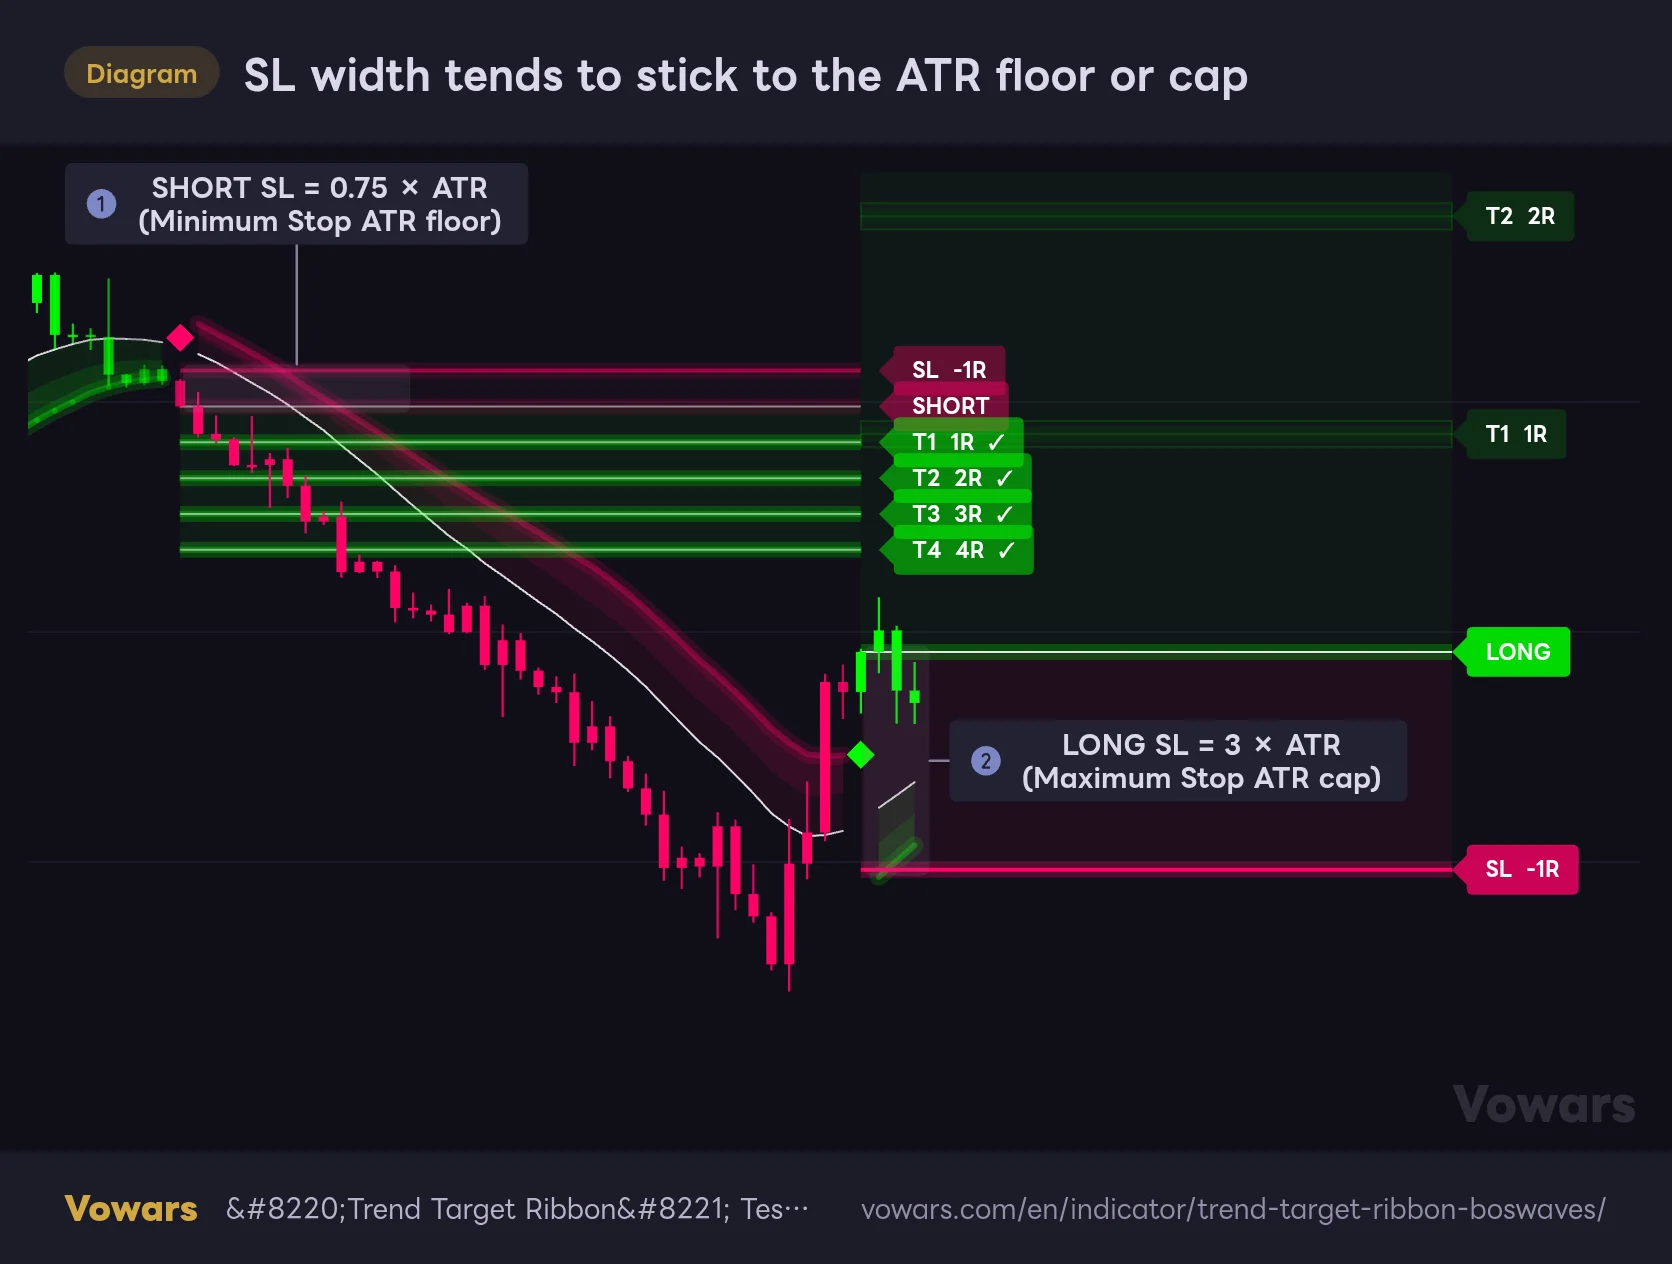
SL width tends to stick to the ATR floor or cap
Same settings, yet 1R changes by almost 4x from one plan to the next.
Vowars DE ver.3.12.19
The SHORT at Figure ① sits at the floor, and the LONG at Figure ② sits at the cap. Same settings, same chart. And yet 1R differs this much. When I ran the numbers on a long price history, 41 out of 42 flips had their SL pinned to either the floor or the cap. That “12” comes from Stop Structure Lookback, and even dropping it to 3 only got about one in ten stops to land between the limits.
The SL you see is not a stop tucked beyond the latest swing. A tight 0.75 × ATR stop is less than the range of an average single bar. It’s easy to get wicked out by noise, so I wouldn’t use it as your actual stop order as-is.
Flip it around, though, and it works nicely for traders who size their stops in ATR multiples. Set Minimum Stop ATR and Maximum Stop ATR to the same value (say, 1.5 for both), and the SL lands at exactly that ATR multiple every time, so 1R always means the same thing. The allowed range is 1.0 to 3.0. Once I set it up this way, I could read the plan lines as “a ruler scaled to the current volatility” without second-guessing them.
The settings, and which ones are worth changing
The settings panel is split into three groups: “Trend,” “Position” and “Display.” The table below covers the first two, which drive the trend logic and the plan. The suggested values are my own take, based on the quirks covered above.
| Setting | Default | Suggested | Effect |
|---|---|---|---|
| Source | close | close | Price used for calculations |
| ALMA Length | 34 | 25-34 (intraday) / 34+ (daily and up) | ALMA period. Shorter reacts faster and produces more flips |
| ALMA Offset | 0.85 | 0.85 | Closer to 1 weights recent prices more and reacts faster |
| ALMA Sigma | 6 | 6 | Higher values make the line smoother |
| Deviation Length | 34 | 34 | Standard deviation period used for the confirmation line and ribbon width |
| Trend Confirmation | 0.65 | 0.5-0.8 | Distance to the confirmation line (std dev multiple). Higher means fewer, later flips |
| Slope Length | 3 | 3 | How many bars back the ALMA slope is measured against |
| Minimum Slope | 0.08 | 0.08-0.12 | ALMA slope required for a flip. Higher means fewer flips in chop |
| ATR Length | 14 | 14 | ATR period used for the slope threshold and SL distance |
| Stop Structure Lookback | 12 | 12 | Range searched for the SL reference. In practice it counts past flips, and changing it barely affects how the SL pins to the limits |
| Minimum Stop ATR | 0.75 | 1.5 | SL distance floor (ATR multiple) |
| Maximum Stop ATR | 3 | 1.5-3 | SL distance cap (ATR multiple). Set it equal to the floor for a fixed SL distance |
| Profit Targets | 4 | 3-4 | Number of profit targets (2-4) |
| Target Zone Size | 0.06 | 0.06 | Width of the thin zone around each target (fraction of 1R) |
| Target Approach Range | 0.65 | 0.65 | Distance at which a target starts to brighten (R multiple) |
| Projection Length | 30 | 30 | How many bars the plan lines extend forward |
| Positions On Chart | 4 | 1-2 | Number of plans kept on the chart, including the live one (1-5) |
Too many flips, or too few?
The two main knobs for how often it flips are Minimum Slope and Trend Confirmation. Raising the first makes it “wait until the ALMA is clearly tilted,” and raising the second makes it “wait until price closes well away from the ALMA.” If diamonds keep flip-flopping on a choppy instrument, try bumping Minimum Slope up to around 0.12 first. If flips feel too late, lowering Trend Confirmation to around 0.5 gets you closer to the start of the move.
Shortening ALMA Length makes everything react faster, but the ALMA slope gets twitchier, so you’ll get more flips. As a rough guide, around 25 if you’re trading actively on the 5-minute or 15-minute chart, and the default 34 or longer if you’re taking a patient approach on the daily and above.
Display settings for when the chart gets cluttered
| Setting | Default | What it does |
|---|---|---|
| Show Trend Gradient | On | Shows the ribbon (band and ALMA line) |
| Show Position Labels | On | Shows the LONG/SL/T1 to T4 labels. Lines and zones stay even when off |
| Color Candles | On | Colors candles based on momentum |
| Label Size | Normal | Label size (Tiny to Huge) |
| Bull/Bear | #00FF00/#FF0066 | Bullish and bearish colors |
| Take Profit/Stop Loss | #00FF00/#FF0066 | Colors for profit targets and the SL |
| Core/Neutral | #FFFFFF/#555555 | Color of the ALMA and entry lines / color before the first flip |
Labels from finished plans pile up just to the right of the bar where they were cut off. When flips come in quick succession, new plan labels stack on top of them and sometimes become unreadable. Dropping Positions On Chart to 1 or 2 and setting Label Size to Small cleans things up a lot.
In a choppy 5-minute market, nearly every diamond got stopped out
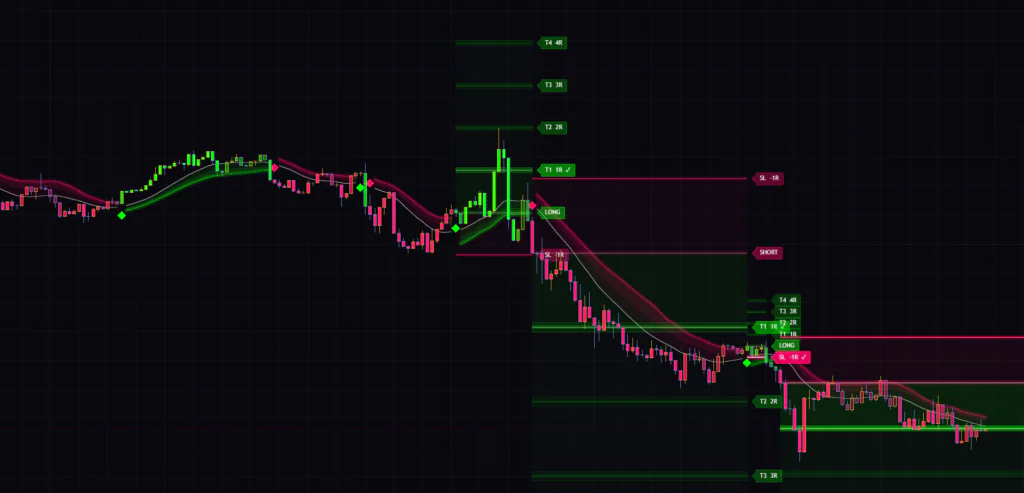
Looking at the 5-minute chart from just after midnight to shortly before 18:00, there were about 8 diamonds. The plans that printed while price was chopping up and down mostly hit their SL within a few bars. The LONG around 13:00 turned into “SL -1R ✓” almost immediately. The SHORT at 10:00 just before it had reached T1, which made the contrast once the chop set in very clear.
Even with the two-condition filter, diamonds in a directionless market are prone to fakeouts. And when the plan’s SL is at the tight 0.75 × ATR floor, a single wick is enough to end it. On the daily chart, on the other hand, flips were rare and some plans ran a long way. The SHORT from late May reached T3, and the LONG from late August had ✓ up to T3 as of 9/28. On the weekly, flips are even rarer and 1R gets wider.
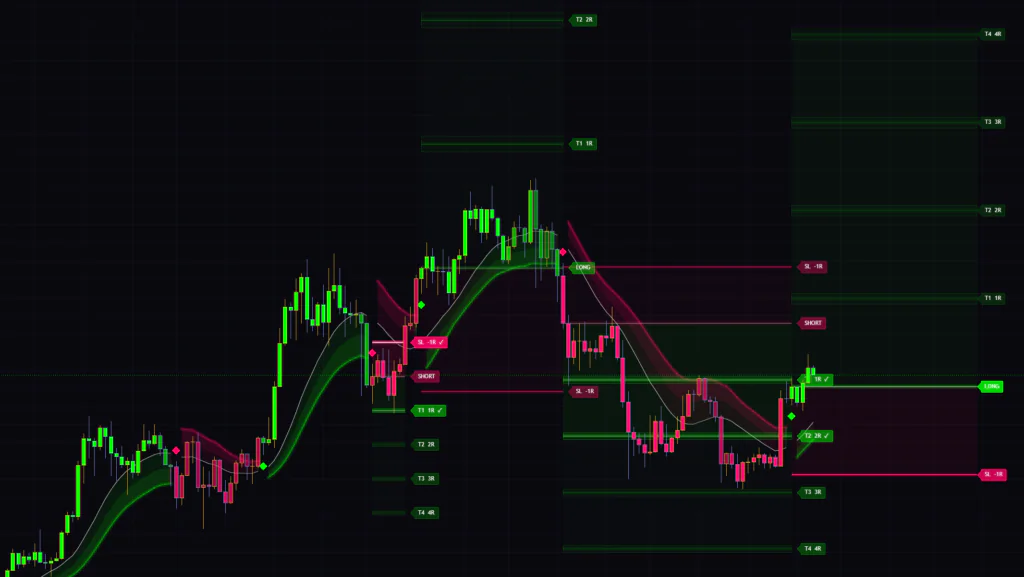
I think this design pairs well with instruments that tend to run in one direction for a long time, like gold, and with stock indices on roughly the 1-hour to daily timeframes. On the flip side, for instruments that like to range back and forth on lower timeframes, every diamond tends to get stopped out, so it’s safer to raise Minimum Slope up front.
Fill in the missing “structure” with Donchian Channels
If I had to pair “Trend Target Ribbon” with something, I’d pick TradingView’s built-in Donchian Channels (length 20). Donchian Channels are a simple band connecting the highest high and lowest low of the last 20 bars. It adds the “recent swing low and high” structure this indicator is missing straight onto your chart.
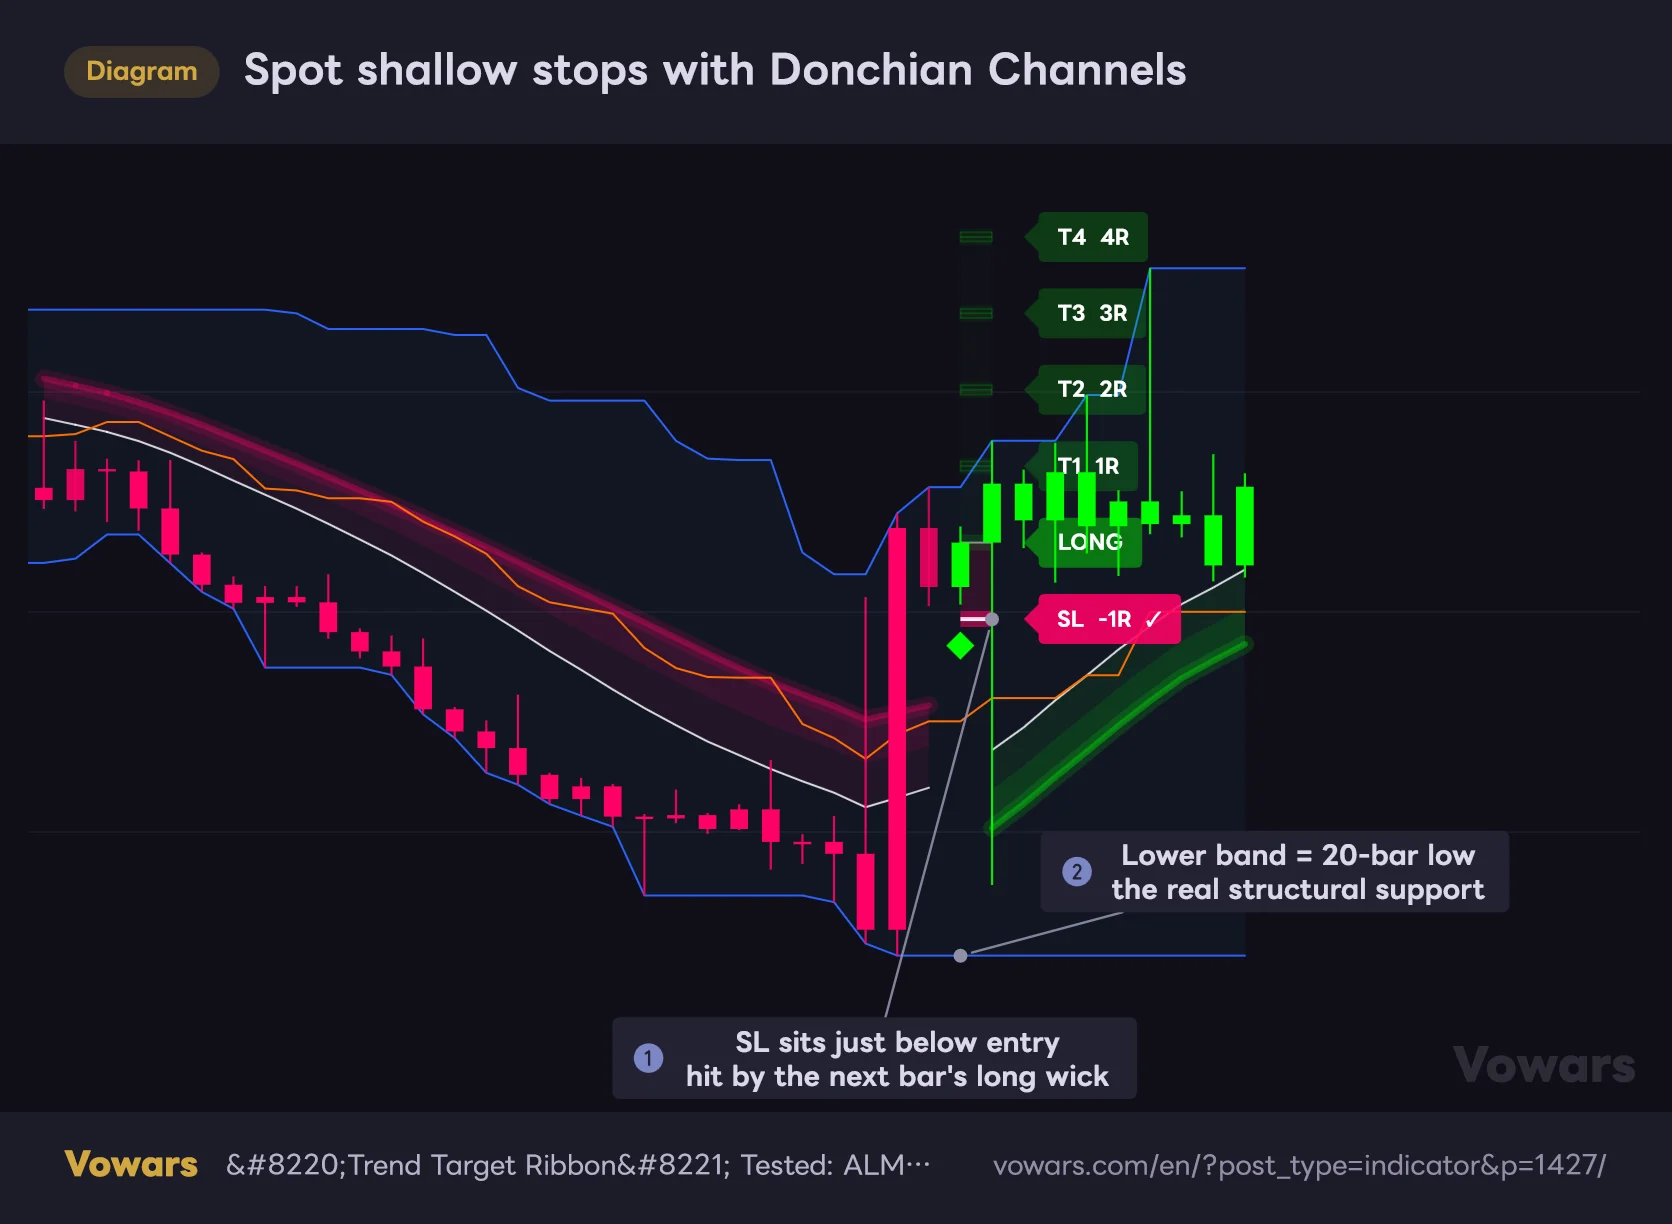
In this LONG, the SL sits right below the entry, as shown in Figure ①, and the next bar’s lower wick took it out with no effort. Look at the channel’s lower band in Figure ②, and the recent low is way below. Once you can see the SL is sitting shallow inside the channel, you can decide “I won’t use this plan’s SL as my real stop” or “I’ll put my stop just beyond the lower band and size down to match.”
Spot shallow stops with Donchian Channels
The lower edge of the blue channel is the 20-bar low. Check whether the SL sits inside it.
- Donchian Channels (20)
Vowars DE ver.3.12.19
- If the SL sits outside the channel, treat it as a structurally reasonable level and use it as is
- If the SL sits inside the channel, move your stop beyond the channel and cut your size so the risk stays the same
- While price keeps pushing to new channel highs (or lows), there’s room to aim for T2 and beyond
Repainting and alerts: what to watch for
“Trend Target Ribbon” doesn’t pull data from higher timeframes or look at future values. Its logic runs on the bar’s close, so once a bar has closed, the diamond’s position and the plan’s prices won’t change after the fact (old plans disappearing once you exceed the display limit is a separate behavior, not repainting). On the live bar that’s still forming, though, a diamond and plan can appear when the conditions are met mid-bar and vanish again if they stop being met. Treat anything on the live bar as a “candidate” until it closes.
There are two alerts, “Bull Trend” and “Bear Trend,” and both fire with the flip diamonds. According to TradingView’s help center, alerts set to any frequency other than “Once Per Bar Close” can fire on intrabar price action (as of 9/30/2026). If you only want confirmed diamonds, choosing that frequency is the safe bet.
The chart keeps 5 plans at most, and anything older disappears. To check past plans, use Bar Replay to step forward one bar at a time from an earlier date, and you can watch the plans get drawn as they would have at that point. Daily and higher timeframes let you go back through the full history on any plan, but how far back you can go on intraday timeframes depends on your plan, so check that first if you’re testing on lower timeframes (per TradingView’s help center as of 9/30/2026).
Also note that “Trend Target Ribbon” is built as an indicator, so it doesn’t show win rates or P&L stats. And if you try to read performance from the number of ✓ marks, keep in mind those records assume the SL never moves, as covered above, so they won’t match how you actually trade.
Where it shines, and what to watch out for
Where it shines
- Entry, SL and T1 to T4 all appear on the flip bar, so no more drawing levels by hand
- The ✓ marks and brightening lines show at a glance which target price has reached
- The close-plus-slope filter means small wiggles around the ALMA rarely trigger a flip
- Nothing changes on bars that have already closed
- Set the SL floor and cap to the same value and every plan uses a consistent, ATR-based risk
What to watch out for
- The SL almost always pins to the ATR floor or cap instead of a recent swing
- The SL never moves once placed, so protecting profits is on you
- After a stop-out, no new plan appears until the next flip, so it’s easy to miss the rest of the trend
- Flips tend to lag the start of the move, and in chop the tight stops get hit one after another
- Labels from finished plans pile up and clutter the chart
For traders who want a consistent plan template on their chart
 Image
Image“Trend Target Ribbon” takes you from the flip signal all the way to a trade plan in one continuous view. The moment a diamond prints, you see where to get in, how much you’re willing to lose and where to take profit, which makes it a solid companion if you want less second-guessing in your decisions. It felt like an especially good fit for a style that calmly rides trend after trend on the daily or 4-hour chart.
That said, it’s risky to assume the SL on screen is “a stop derived from market structure.” In reality it’s a ruler set by an ATR multiple. So either set the floor and cap to the same value with that in mind, or overlay a structural reference like Donchian Channels and decide your own stop from there. Get that part right, and it’s also a great way to build the habit of planning every trade with the same yardstick.