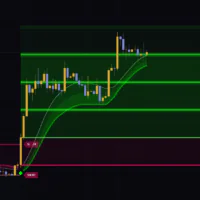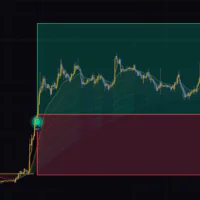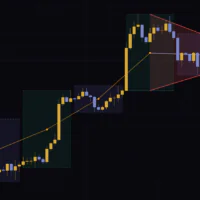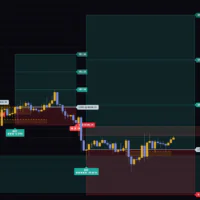


“Structure-Anchored VWAP” Re-Anchors the VWAP at Every New Swing
If you’ve ever used an anchored VWAP, you know the struggle of deciding where to anchor it. The most recent low, or the one before that? And every time price moves on, you’re dragging the anchor around again.
“Structure-Anchored VWAP” (shown on the chart as “SA-VWAP”) automates that choice. Each time a swing high or swing low is confirmed, it re-anchors the VWAP right there. Up legs are drawn in green and down legs in red, so you can always see where the average cost of everyone who joined the current move sits.
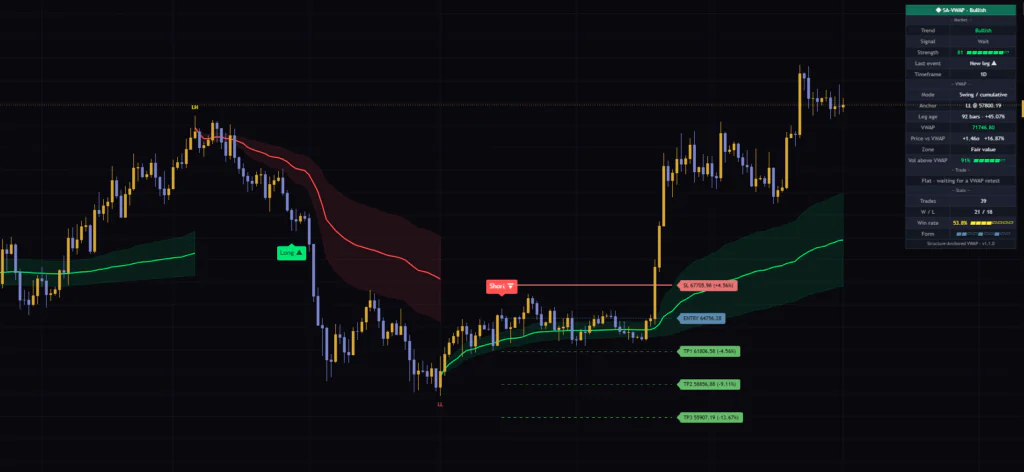
VWAP (volume-weighted average price) is an average that gives more weight to prices where more volume traded. An anchored VWAP simply starts that calculation from a bar you choose. Since “Structure-Anchored VWAP” starts the calculation from a swing, the easiest way to think about it is as a tool that answers one question: measured from the low where this rally began, is price above or below the average?
On top of that, it bundles Long ▲ / Short ▼ signals on pullbacks to the VWAP, ATR-based stop-loss and take-profit lines, and a dashboard that tracks the win rate. I ran it on Bitcoin across the weekly, daily, 1H and 5m charts. With this many features, there are a few spots that are easy to misread if you don’t know how it works, and I’ll be upfront about those here too.
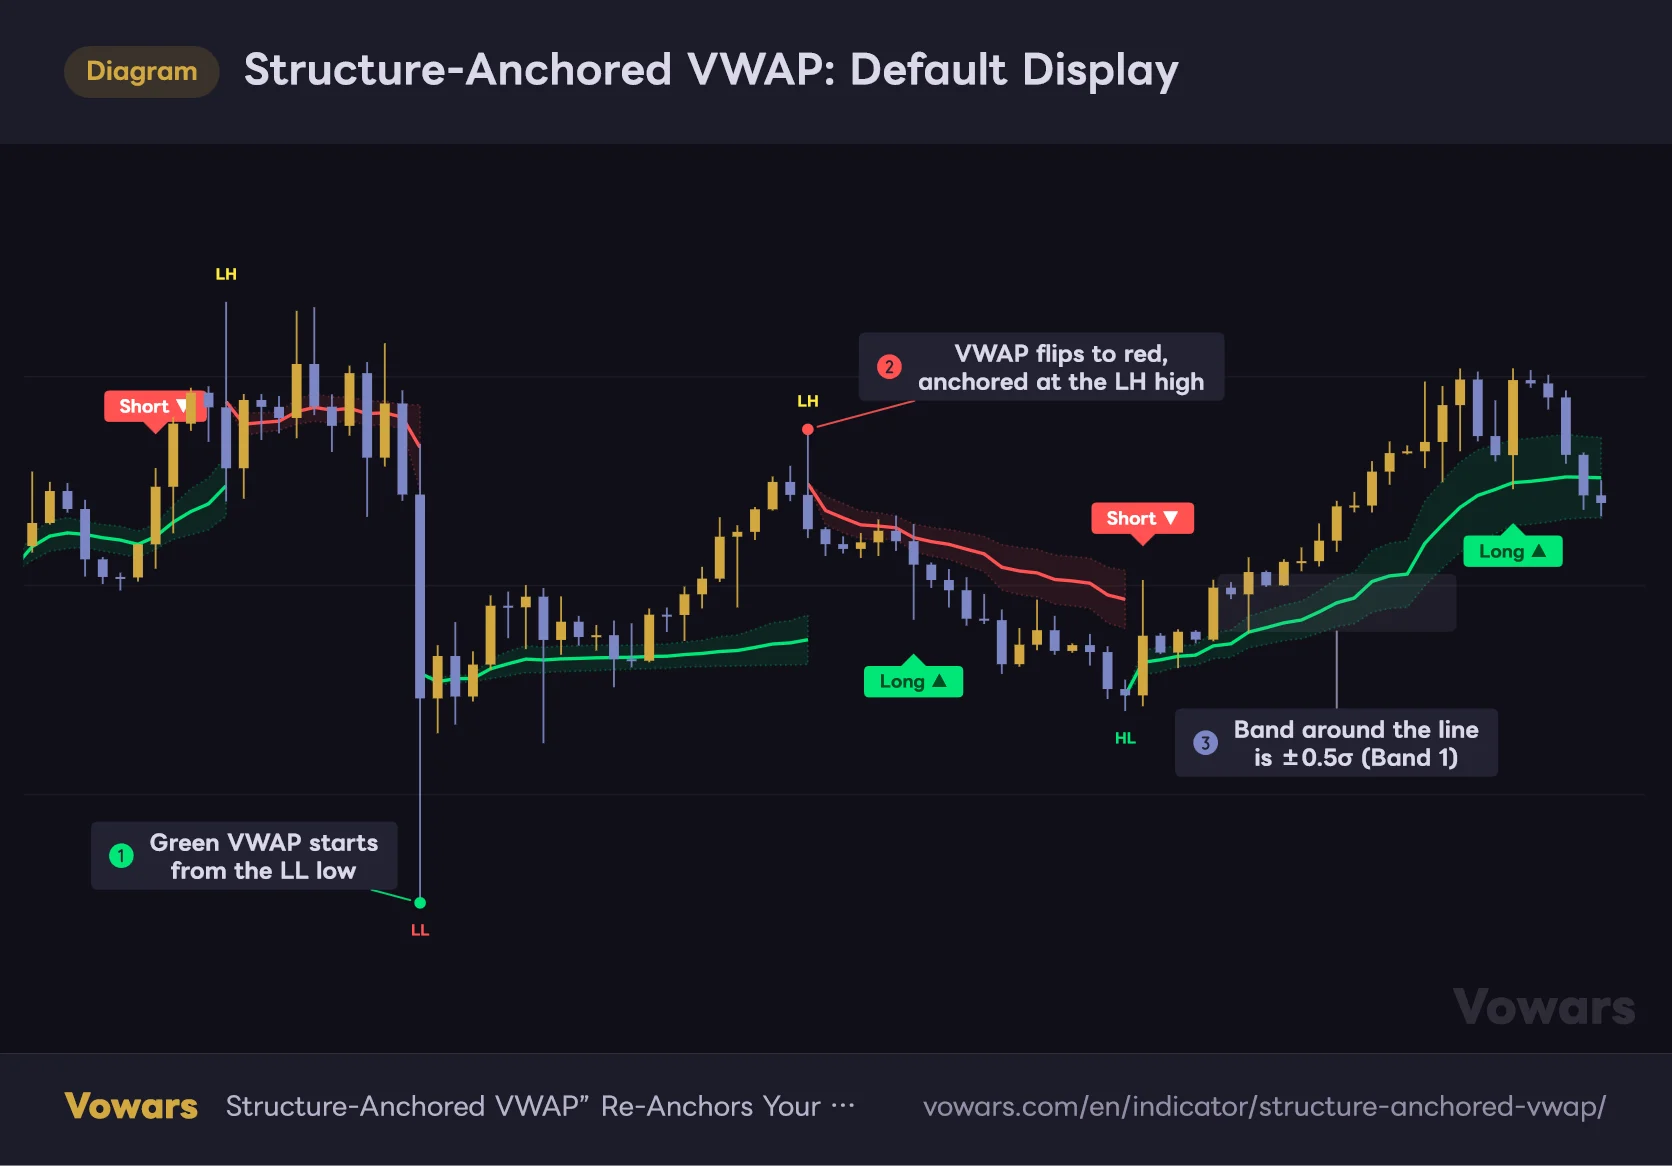
Structure-Anchored VWAP: Default Display
The VWAP re-anchors automatically at each confirmed swing high and low.
Vowars DE ver.3.12.24
Let’s start with the big picture. As shown in Figure ①, once a low is confirmed as an LL, a green VWAP starts from it. In Figure ②, a high is confirmed as an LH, and the VWAP flips to red, anchored at that high. The faint band around the line, as Figure ③ shows, is ±0.5 standard deviations (σ) calculated from that leg’s own volume.
To make the mechanics easier to see, the figures in this article use Pivot strength left and right lowered to 10/10. The default is 55/55, so on a real chart you’ll see fewer legs, and each one runs much longer.
Reading Everything on the Chart, One Element at a Time
“Structure-Anchored VWAP” puts a lot on the chart, so let’s first sort out what each element means. If you start trading it without this clear in your head, it’s easy to misread the signals.
| Element | Meaning | Color / Style |
|---|---|---|
| Curve | Anchored VWAP calculated from the current leg’s anchor | Green for up legs, red for down legs |
| Band around the curve | VWAP ±0.5σ (Band 1). Band 2 (±2σ) is hidden by default | Faint fill in the same color as the curve |
| HH / HL / LH / LL / EQH / EQL | Type of confirmed swing | Highs: only HH is green, the rest yellow. Lows: only LL is red, the rest green |
| Long ▲ / Short ▼ | Bar where a VWAP retest entry was taken | Green and red labels |
| ENTRY / SL / TP1–3 | Entry price, stop-loss and take-profit levels | Blue dotted / red solid / green dashed |
| Horizontal dashed line | Final VWAP value of a finished leg (memory level) | Dashed line in the leg’s color |
| Table at top right | Trend, distance from VWAP, open position, stats | Header color follows the leg direction |
Green and Red Curves = the Current Leg’s Average Cost
The color of the curve tells you which way the current leg is heading. Up legs are anchored at the preceding swing low, down legs at the preceding swing high. If price is above the green curve, most traders who bought into that rally are sitting in profit.
A regular session VWAP resets at the start of each day and starts calculating regardless of what the market structure looks like. Because “Structure-Anchored VWAP” anchors to swings, it keeps tracking “this move’s average” even across big multi-day moves. That’s what I like most about it. It’s really handy for gauging how deep a pullback is on the daily or 4H.
HH / HL / LH / LL Labels Confirm the Swing After the Fact
The labels show whether a confirmed swing is higher or lower than the previous one. Highs are compared with the previous high, lows with the previous low. If the difference is within 0.1× ATR, the swing is labeled EQH or EQL (equal high / equal low) instead.
The thing to watch out for: a label only appears after the number of right-side bars has printed past the swing bar. With the default of 55, that’s 55 bars later, so think of every label as being stuck onto a past bar after the fact. Swings are also kept in a strict high-low-high alternation. If two of the same type show up in a row, the label moves to the more extreme one.
VWAP Memory Levels: Key Levels Left Behind by Finished Moves
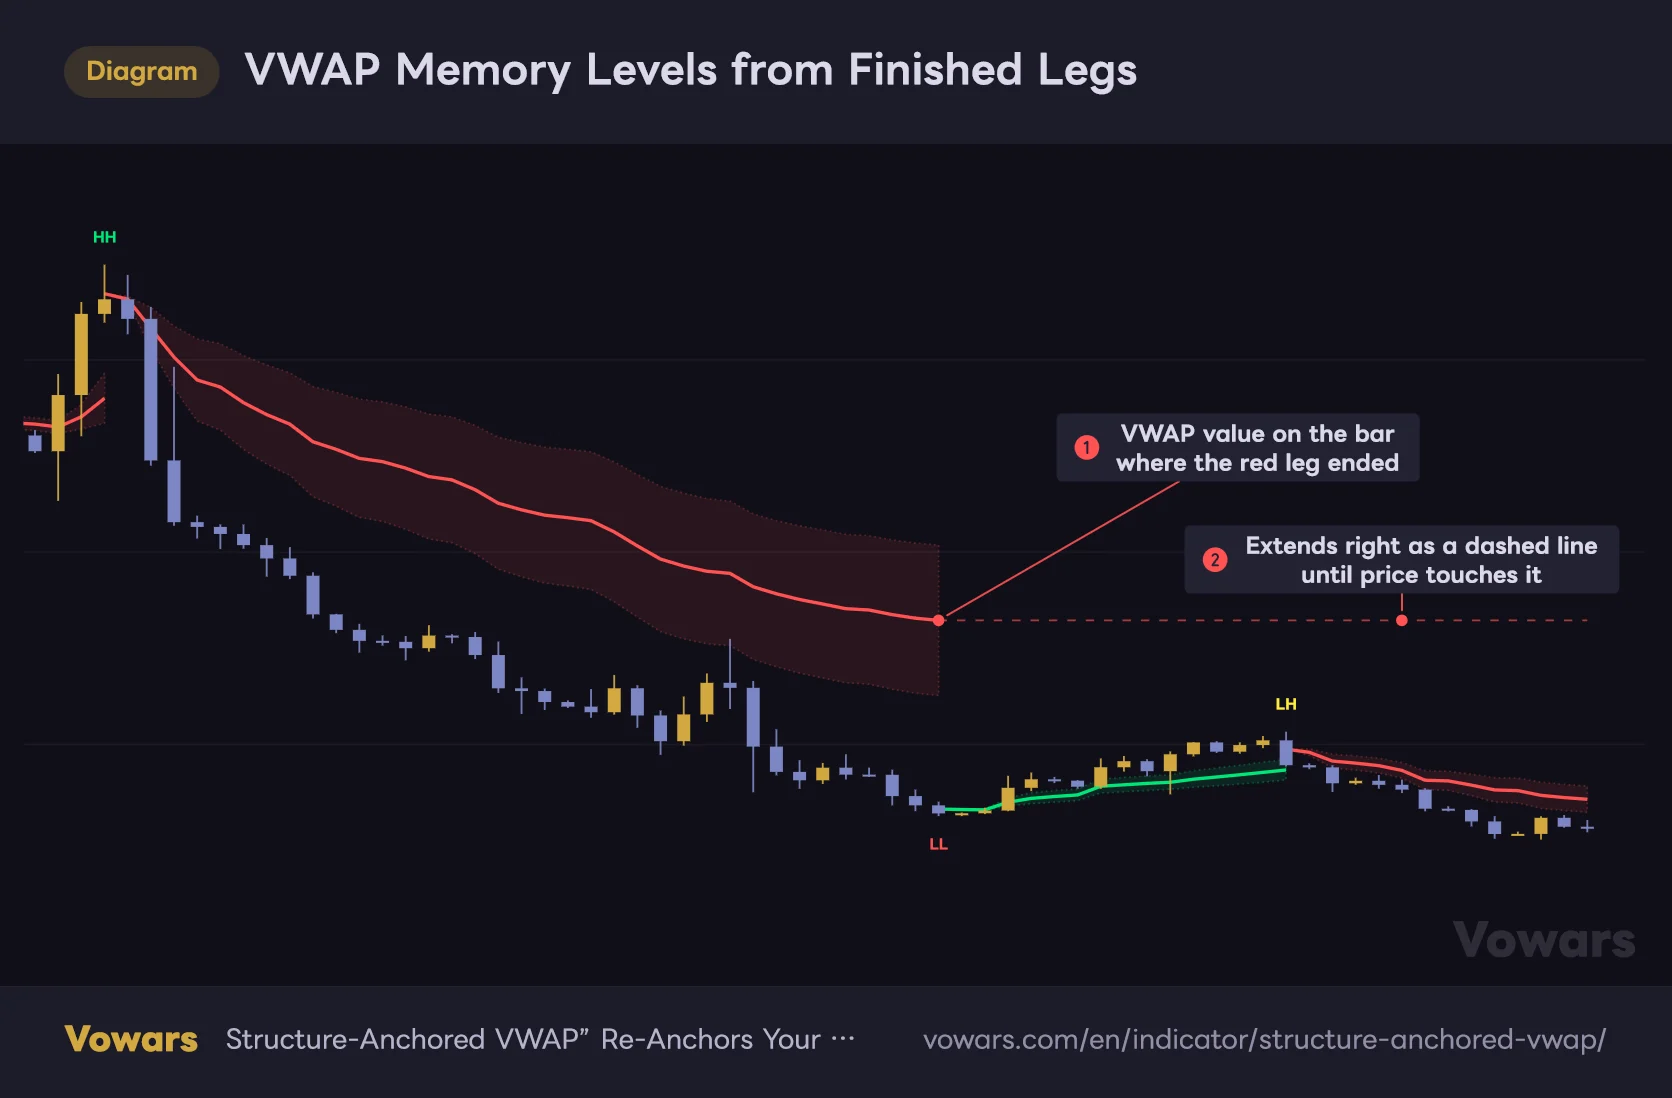
VWAP Memory Levels from Finished Legs
When the leg flips, the final VWAP value of the finished leg stays on the chart as a horizontal dashed line.
Vowars DE ver.3.12.24
When the leg direction flips, the final VWAP value of the finished leg stays on the chart as a horizontal dashed line. Figure ① is where the red leg ended, and Figure ② is the dashed line extending to the right from there. By default, the line disappears once price trades into that level.
Old anchored VWAPs often end up acting as support or resistance later on. VWAP memory levels keeps them on the chart for you automatically, and I mostly use it to watch how price reacts when it comes back to one of these dashed lines on a higher timeframe. If you want to keep them even after price touches them, turn on Keep crossed levels (dotted) and they’ll stay as faded dotted lines.
The Dashboard: Current State and Track Record
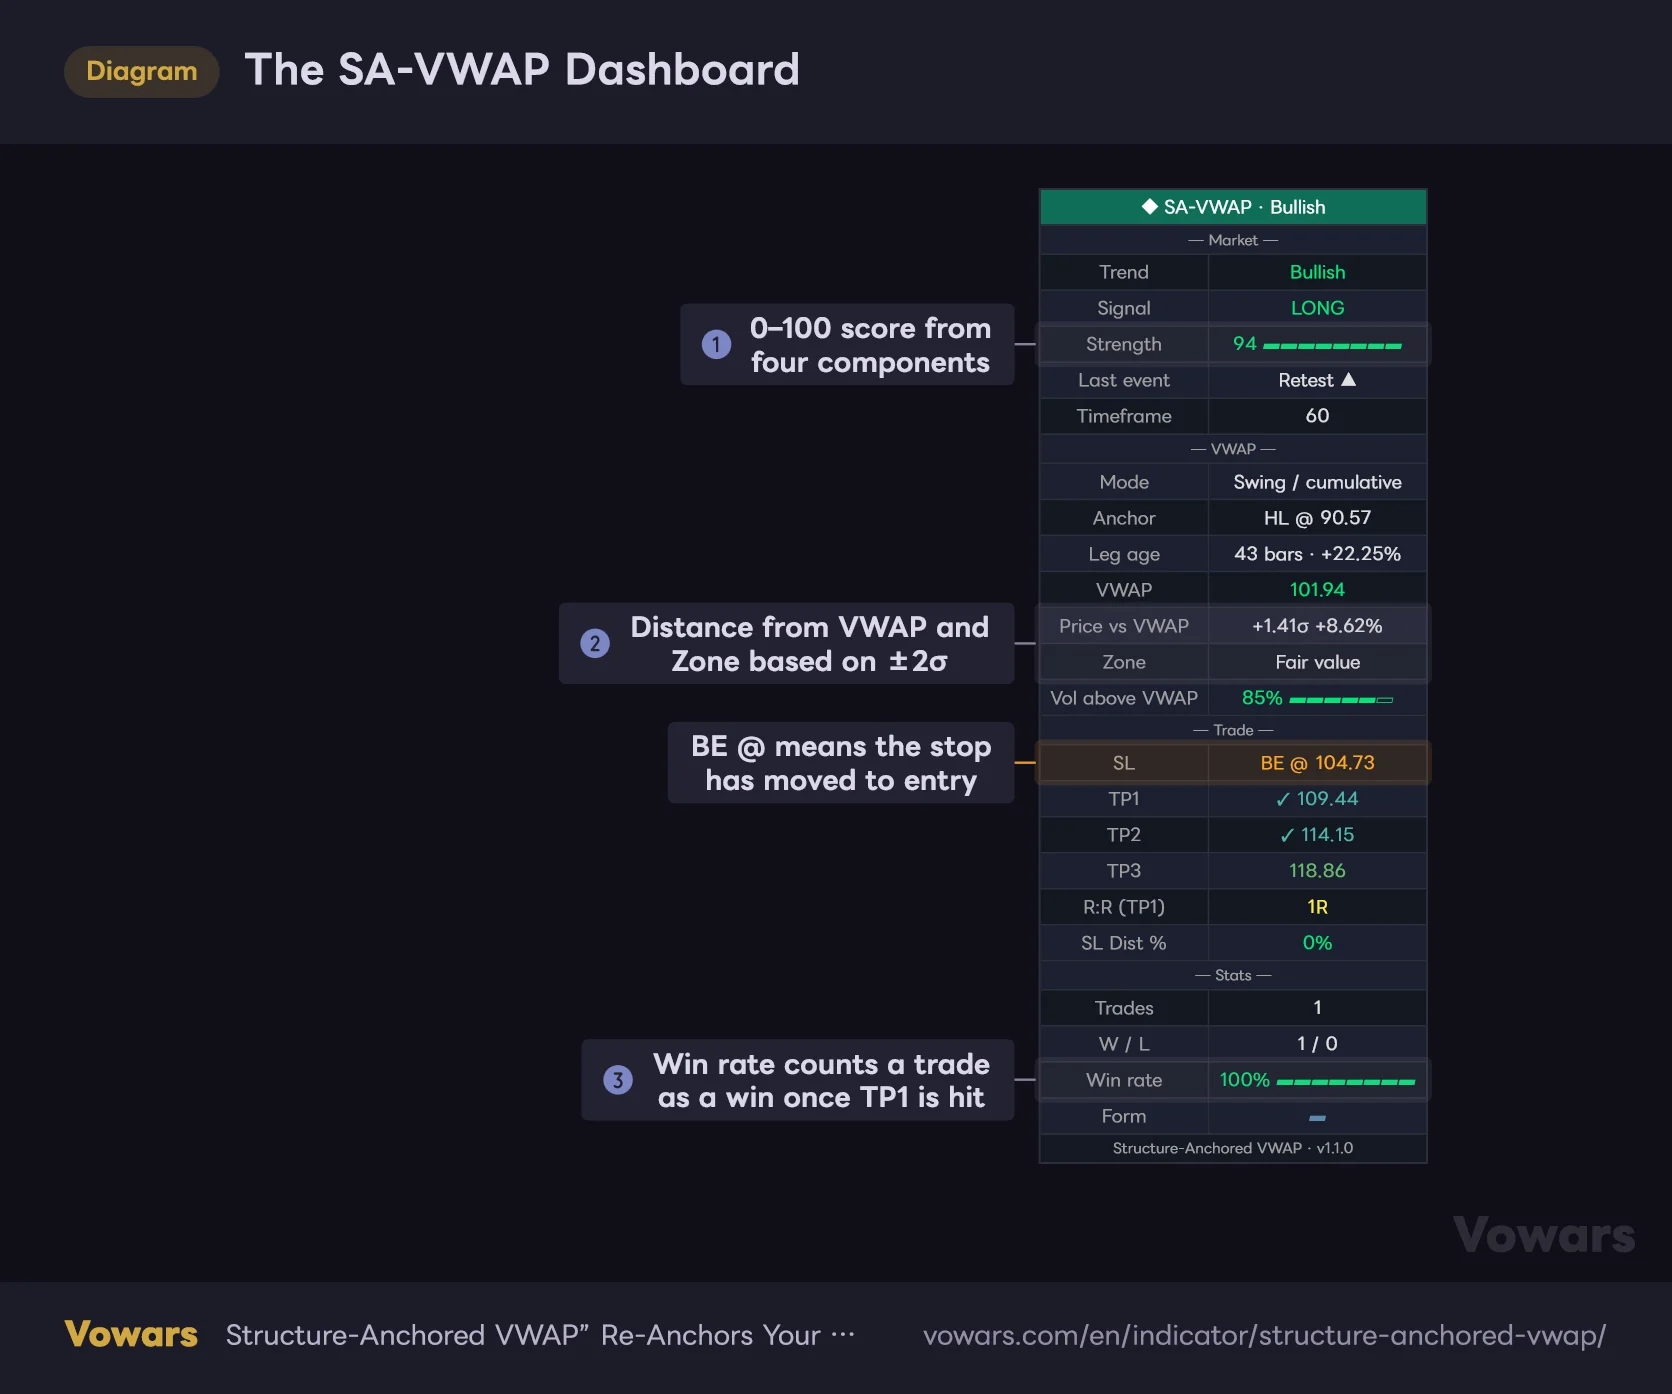
The SA-VWAP Dashboard
Leg status, open position and stats over the loaded history, all in one table.
Vowars DE ver.3.12.24
The table at the top right is split into four sections. There are a lot of rows, so here are the ones I check most often.
| Row | What It Shows |
|---|---|
| Trend | Direction of the current leg (Bullish / Bearish) |
| Signal | Position status: LONG / SHORT, or Wait when flat |
| Strength | 0–100 score: volume balance (40), price position vs. VWAP (25), inside ±2σ (20), leg already retested (15) |
| Anchor / Leg age | Anchor type and price, bars since the anchor and the move since then |
| Price vs VWAP | Distance from VWAP in σ and % |
| Zone | Premium above +2σ, Discount below −2σ, Fair value in between |
| Vol above VWAP | Share of the leg’s volume that traded on closes above the VWAP |
| SL / TP1–3 | Stop and target prices for the open trade. Reached TPs get a ✓, a stop moved to entry shows BE @ |
| Trades / W / L / Win rate | Number of closed trades and wins/losses over the loaded history |
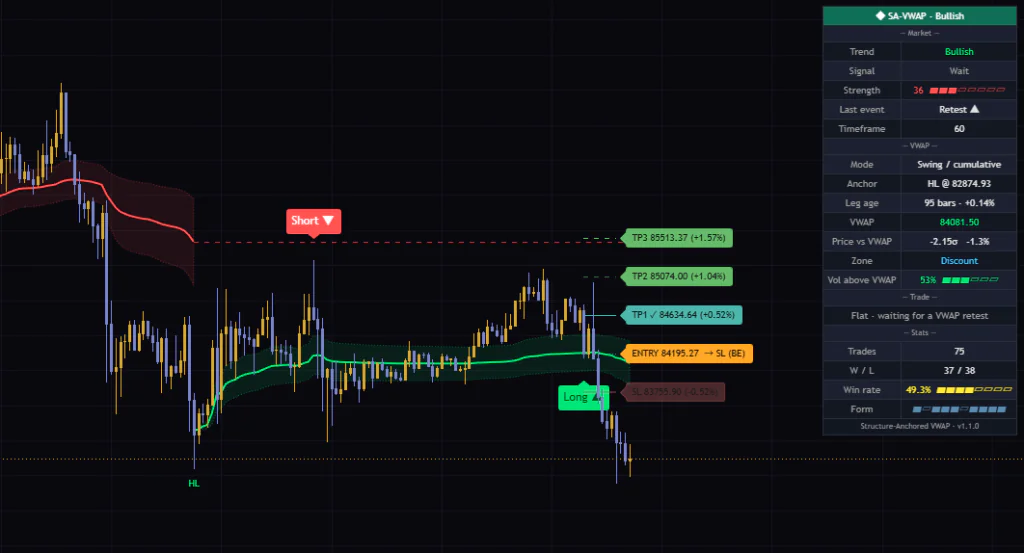
The Strength score in Figure ① is described by its developer as a context gauge, not an edge. I don’t use it as a reason to enter either. I just treat it as a quick read on whether the leg’s internals line up. The Zone in Figure ② is judged at ±2σ even when Band 2 is hidden. If you see Discount with no outer band on the chart and wonder why, this is the reason.
The Win rate in Figure ③ counts any trade that touched TP1 even once as a win. Even if price then comes back and stops you out at breakeven, it’s still a win. On the other hand, if the stop and TP1 are both hit on the same bar, it counts as a loss. Don’t judge it by the win rate alone.
On symbols with no volume data, the calculation falls back to time weighting and the Vol above VWAP row is renamed Bars above VWAP. The Mode row doesn’t change, so use this row name to tell whether volume is being used.
How a Long ▲ / Short ▼ Signal Is Triggered
The signal logic is simple: “In the direction of the leg, once price has moved away from the VWAP and then comes back to touch it, take the entry.” Think of it as a mechanical buy-the-dip / sell-the-rally rule using the VWAP. Let’s go through it step by step.
1A Swing Is Confirmed and the Leg Direction Is Set
The default for Re-anchor on is Swing, which starts a new leg every time a swing is confirmed. A confirmed high starts a down leg, and a confirmed low starts an up leg. Only Long ▲ signals are possible in up legs, and only Short ▼ signals in down legs.
2Price Moves Far Enough Away from the VWAP
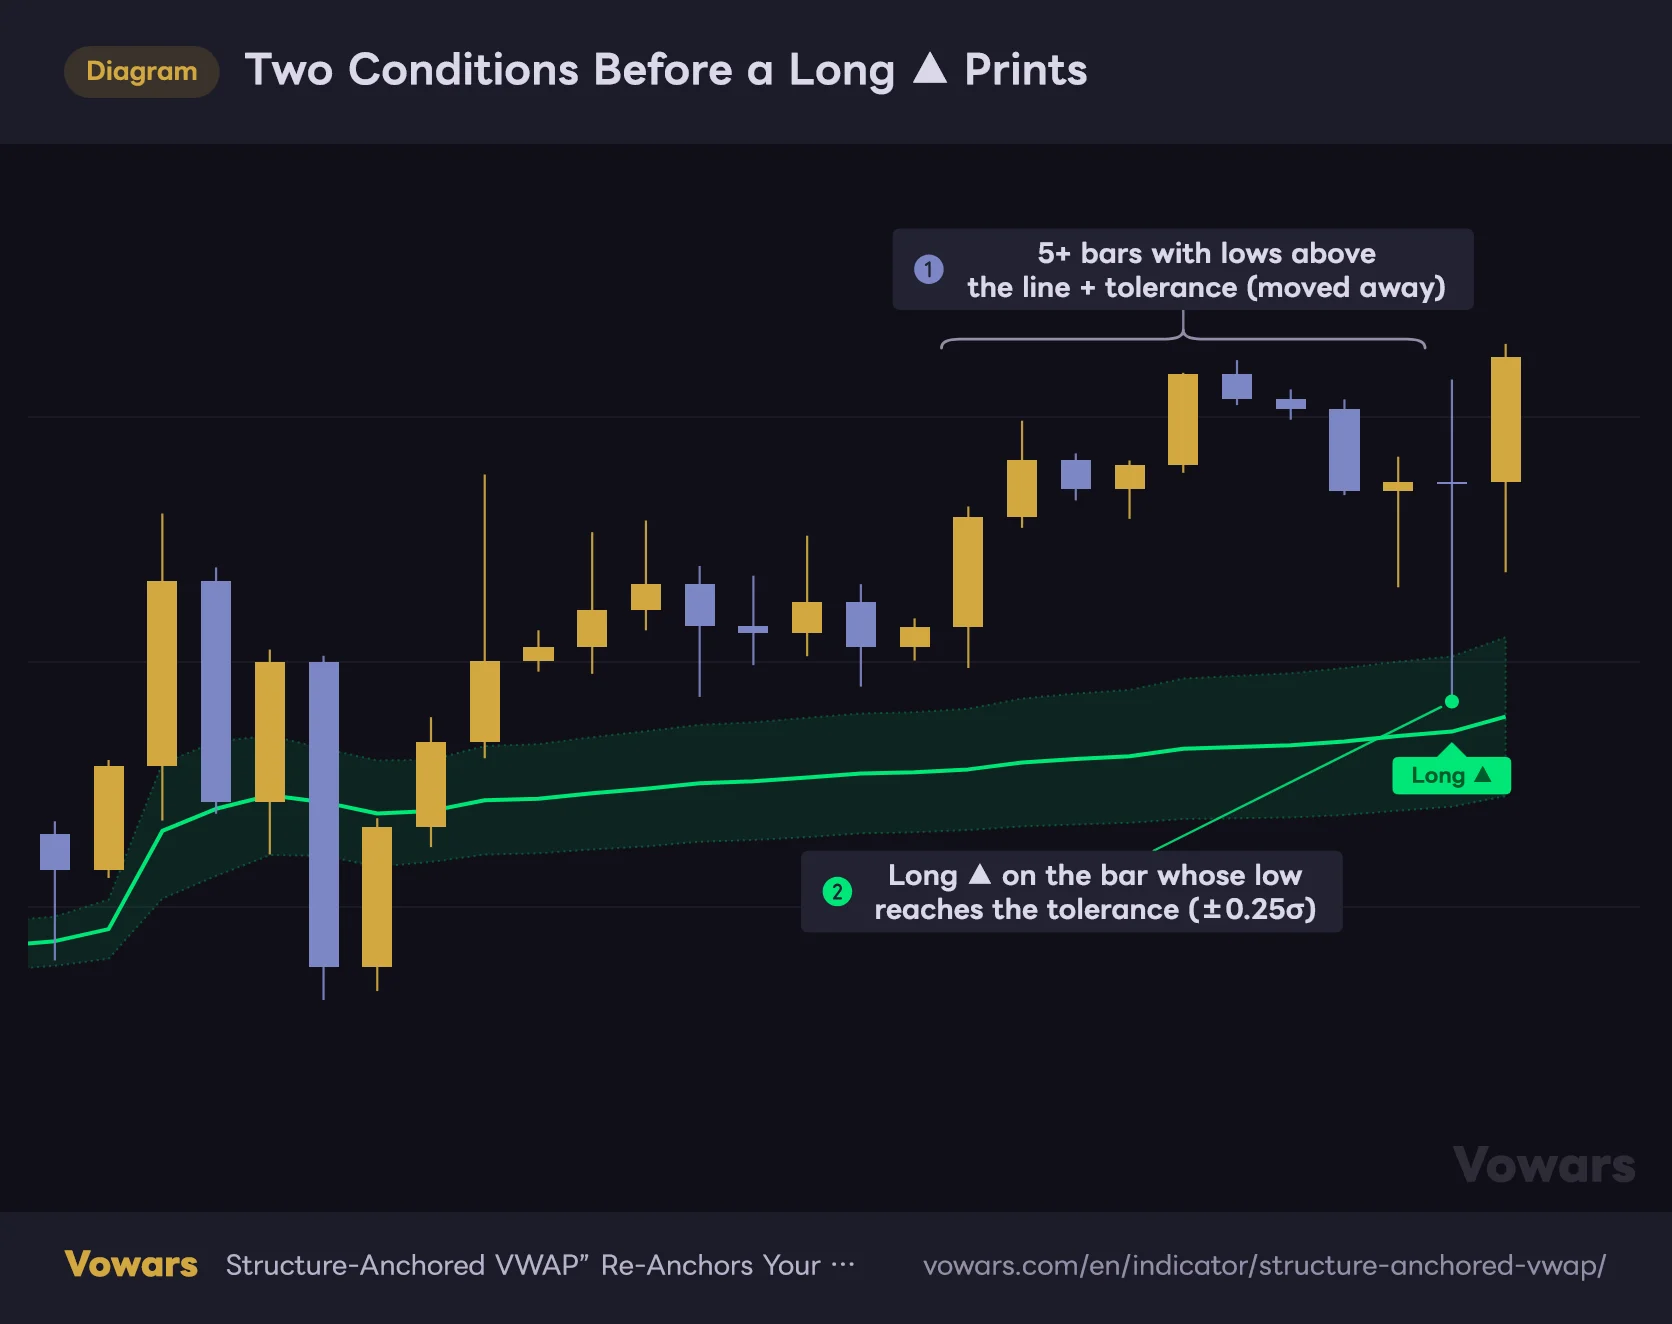
Two Conditions Before a Long ▲ Prints
A signal fires on the bar that comes back and touches the VWAP after price has moved away from it.
Vowars DE ver.3.12.24
In an up leg, the indicator counts bars whose low stays above “VWAP + tolerance.” As in Figure ①, once that lasts for at least Bars away before a retest counts (default 5 bars), it’s armed and waiting for a retest. The tolerance is set by Touch tolerance (x sigma), which defaults to 0.25σ.
3Entry Triggers When a Bar That Touches the VWAP Closes
As in Figure ②, when a bar whose low dips back into the tolerance zone closes, a Long ▲ prints. In a down leg, the same check runs on the high and you get a Short ▼. The check only runs once the bar has closed, so markers never appear and disappear on the forming bar.
Also, “Structure-Anchored VWAP” works on the assumption that only one position is open at a time. If another retest happens while a trade is open, no marker is printed. The dashboard’s Last event still logs it as a Retest, so the table and the chart can look like they disagree. One more thing: no signals appear for the first 110 bars of loaded history (the sum of Pivot strength left and right, or 50 if that sum is lower).
4Stop-Loss and Three Take-Profit Levels Are Locked In
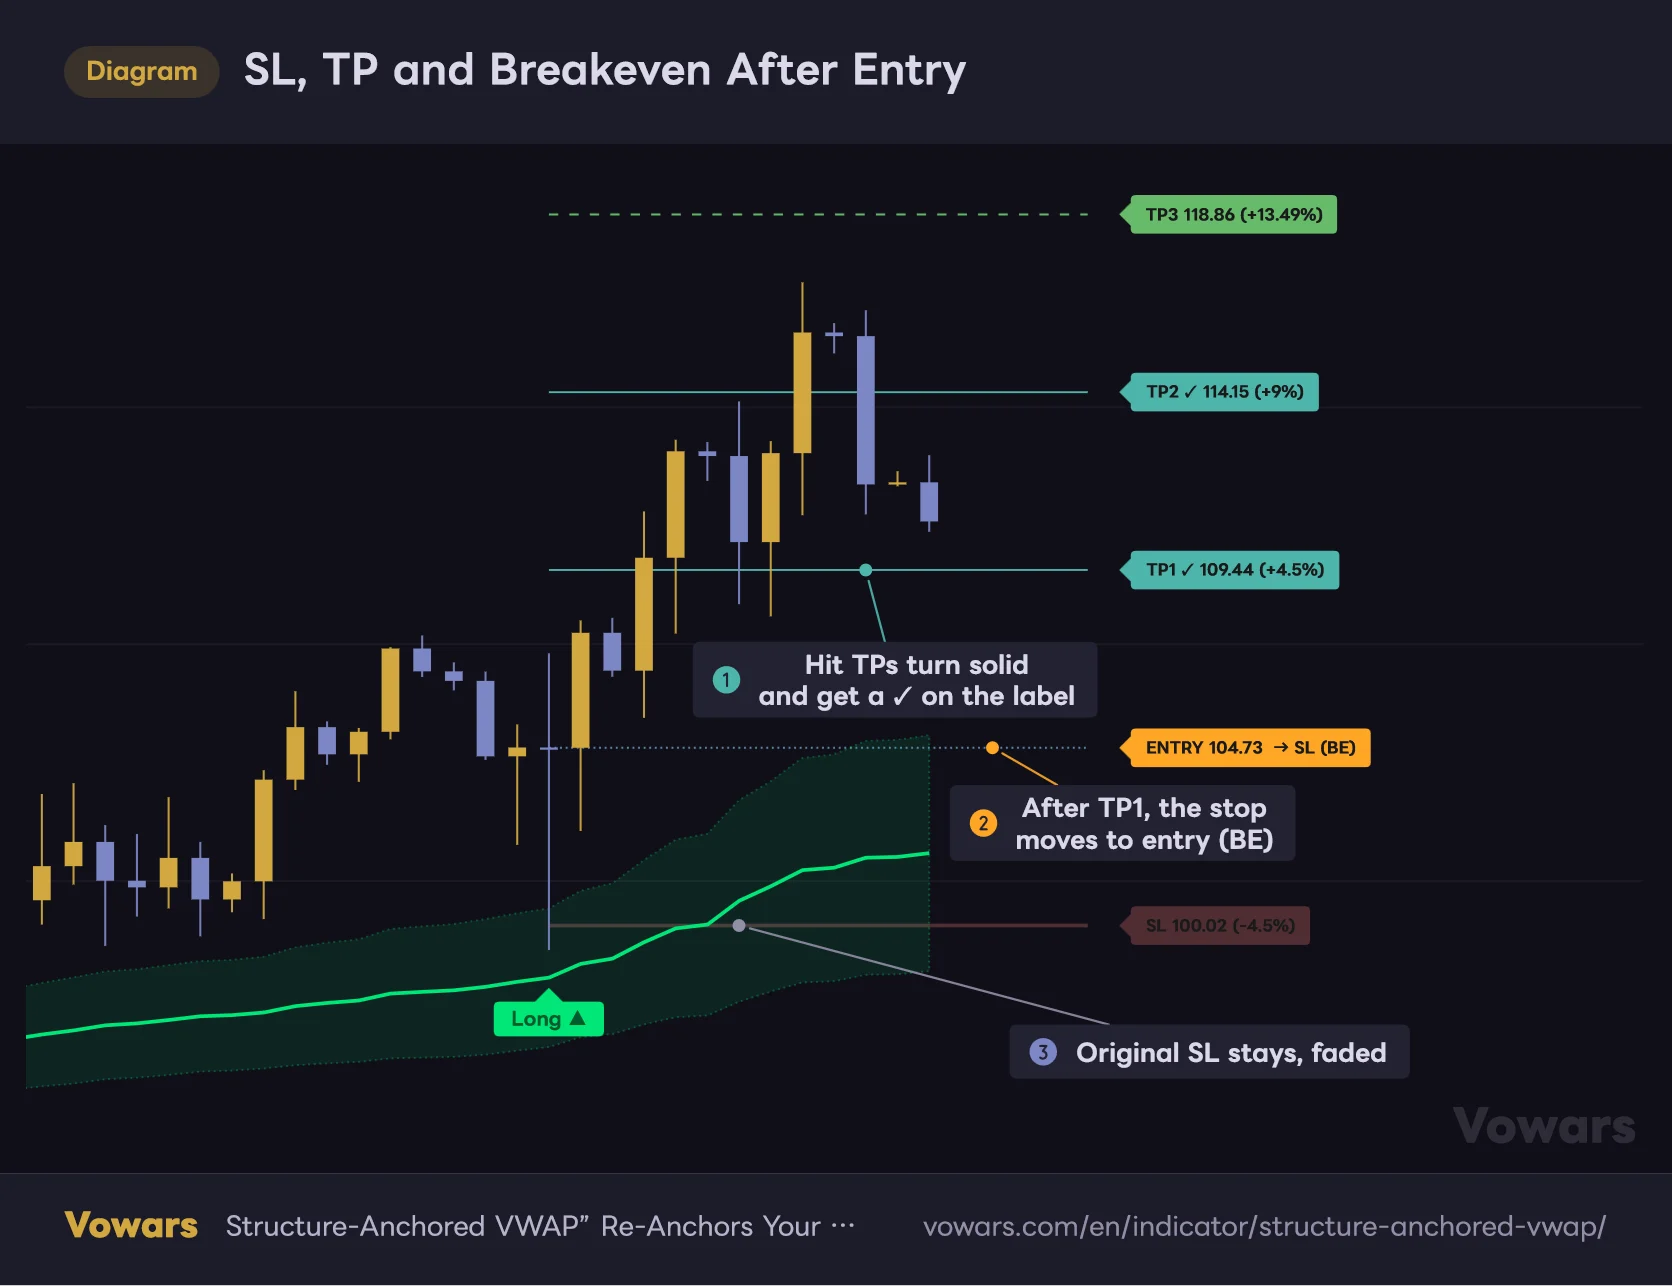
SL, TP and Breakeven After Entry
Based on the close of the Long ▲ bar, a stop-loss and three take-profit levels are locked in.
Vowars DE ver.3.12.24
Based on the close of the entry bar, the stop is placed at 1.5× ATR (ATR Length (SL), default 13), and the targets at 1×, 2× and 3× that distance. These are the values for the default Risk Preset, Balanced. Once set, the levels don’t move.
When TP1 is hit, the line turns solid and its label gets a ✓, as in Figure ①. With Break-Even After TP1 on (default), the ENTRY label turns orange and the stop moves to entry, as in Figure ②. The original SL line in Figure ③ stays on the chart in a faded color, but it’s no longer used. The trade ends when price hits TP3 or the stop (including the breakeven stop), and the lines stay on the chart until the next entry.
If the entry bar itself touches the stop or a target, it doesn’t count. Hits are only checked from the next bar onward, and only on bar close. Even if a wick pokes through and snaps back, it counts as a hit as long as the closed bar’s high or low reached the level.
The Biggest Gotcha: The VWAP Gets Redrawn Backward in Time
This is the single most important thing to understand about “Structure-Anchored VWAP.” I missed it at first too. Scrolling back through the daily chart, I caught myself thinking, “It’s firing Longs in the middle of a downtrend? That’s not very accurate.” It turned out I needed to understand how the display works before judging signal quality.
A swing is only confirmed once right bars have printed to its right. With the default, that’s 55 bars later. Until then, the chart keeps drawing the previous leg’s VWAP. Then, as soon as the high or low is confirmed, the previous leg is cut off at that anchor bar, and the new leg’s VWAP is redrawn all the way back to the anchor 55 bars ago.
What the Chart Shows Right Before the LH Is Confirmed
Until enough right-side bars print, the top is still just a high.
Vowars DE ver.3.12.24
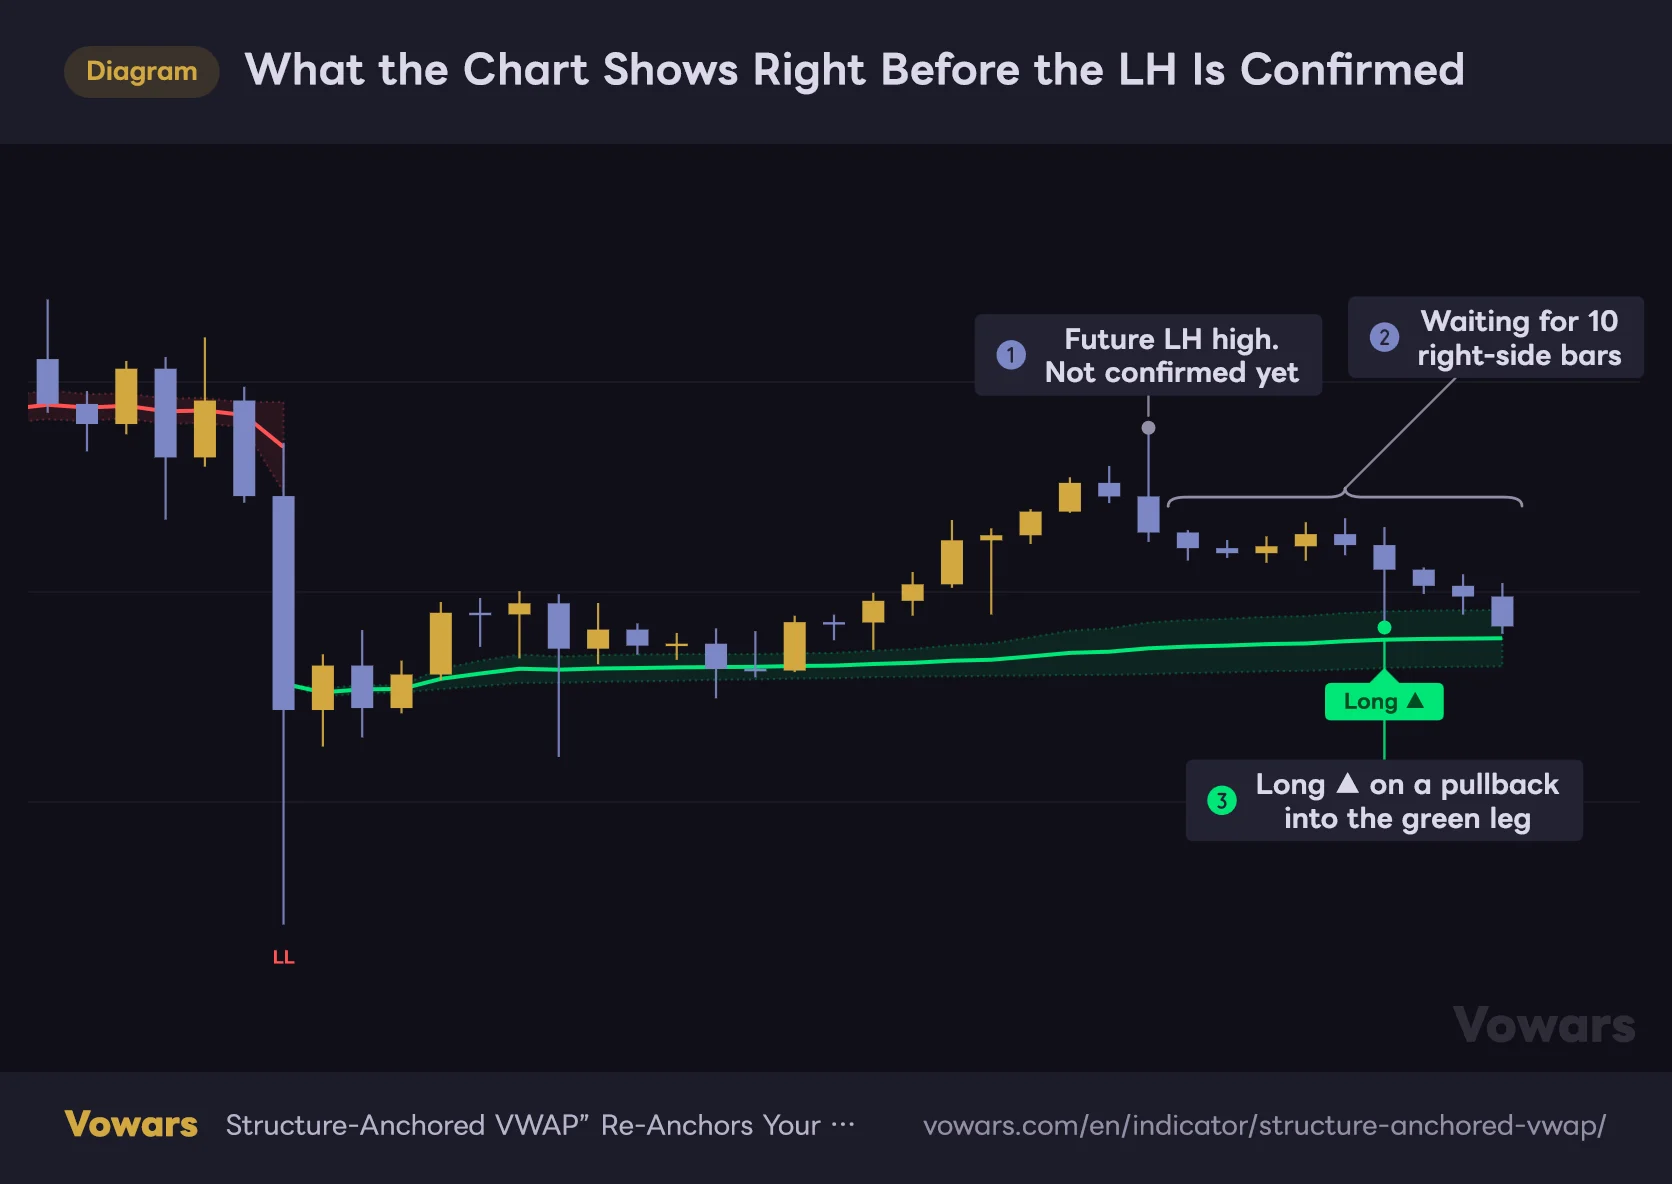
Above is the chart right before the LH is confirmed. The high in Figure ① is still just a high at this point, waiting for enough right-side bars, as in Figure ②. The chart still shows the green leg, so the pullback in Figure ③ prints a Long ▲. That’s a valid signal, exactly by the rules.
The Chart Redrawn Right After the LH Is Confirmed
The moment it’s confirmed, the red VWAP is drawn all the way back to the high 10 bars earlier.
Vowars DE ver.3.12.24
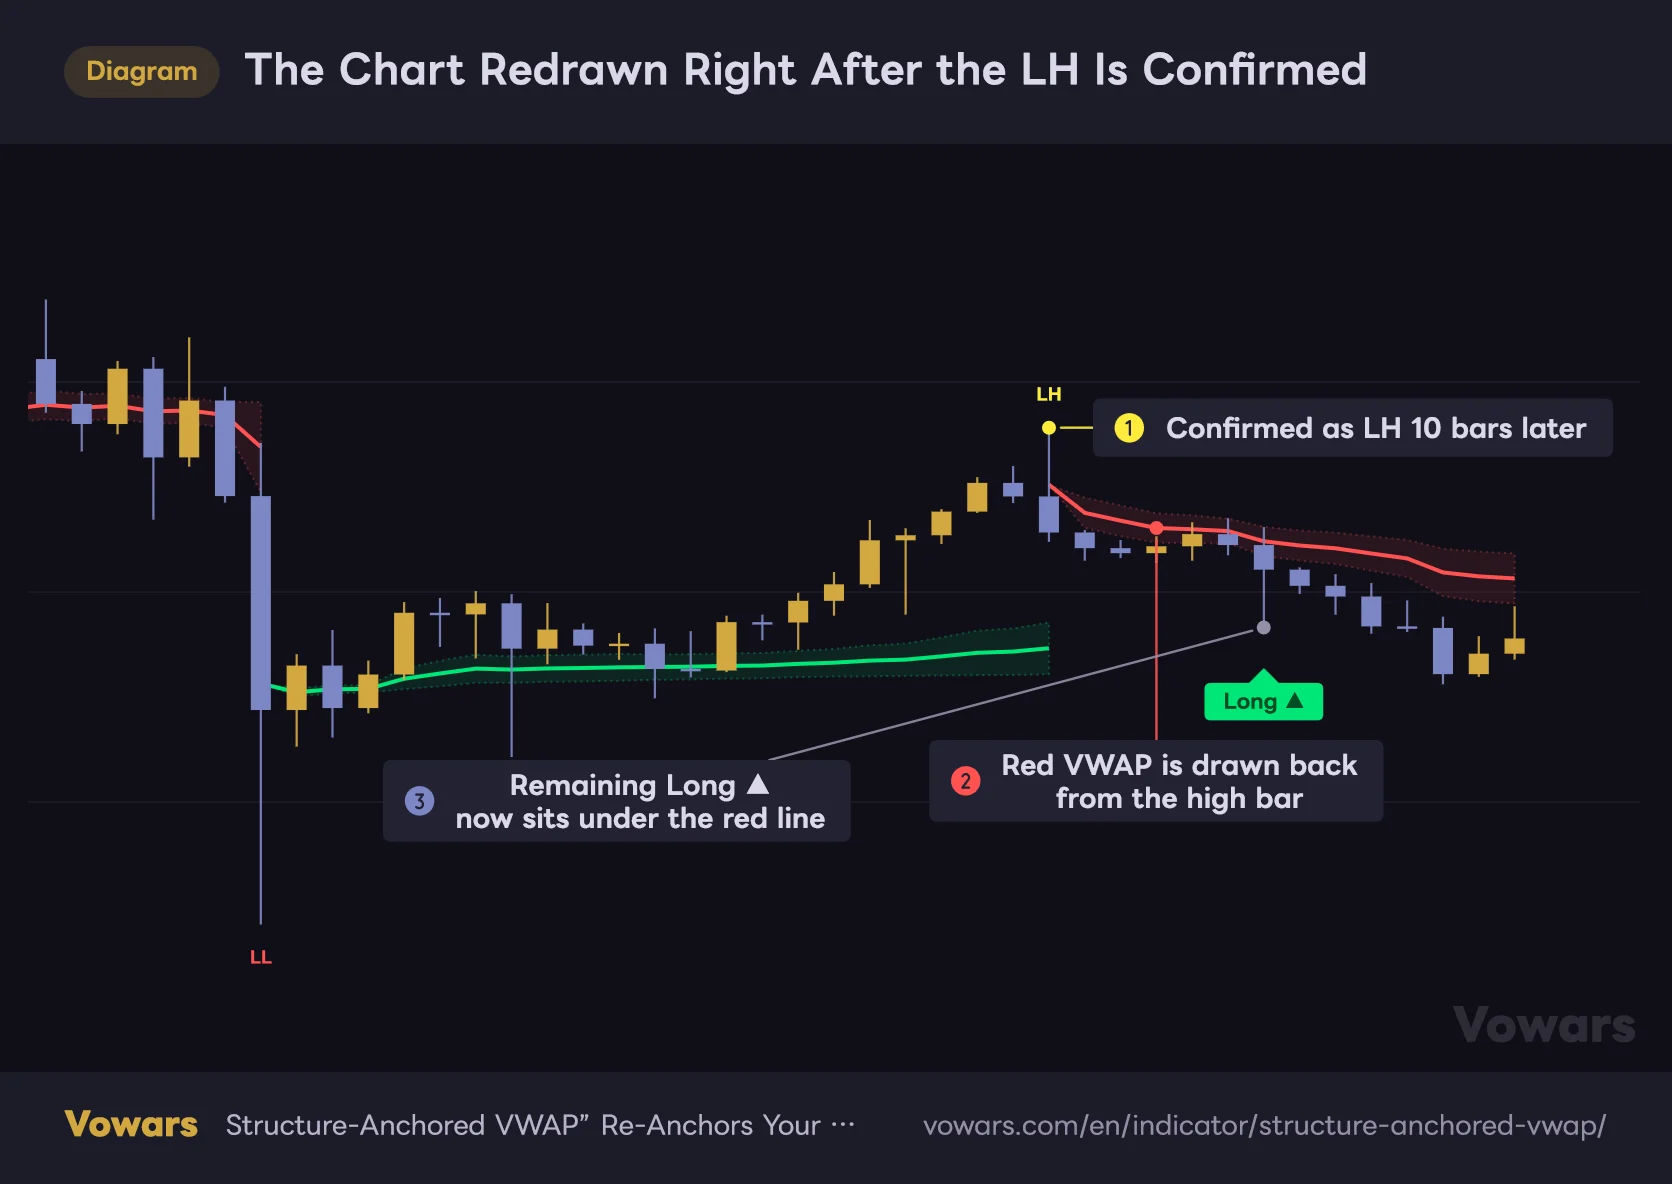
Move forward four candles and the picture changes. In Figure ① the high is confirmed as an LH, and the red VWAP is drawn starting from that high bar, as in Figure ②. The green line is cut off at the high bar, leaving only the Long ▲ in Figure ③ stranded under the red line. Looking back at the chart later, it looks like the indicator bought in the middle of a down leg, but at the time it fired, it was a pullback into a green leg.
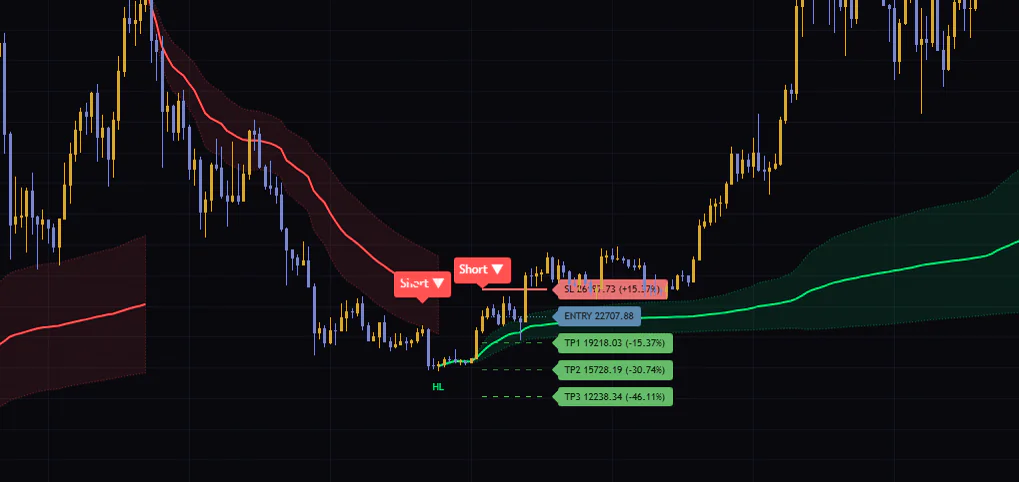
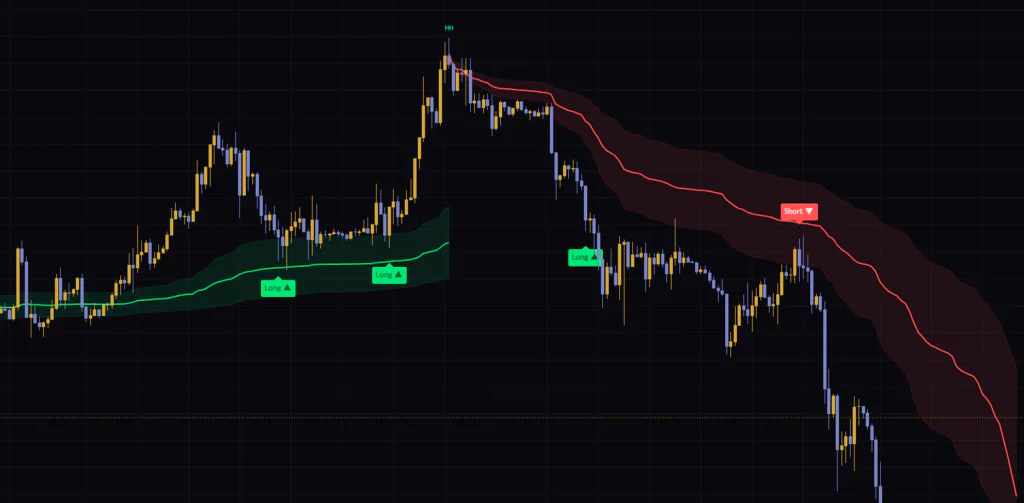
I saw the same thing on the Bitcoin weekly. Inside the green leg anchored at the 2022 low (labeled HL), two Short ▼ signals from the earlier red leg are sitting side by side. On the daily, too, there were Long ▲ signals left inside the red leg from February to March 2025.
What Changes and What Doesn’t
| Element | Changes After Confirmation? | Notes |
|---|---|---|
| Long ▲ / Short ▼ | No | Set on bar close and never removed later |
| SL / TP lines, alerts | No | Both checks and alerts happen on bar close |
| HH / HL / LH / LL labels | Added later | Placed on a past bar, delayed by the right-side bar count |
| VWAP curve and bands | Redrawn | When a new anchor is confirmed, the previous leg is cut at the anchor and the new leg is drawn from it |
| VWAP on the forming bar | Moves | Updates until the bar closes |
In short, the signals themselves never repaint. The color and position of the curve, however, do change retroactively. Keep in mind that if you backtest the relationship between signals and the VWAP by eye on historical charts, results can look worse, or better, than they really were.
Just scrolling back through the chart won’t show you what it looked like before confirmation. With TradingView’s Bar Replay, you can step forward bar by bar and watch the exact moment the anchor is confirmed and the VWAP gets redrawn. You do have to step through it manually, though, and how far back you can replay intraday timeframes depends on your plan and the timeframe (daily and above: full history on all plans, per TradingView’s official help as of Oct 1, 2026).
Four Anchor Modes: Trading Off Lag Against Fakeouts
Re-anchor on lets you choose when a new leg starts. If the redraw lag bothers you, this is the quickest setting to change.
| Mode | When the Leg Switches | Anchor | Best For |
|---|---|---|---|
| Swing (default) | When a swing high/low is confirmed | The confirmed swing | Riding bigger moves. Lag equals the right-side bar count |
| Structure break | When price closes beyond the previous swing (BOS) | The lowest low / highest high before the break | Fewer legs, only clear-cut reversals |
| Fast | When a new N-bar high/low prints on the opposite side from the last one | The previous extreme | Short-term trading that needs a reaction without waiting for confirmation |
| Manual | A date and time you set | The bar at that date and time | Drawing a single line, just like the built-in Anchored VWAP |
Fast reacts quicker since it doesn’t wait for confirmation, but if Fast mode: extreme lookback (bars) (default 30) is small, legs flip constantly. Even in Fast mode the anchor is the previous extreme, so the curve still gets drawn from a past bar. Structure break waits for a close beyond the swing, so in some cases it switches even later than Swing.
Manual gives you a single anchored VWAP with no automatic switching like the other modes. If you want to compare it with TradingView’s built-in Anchored VWAP drawing tool, switch to Manual, set the same date and time, match Price source to the source setting in the built-in tool, set Weighting to Cumulative, and turn off volume spike clamping.
Settings and How to Tune Them by Timeframe
The settings are split into nine groups, but the first four are the ones that really shape what you see. All defaults below match what’s shown in the settings dialog.
Main Settings (Leg Detection)
| Setting | Default | Suggested | Effect |
|---|---|---|---|
| Pivot strength left / right | 55 / 55 | Adjust to your timeframe | Bars on each side required for a swing. Right is also the confirmation delay |
| Minimum swing size (x ATR) | 1.5 | 1.5 | How many ATRs a new pivot must be from the last opposite swing to count. 0 turns it off |
| ATR Length | 13 | 10–20 | ATR period used for the filter above and the EQH/EQL check |
| Re-anchor on | Swing | Depends on use case | Swing / Structure break / Fast / Manual |
| Fast mode: extreme lookback (bars) | 30 | 20–50 | Lookback used to find extremes in Fast mode |
| Equal high/low tolerance (x ATR) | 0.1 | 0.05–0.25 | Labels EQH/EQL when within this distance |
| Manual anchor (date & time) | 2026-09-01 00:00 UTC | Any | Anchor for Manual mode. Shown in the chart’s time zone |
Anchored VWAP (Calculation)
| Setting | Default | Suggested | Effect |
|---|---|---|---|
| Price source | hl2 | hl2 | Price used in the VWAP. hlc3 gives the close more weight, close is the most reactive |
| Weighting | Cumulative | Cumulative | Half-life fades older bars, so it’s no longer a textbook VWAP |
| Half-life (bars) | 21 | Depends on use case | With Half-life, how many bars it takes for a bar’s weight to halve |
| Clamp volume spikes at / x median | On / 4.0 | On / 4.0 | Caps volume at 4× the 50-bar median so a single huge print can’t drag the line |
| Max leg length (bars) | 4000 | 4000 | Legs longer than this roll their anchor forward one bar at a time |
Deviation Bands / Signals & Levels (Bands and Signals)
| Setting | Default | Suggested | Effect |
|---|---|---|---|
| Band 1 / Sigma | On / 0.5 | On / 0.5 | Inner band. 0.5σ is a rough guide to the leg’s core price range |
| Band 2 / Sigma | Off / 2.0 | Turn on as needed | Outer band. Still used for the Zone even when hidden |
| Fill transparency | 90 | 90 | Transparency of the band fill |
| Bars away before a retest counts | 5 | 5–10 | Bars price must stay away before a retest counts |
| Touch tolerance (x sigma) | 0.25 | 0.25 | How close price must get to count as a VWAP touch |
| VWAP memory levels / Max memory levels | On / 4 | On / 4 | How many finished-leg VWAP levels to keep as dashed lines |
| Keep crossed levels (dotted) | Off | Personal preference | When on, touched levels stay as dotted lines |
Risk Management (Stops and Targets)
| Setting | Default | Suggested | Effect |
|---|---|---|---|
| Risk Preset | Balanced | Balanced | Conservative 2.5 / 1R, 2R, 4R; Balanced 1.5 / 1R, 2R, 3R; Aggressive 1.0 / 1.5R, 2.5R, 4R; Scalping 0.8 / 0.8R, 1.5R, 2R (SL ATR multiple / TP1–3) |
| ATR Length (SL) | 13 | 13–14 | ATR period used for the stop distance |
| SL ×ATR (Custom), etc. | 1.5 / 1.0 / 2.0 / 3.0 | Only with Custom | Multipliers used when Risk Preset is set to Custom |
| Break-Even After TP1 | On | On | Moves the stop to entry once TP1 is hit |
The Visual, Dashboard, Alerts and Colors groups let you toggle labels and the table, set the table position, choose alert types and change colors. If the chart feels cluttered, trim the sections under Show Dashboard or reduce Finished legs kept on chart (default 30).
Suggested Settings by Timeframe
The main knobs to tune are Pivot strength left and right. The right value is the confirmation delay in bars, so converting it into time on your timeframe makes the choice easier. At the default of 55 bars, that’s about 4.5 hours on the 5m, about 2 days and 7 hours on the 1H, and 55 days on the daily.
| Timeframe | Left / Right | Why |
|---|---|---|
| 1m–5m | 5 / 5 to 10 / 10 | At 55, the lag is several hours, which is too slow for day trading decisions |
| 15m–1H | Around 20 / 20 | Keeps the lag to roughly half a day to a day and catches intraday swings |
| 4H–Daily | 55 / 55 (default) | Keeps only the big multi-week moves and lets legs run longer |
These ranges follow the same idea as the tooltip on right, which suggests “5/5 for scalping, 20/20 for intraday, 55/55 for large swings,” and they held up in my own testing. Lower values mean more legs and more Long ▲ / Short ▼ signals. If you start getting too many fakeouts, raise Minimum swing size (x ATR) to 2.0–3.0 or increase Bars away before a retest counts to thin them out.
Testing It on Four Bitcoin Timeframes
I loaded it with default settings on the Bitcoin weekly, daily, 1H and 5m charts and read the stats from the dashboard (figures reflect the history loaded as of Sept 28, 2026).
| Timeframe | Trades | W / L | Win rate |
|---|---|---|---|
| Weekly | 2 | 1 / 1 | 50% |
| Daily | 39 | 21 / 18 | About 53.8% (calculated from W / L because part of the display was hidden) |
| 1H | 75 | 37 / 38 | 49.3% |
| 5m | 69 | 35 / 34 | 50.7% |
Every timeframe came in at roughly 50%. As mentioned earlier, a “win” here only means TP1 was touched. In other words, about half the trades hit the stop before price moved 1R in their favor. If you just take every signal from this indicator on its own, it’s not something you can count on to win hands-down.
That said, these stats reset when you reload the chart or change a setting, and they’re not a backtest. If you want to test it in the Strategy Tester, you’ll need to build the trading rules as a separate strategy.
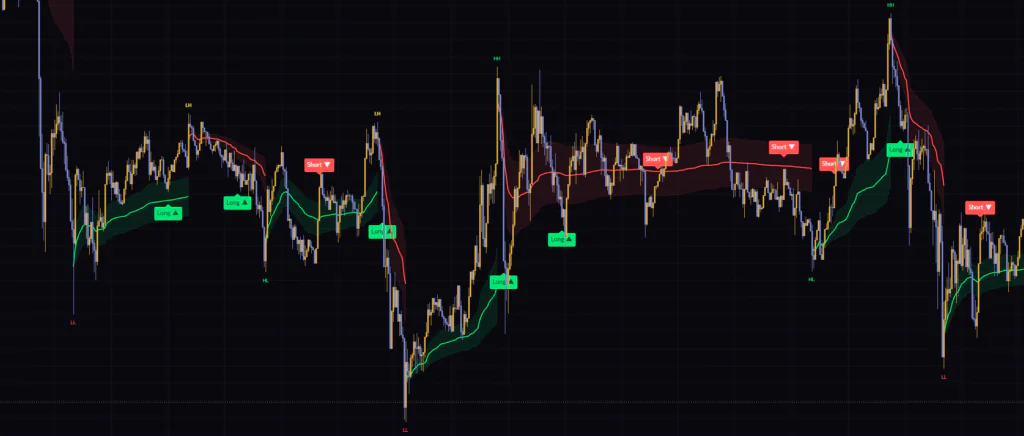
On the 5m chart, the legs flipped quickly in directionless chop and the signals alternated back and forth. The default 55/55 is too long for the 5m, but shortening it gives you even more signals in this kind of chop. On the 5m, I don’t use it on its own. I always check it against the leg direction on a higher timeframe.
Where It Shines and Where It Struggles
Where It Helps
- Re-anchors the VWAP at every swing, so you never have to move the anchor by hand
- Bands are calculated from the leg’s own volume, so “is this move overextended?” is easy to compare across different symbols
- In clear trends, pullback and rally levels are easy to spot
- Entry, stop and targets are shown as a set, and everything is judged on closed bars only
- Memory levels keep past moves’ average cost on the chart as key levels
What to Watch Out For
- The previous leg keeps running until the new anchor is confirmed, and then the VWAP is redrawn backward
- On historical charts, some signals look out of sync with the curve color
- In choppy markets, legs flip quickly, signals multiply and so do fakeouts
- Win rate counts a trade as a win once TP1 is touched, so it tends to look better than actual P&L
- Lots of elements on screen, so the chart gets crowded with default settings
It does best in markets trending in one direction on the daily or 4H. When pullbacks tend to stall near the leg’s VWAP, you can see at a glance where the Long ▲ is and where the stop goes. On instruments with reliable volume, like gold futures, the volume weighting actually means something too.
It struggles in markets where highs and lows keep stepping up and down in short bursts. By the time a swing is confirmed, price has often already turned the other way, and you end up with late retest signals from the previous leg.
Use DMI to Confirm Direction and Cover the Confirmation Lag
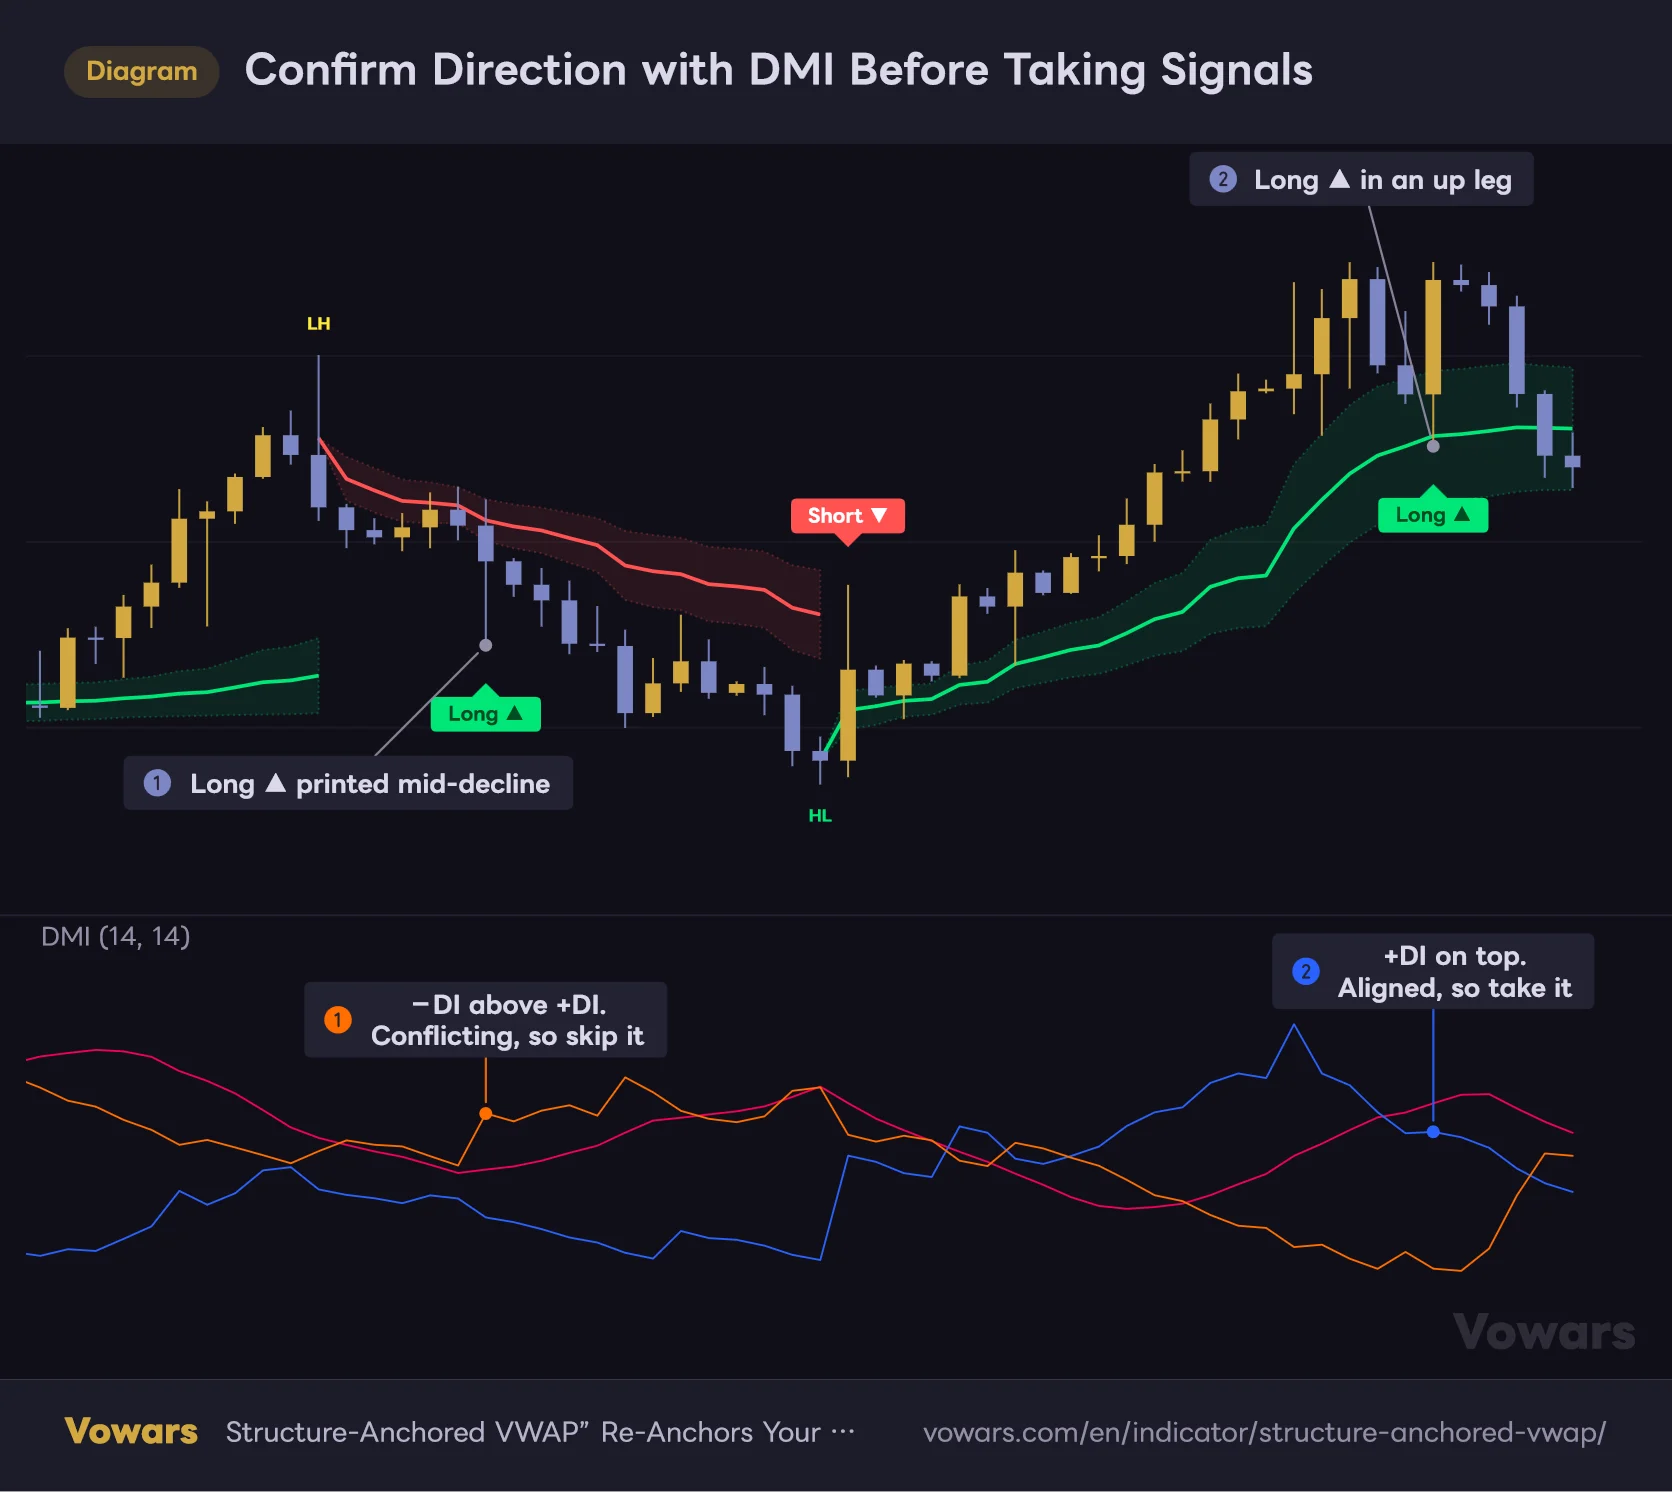
So how do you handle signals that fire while the previous leg is still active? The best pairing I found was TradingView’s built-in DMI (Directional Movement Index). +DI and −DI are calculated from how much recent highs and lows are being extended, so they show a change in direction without waiting for a swing to be confirmed.
Confirm Direction with DMI Before Taking Signals
Use the relationship between +DI and −DI to cover the lag in leg switching.
Vowars DE ver.3.12.24
The Long ▲ in Figure ① fired by the rules, as a pullback into the green leg. But on the DMI below, −DI (orange) was above +DI (blue), so the short-term direction had already turned down. Signals with conflicting direction like this get skipped. For the Long ▲ in Figure ②, +DI is on top and agrees with the leg direction, so that one gets taken.
- Only take Long ▲ when +DI is above −DI
- Only take Short ▼ when −DI is above +DI
- When ADX is low and flat, treat it as a market where legs flip easily and stay on the sidelines
That said, as with the Short ▼ in the middle of the figure, there are still cases where DMI agrees but a low is confirmed right after and the leg flips. DMI is a filter for cutting out signals that are clearly against the current direction. It won’t eliminate every fakeout.
One Alert Covers Everything, and the Settings Decide What You Get
To get notifications from “Structure-Anchored VWAP,” open TradingView’s Create Alert dialog, select this indicator as the condition, and choose “Any alert() function call” (per TradingView’s official help). Which notifications you receive is controlled in the Alerts group of the indicator settings, not in the alert dialog.
| Alert Type | Default | Setting That Controls It |
|---|---|---|
| Long / Short entry (with price, VWAP, SL, TP1–3 and R:R) | On | None (always sent) |
| Stop hit (shown as BE STOP-OUT when closed at breakeven) | On | Alert on SL Hit |
| TP1–3 hit, stop moved to breakeven | Off | Alert on TP / Break-Even |
| New leg started, close across the VWAP | Off | Alert on New Leg / VWAP Cross |
Every alert fires once, on bar close. Turning on Webhook JSON Format sends entry alerts as JSON, which makes them easy to pass to an external auto-trading service. Alerts keep running with the settings they were created with, so after changing any settings, delete the alert and create it again.
Read It as a Map of Each Move’s Average Cost, and It Becomes Hard to Trade Without
At the core of “Structure-Anchored VWAP” is an anchored VWAP that re-anchors itself at every swing. It shows where the average cost of traders in the current move sits and how far price has stretched from it, measured in a common yardstick, σ. If you’ve been re-drawing anchored VWAPs by hand, you’ll appreciate this part the most.
 Image
ImageOn the other hand, Long ▲ / Short ▼ and the Win rate only make sense once you understand how the display works. Anchor confirmation lags by the right bar count, and once it’s confirmed, the VWAP gets redrawn backward. A signal can be correct at the moment it fires and still end up surrounded by the opposite-colored curve when you look back later.
First, lower Pivot strength left and right to fit your timeframe. Second, check its behavior with Bar Replay rather than by how historical charts look. Third, confirm direction with something like DMI before acting on a signal. Stick to these three and you’ll avoid most of the ways people misread “Structure-Anchored VWAP.”
Personally, what clicked best for me was checking the leg and VWAP on a higher timeframe first, then waiting for a retest on a lower one. Rather than chasing every signal, “Structure-Anchored VWAP” really comes into its own when you keep it on the chart as a map of which move you’re in and where you are within it.