

FVG Sniper grades price imbalances and turns them into a full trade plan
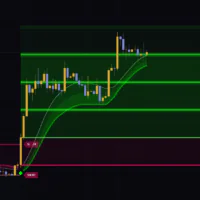
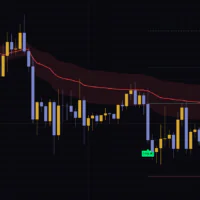
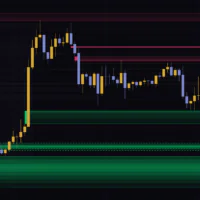
What it tracks is the FVG (Fair Value Gap). When price moves fast, three candles can leave behind a price range where no trading happened at all. That empty range is the FVG, and in Smart Money Concepts it’s treated as an area price likes to come back and fill. FVG Sniper boxes these gaps automatically, grades them from 0 to 10, tracks how much of each one has been filled, and once the conditions line up, it drops a BUY/SELL signal together with the entry, stop, and three take-profit levels in one go.
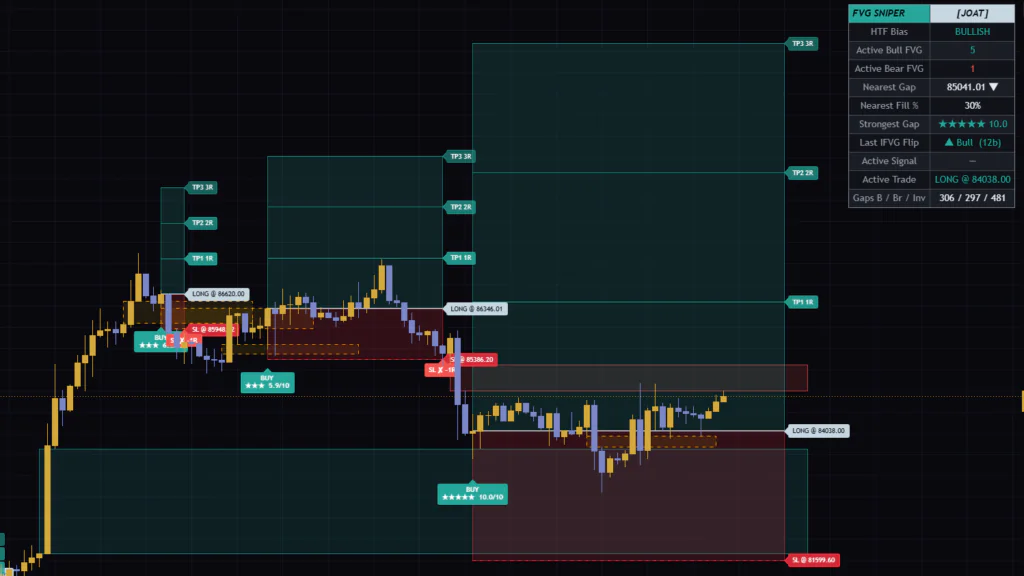
I ran it on the Bitcoin daily, 4H, and 30m charts and watched it alongside price action for a while. My first impression: this is less an FVG display tool and more a tool that auto-draws trade plans built on FVGs. Plenty of FVG indicators just draw boxes, but not many of them bundle grading, fill tracking, and trade-plan drawing into one package. That said, I also ran into a few design choices, like how wins and losses get recorded, that are easy to misread if nobody tells you about them. This review covers all of that, so you have what you need to decide whether it belongs on your chart.
Here’s a quick map of what shows up on the chart first. Once the colors and shapes click, the amount of information on screen won’t slow you down.
| On the chart | What it means |
|---|---|
| Green box / red box | Bullish FVG / bearish FVG |
| Amber dashed box | An FVG that got closed through and flipped roles (IFVG) |
| BUY / SELL label | The signal and the grade of the box behind it (stars and score) |
| Thick white line, red dashed line, thin green lines | Entry, stop loss, TP1–TP3 |
| Green zone and red zone | Reward side and risk side of the trade |
| ★ label on the right edge | The single highest-graded box still in play |
| TP ✔ / SL ✘ / EXIT labels | Trade outcome in R |
| Top-right panel | Summary of HTF bias, nearest box, latest flip, and more |
Only gaps left by strong displacement candles become boxes
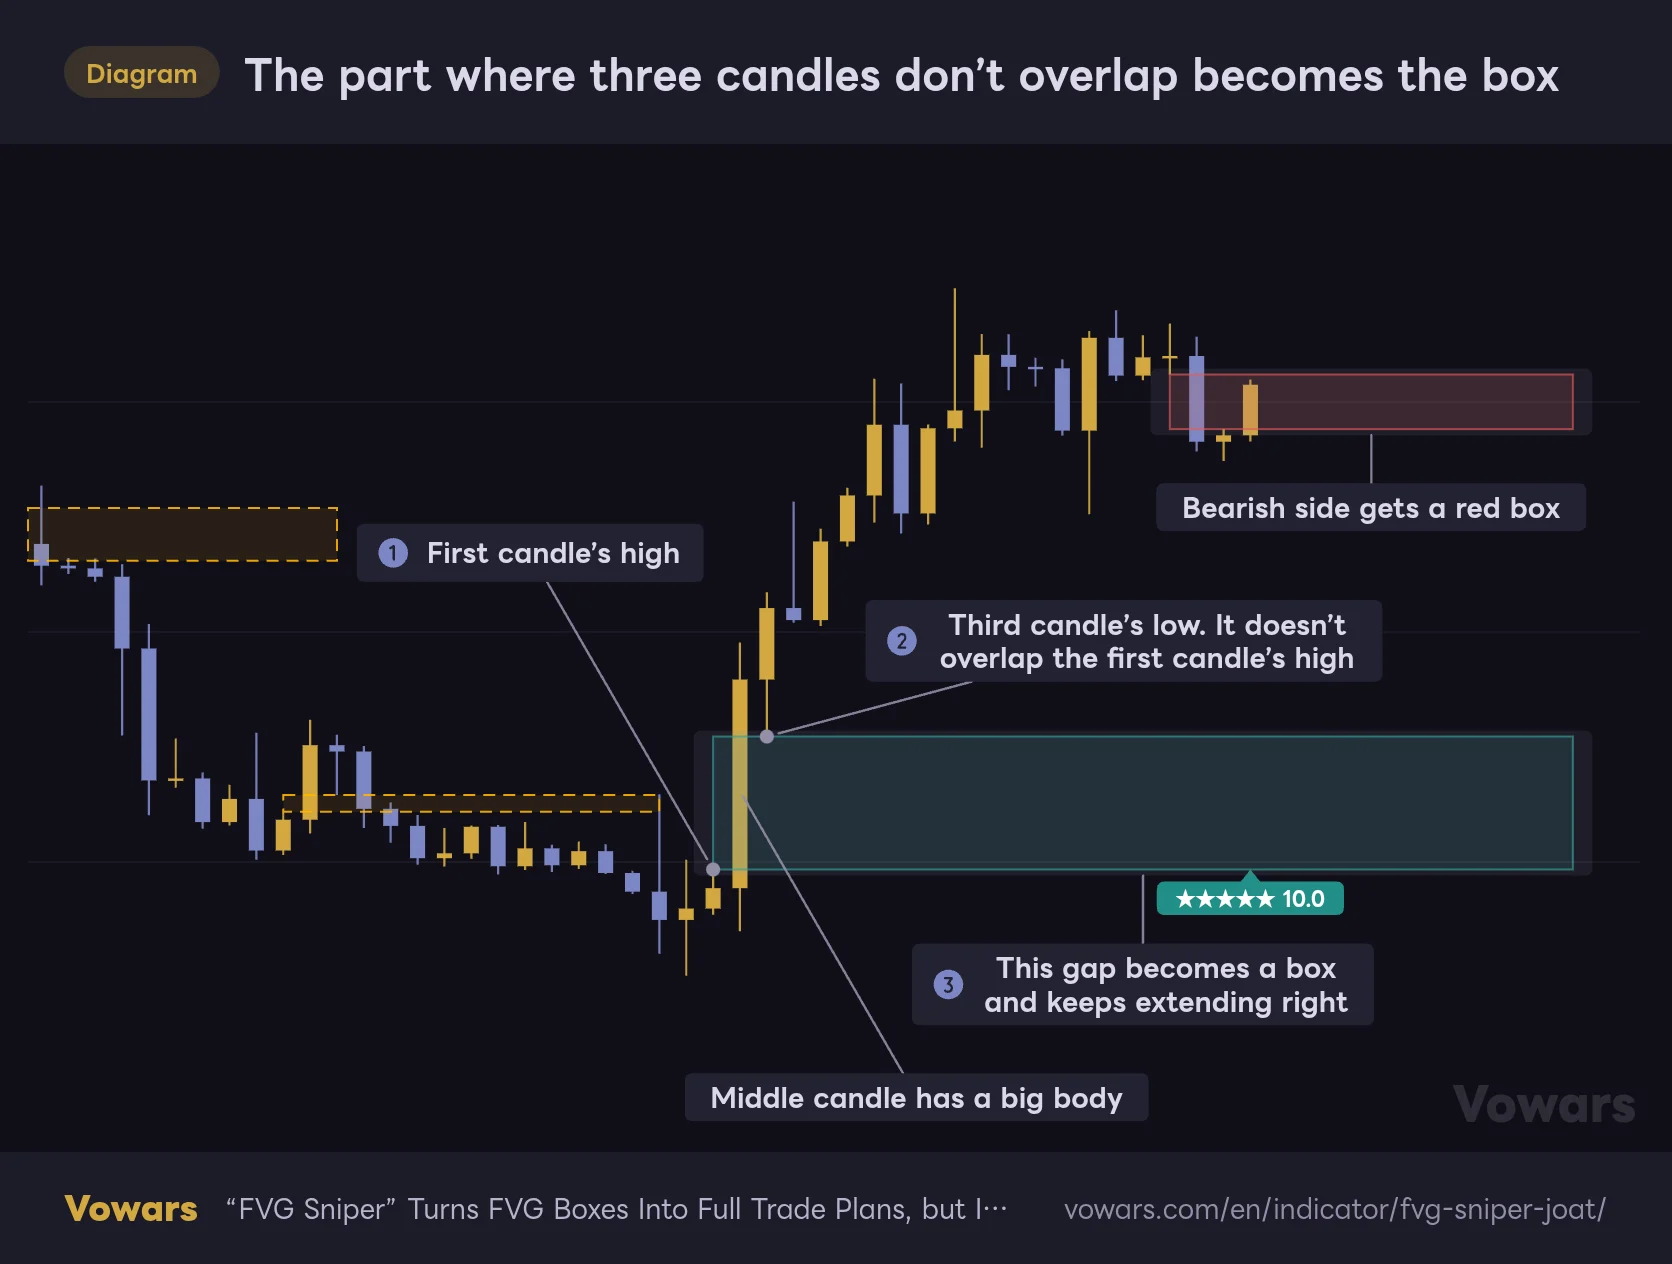
A bullish FVG forms when the third candle’s low sits above the first candle’s high. The range between the first candle’s high and the third candle’s low is where nobody traded. A bearish FVG is the mirror image: the third candle’s high sits below the first candle’s low.
The part where three candles don’t overlap becomes the box
When the first candle’s high and the third candle’s low don’t overlap, the range between them is boxed as an FVG.
Vowars DE ver.3.11.2
That said, not every gap turns into a box. FVG Sniper runs each candidate through two filters.
- The gap has to be at least 0.25x ATR (roughly the average range of one candle on that symbol) tall (Min Gap Size (× ATR))
- The middle candle’s body has to take up at least 45% of its high-to-low range (Min Displacement Body Ratio)
The second filter is the one doing the heavy lifting. Gaps that happen to appear around wick-heavy candles are ignored, and only gaps left behind by big-bodied candles that moved in one shot get boxed. Since the display is also capped at 14 boxes, even the 30m chart never got buried in boxes. I appreciated that.
A box is drawn when the third candle closes. Boxes don’t pop in and out on a forming candle. Each box starts at the first candle and, until it’s fully filled, keeps extending 12 bars past the latest candle. You can change that length with Gap Box Extension (bars).
The 0–10 grade, and why only one box gets a star
Each box’s grade adds up three components on a 10-point scale. Here’s the weighting.
| Component | What it measures | Weight | Maxes out when |
|---|---|---|---|
| Gap size | Gap height ÷ ATR | 40% | 1x ATR or more |
| Middle-candle displacement | Middle candle range (high to low) ÷ ATR | 35% | 2x ATR or more |
| Volume | Middle candle volume ÷ 20-bar average | 25% | 2x average or more |
For example, if the gap is half an ATR tall, the middle candle’s range equals one ATR, and volume is right at average, each component scores half, for a total of 5.0. The star count comes straight from the score: 9+ gets five stars, 7+ gets four, 5+ gets three, 3+ gets two, and anything below that gets one.
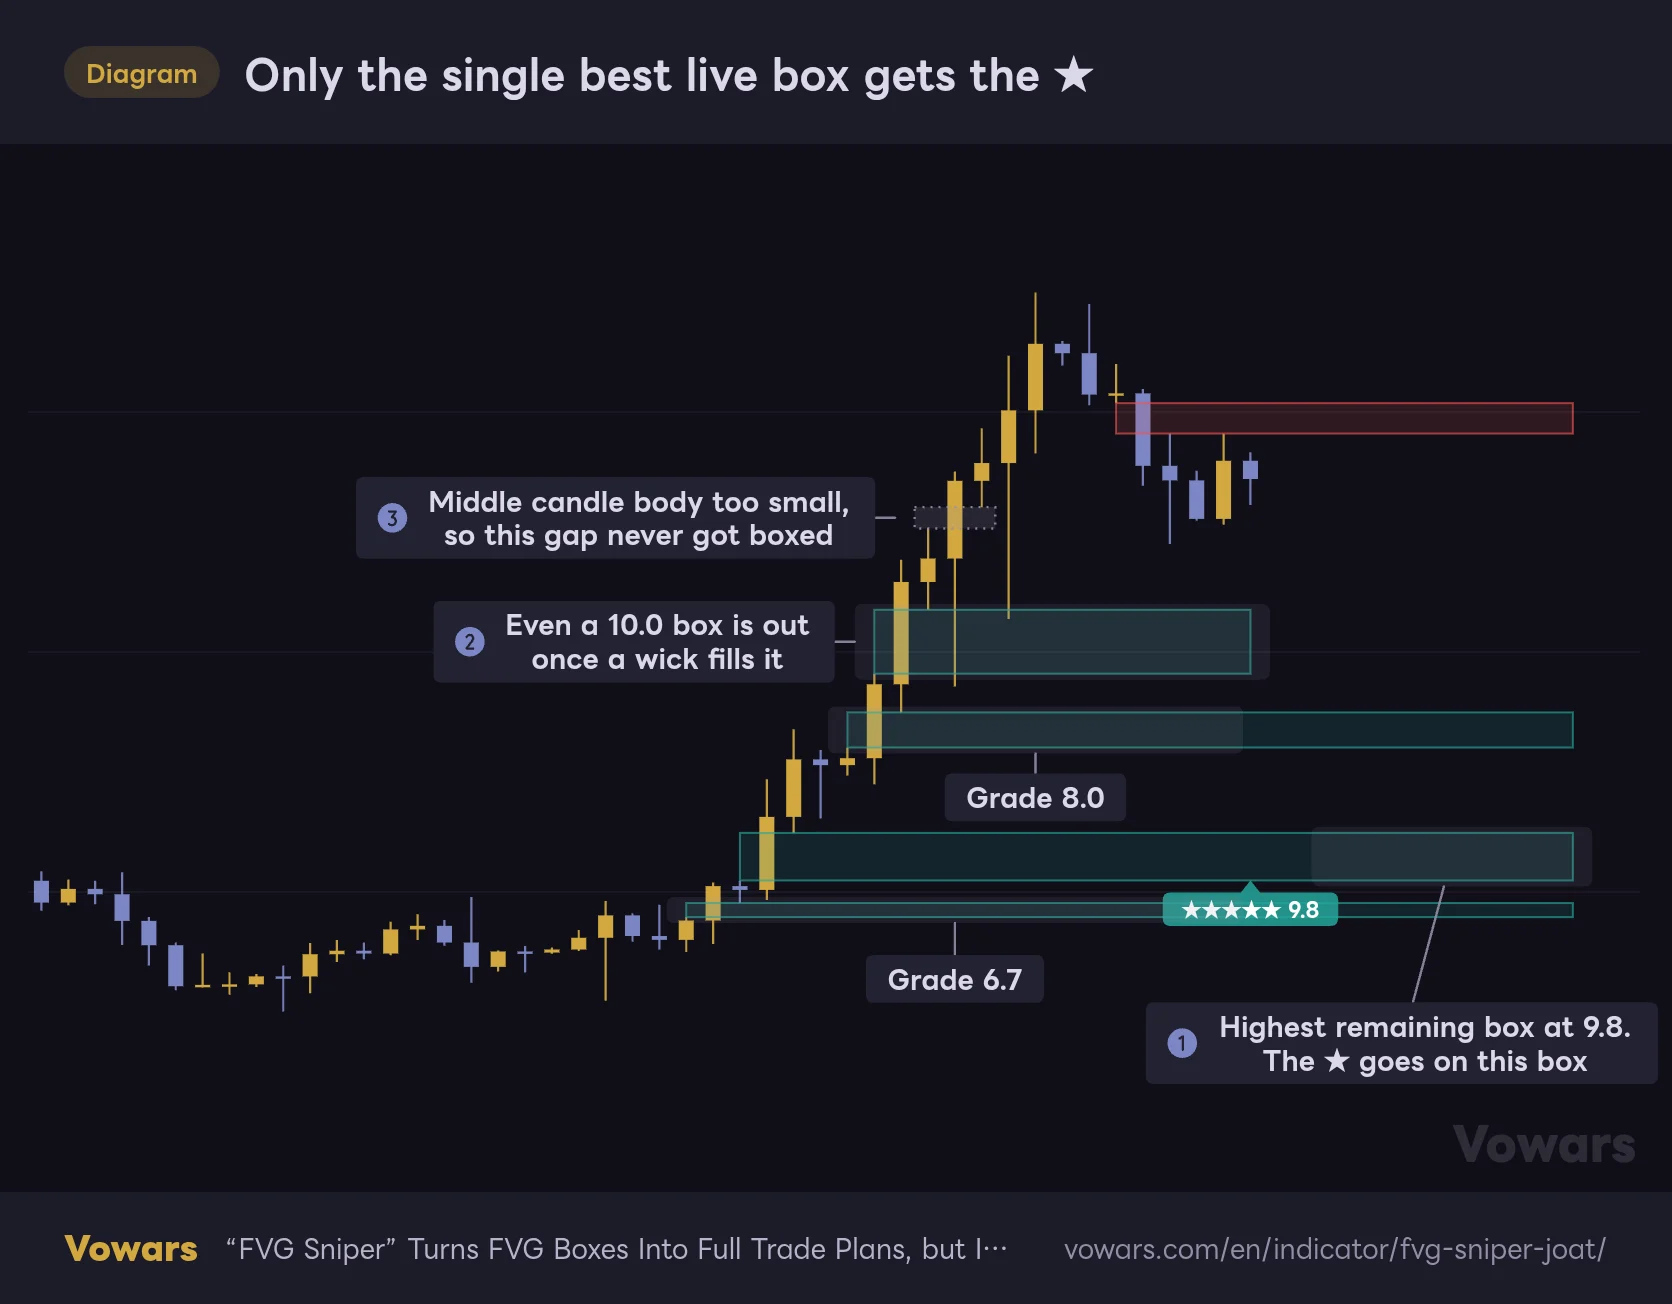
There are only two places where you can actually see this score: the BUY/SELL labels, and the single ★ label on the right edge of the chart. The ★ label goes to the highest-scoring box among boxes that are neither filled nor flipped.
Only the single best live box gets the ★
Every box gets a grade, but the ★ only shows up in one spot on the chart.
Vowars DE ver.3.11.2
Like the 10.0 box in the figure, no matter how high a box scores, it drops out of the running for the star the moment a wick fills it. Think of the label as “the best box still alive right now,” not “the best box ever,” and the chart becomes much easier to read.
On symbols with no volume data, the volume component is fixed at half (0.5). That puts the maximum possible grade at 8.75, so you’ll never see five stars. Also note that setting Min Signal Grade (0-10) to 9 or higher on those symbols means no signals will fire at all.
Boxes go through three stages: fill, freeze, flip
Fill % is locked in by the deepest low so far
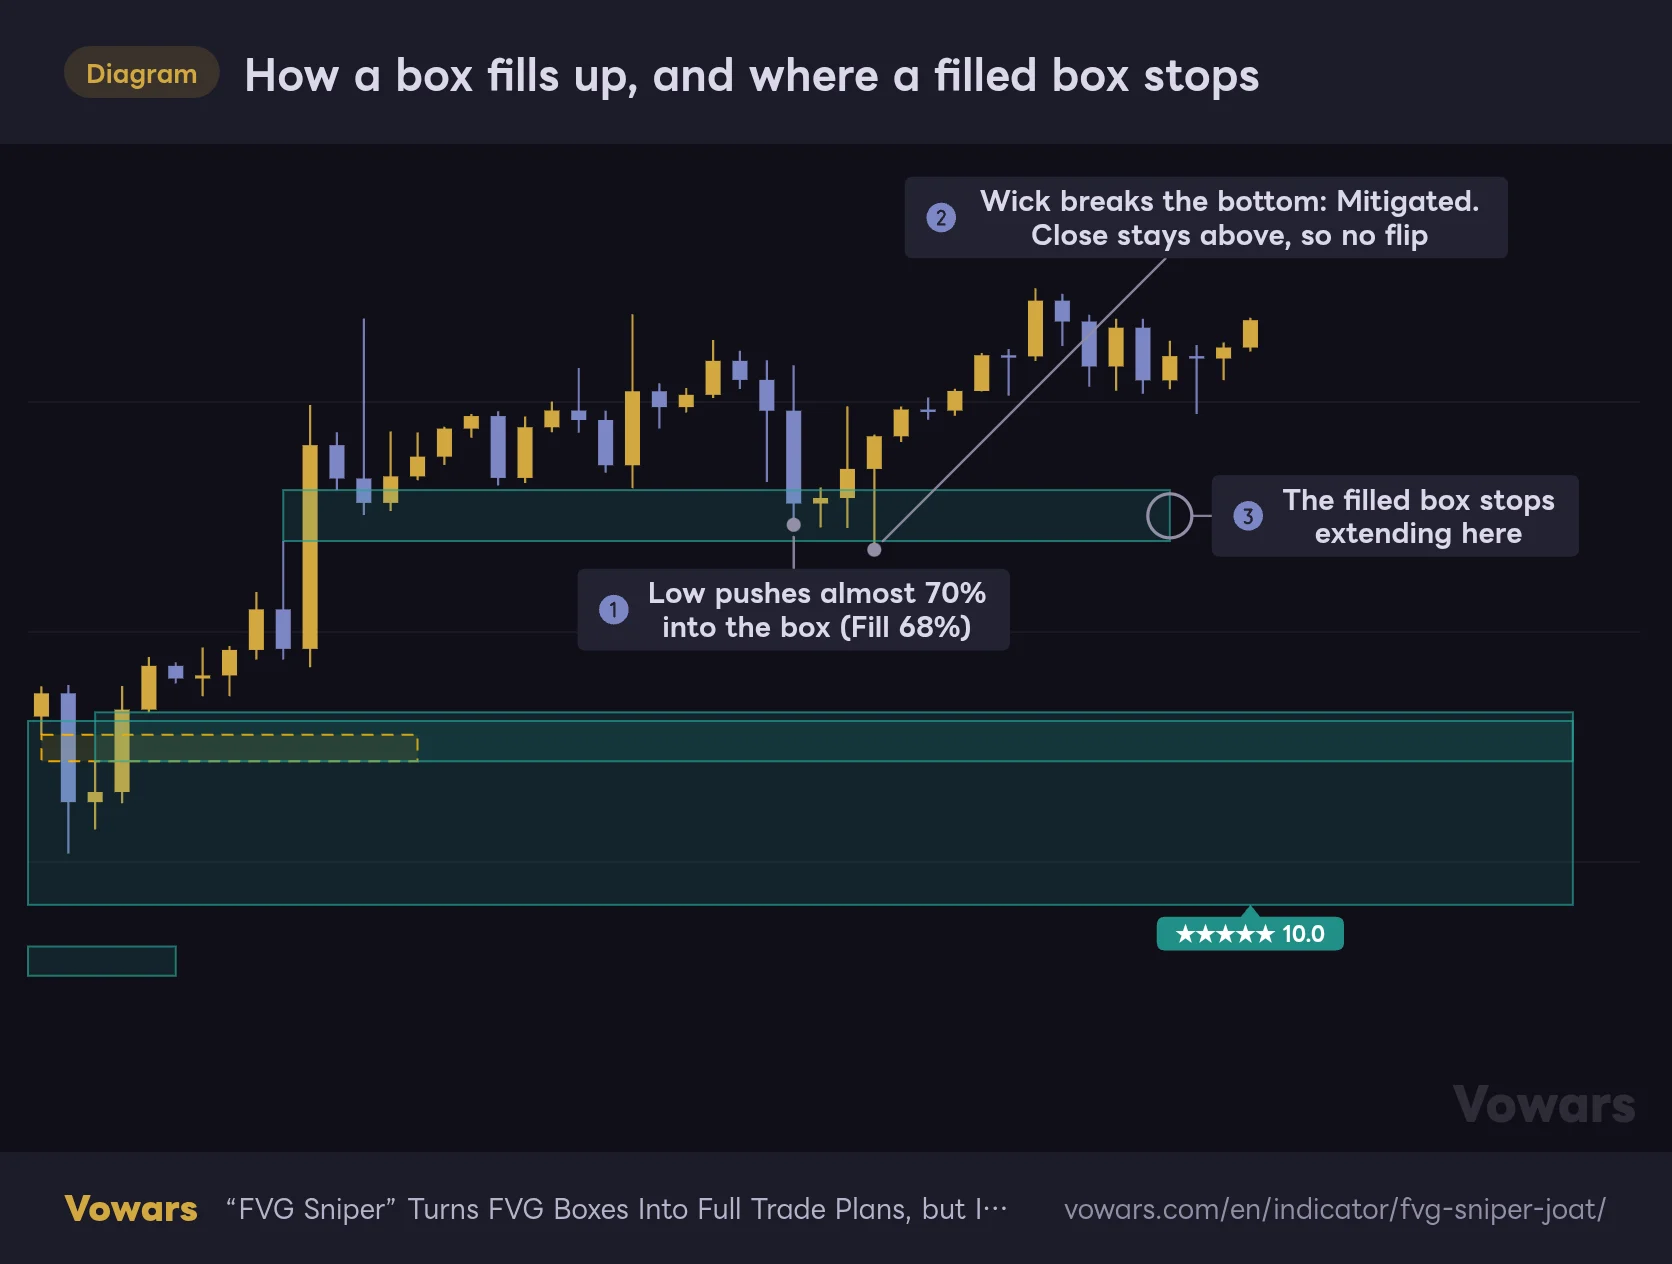
When price pulls back into a bullish FVG box, the indicator records how far the low has pushed in from the top of the box as the fill percentage. It uses the lowest low reached so far, so fill % never goes back down even if price bounces. Once a low (wick) reaches the bottom of the box, the box is Mitigated, meaning fully filled, and it stops extending right there.
How a box fills up, and where a filled box stops
The deeper the lows push into the box, the higher the fill %. Once a wick reaches the bottom, the box stops.
Vowars DE ver.3.11.2
What surprised me a bit is that fully filled boxes don’t disappear from the chart. By default they even keep their color, so the only way to tell them apart from live boxes is whether they’re still extending to the right. If the chart gets crowded, turn on Hide Mitigated Gap Boxes and boxes vanish the moment they’re filled, leaving only the live ones to track.
Boxes closed through turn into amber dashed boxes and flip roles
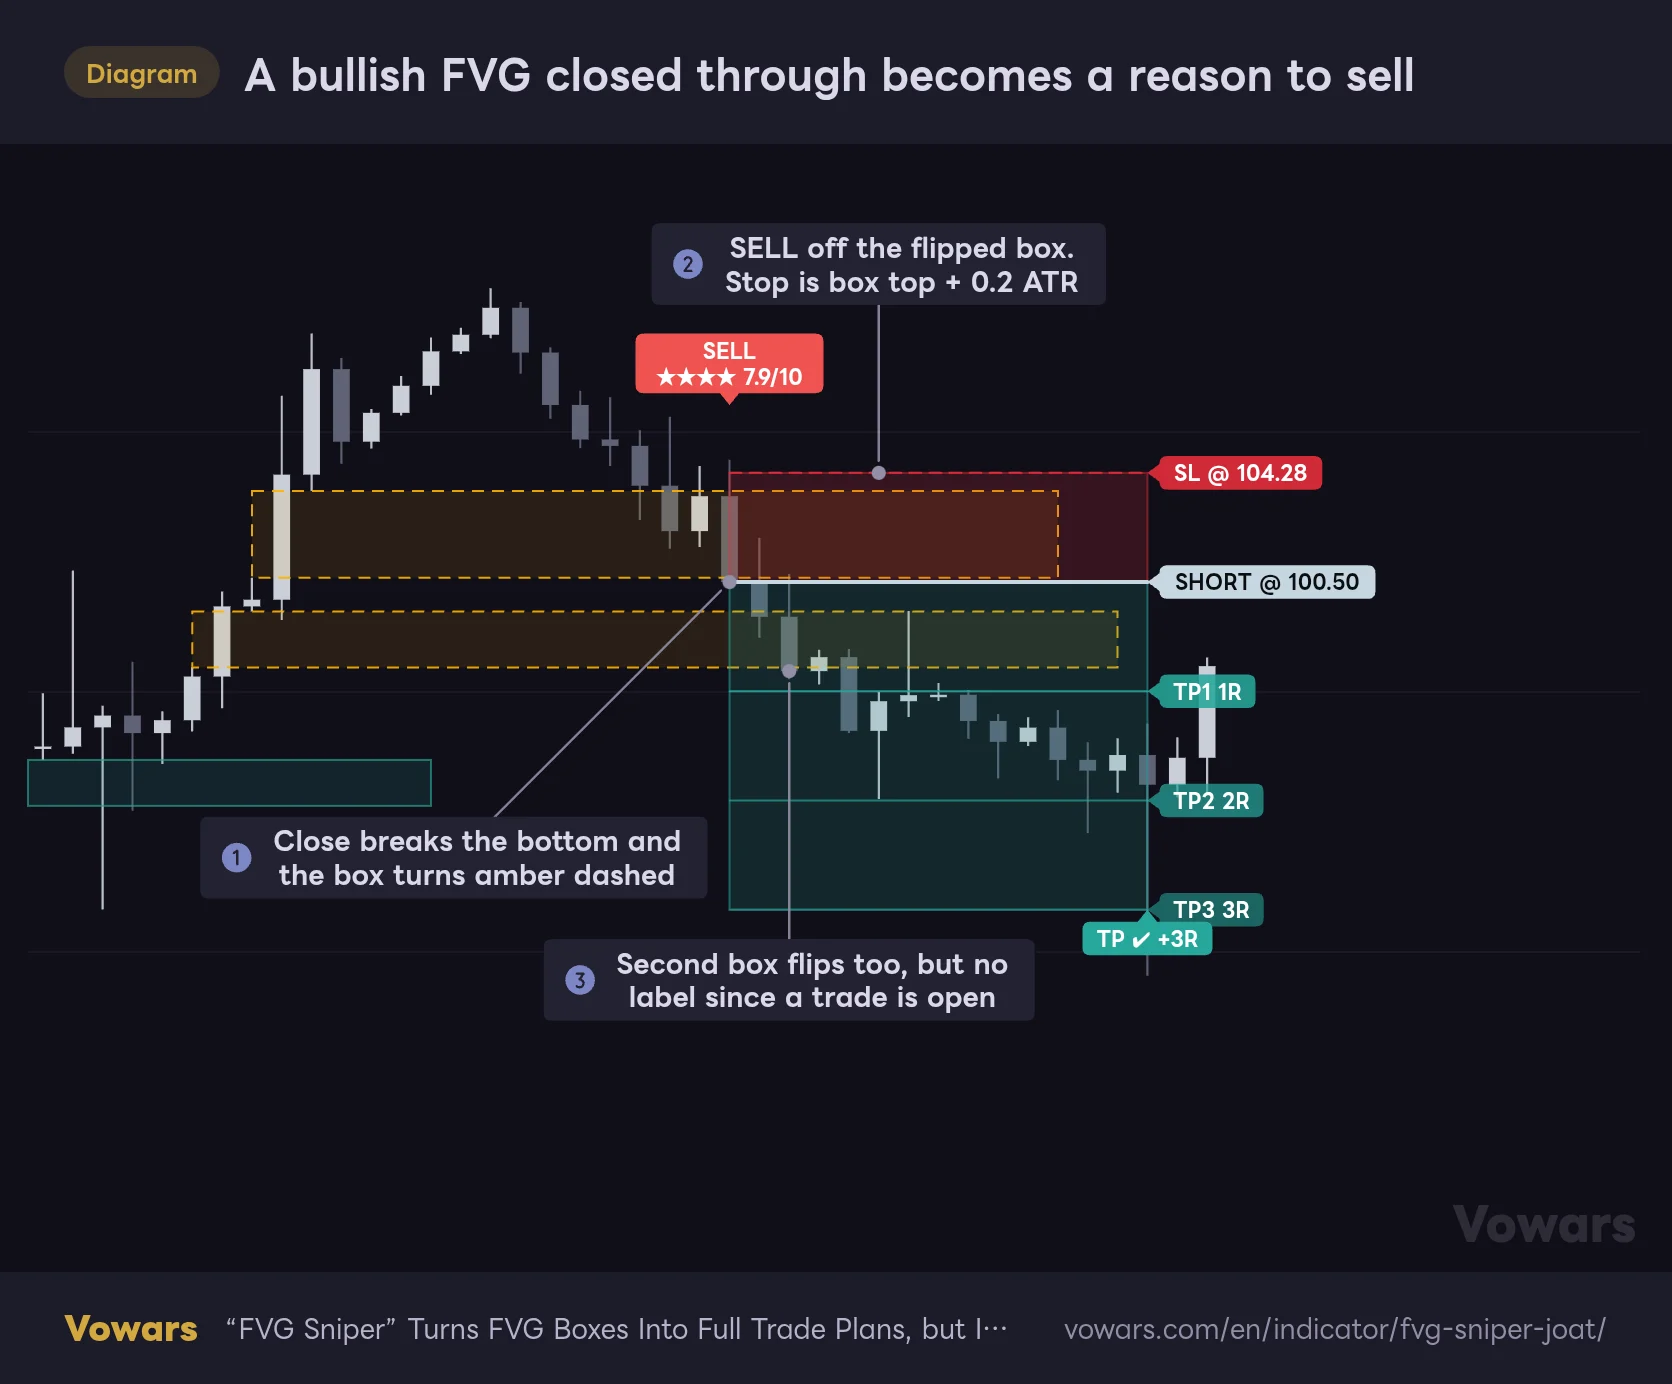
FVG Sniper draws a hard line between a wick through a box and a close through it. When a candle closes below the bottom of a bullish FVG, that box becomes an inverted FVG (IFVG) and restyles as an amber dashed box. The idea is simple: a gap that used to justify longs now justifies shorts.
A bullish FVG closed through becomes a reason to sell
When price closes through a box instead of just wicking it, the box flips roles (IFVG) and signals the opposite direction.
Vowars DE ver.3.11.2
A flipped box only changes its styling. If price comes back later to retest it, no new signal fires. A flip-based signal happens exactly once, on the candle that closes through. If you want to use IFVGs as retest levels to sell the rally, that part is on you to watch.
BUY and SELL only fire in two scenarios
You choose where signals come from with Signal Source. The default, “Rejection + IFVG,” uses both.
1Tagging the box on a pullback and bouncing (Rejection)
A BUY fires when price dips into a bullish FVG that hasn’t been filled yet, holds above the bottom of the box, and the candle closes green. Shorts are the mirror image: price pushes up into a bearish FVG and the candle closes red for a SELL. Each box can produce only one Rejection signal, and the candle that created the box doesn’t count. You can drop the green/red close requirement by turning off Require Directional Rejection Close.
2Closing straight through the box (IFVG Flip)
A candle that closes above a bearish FVG fires a BUY, and a candle that closes below a bullish FVG fires a SELL. The flip moment covered in the previous section becomes the signal itself.
Either way, two conditions have to hold: the grade of the box behind the signal must be at least Min Signal Grade (0-10) (default 4.0), and the higher-timeframe direction has to agree. HTF direction is bullish when the close on HTF Timeframe (default 240, i.e. the 4H) is above the HTF EMA Length EMA (default 50), and bearish when it’s below. Bullish bias only allows BUYs, bearish bias only allows SELLs.
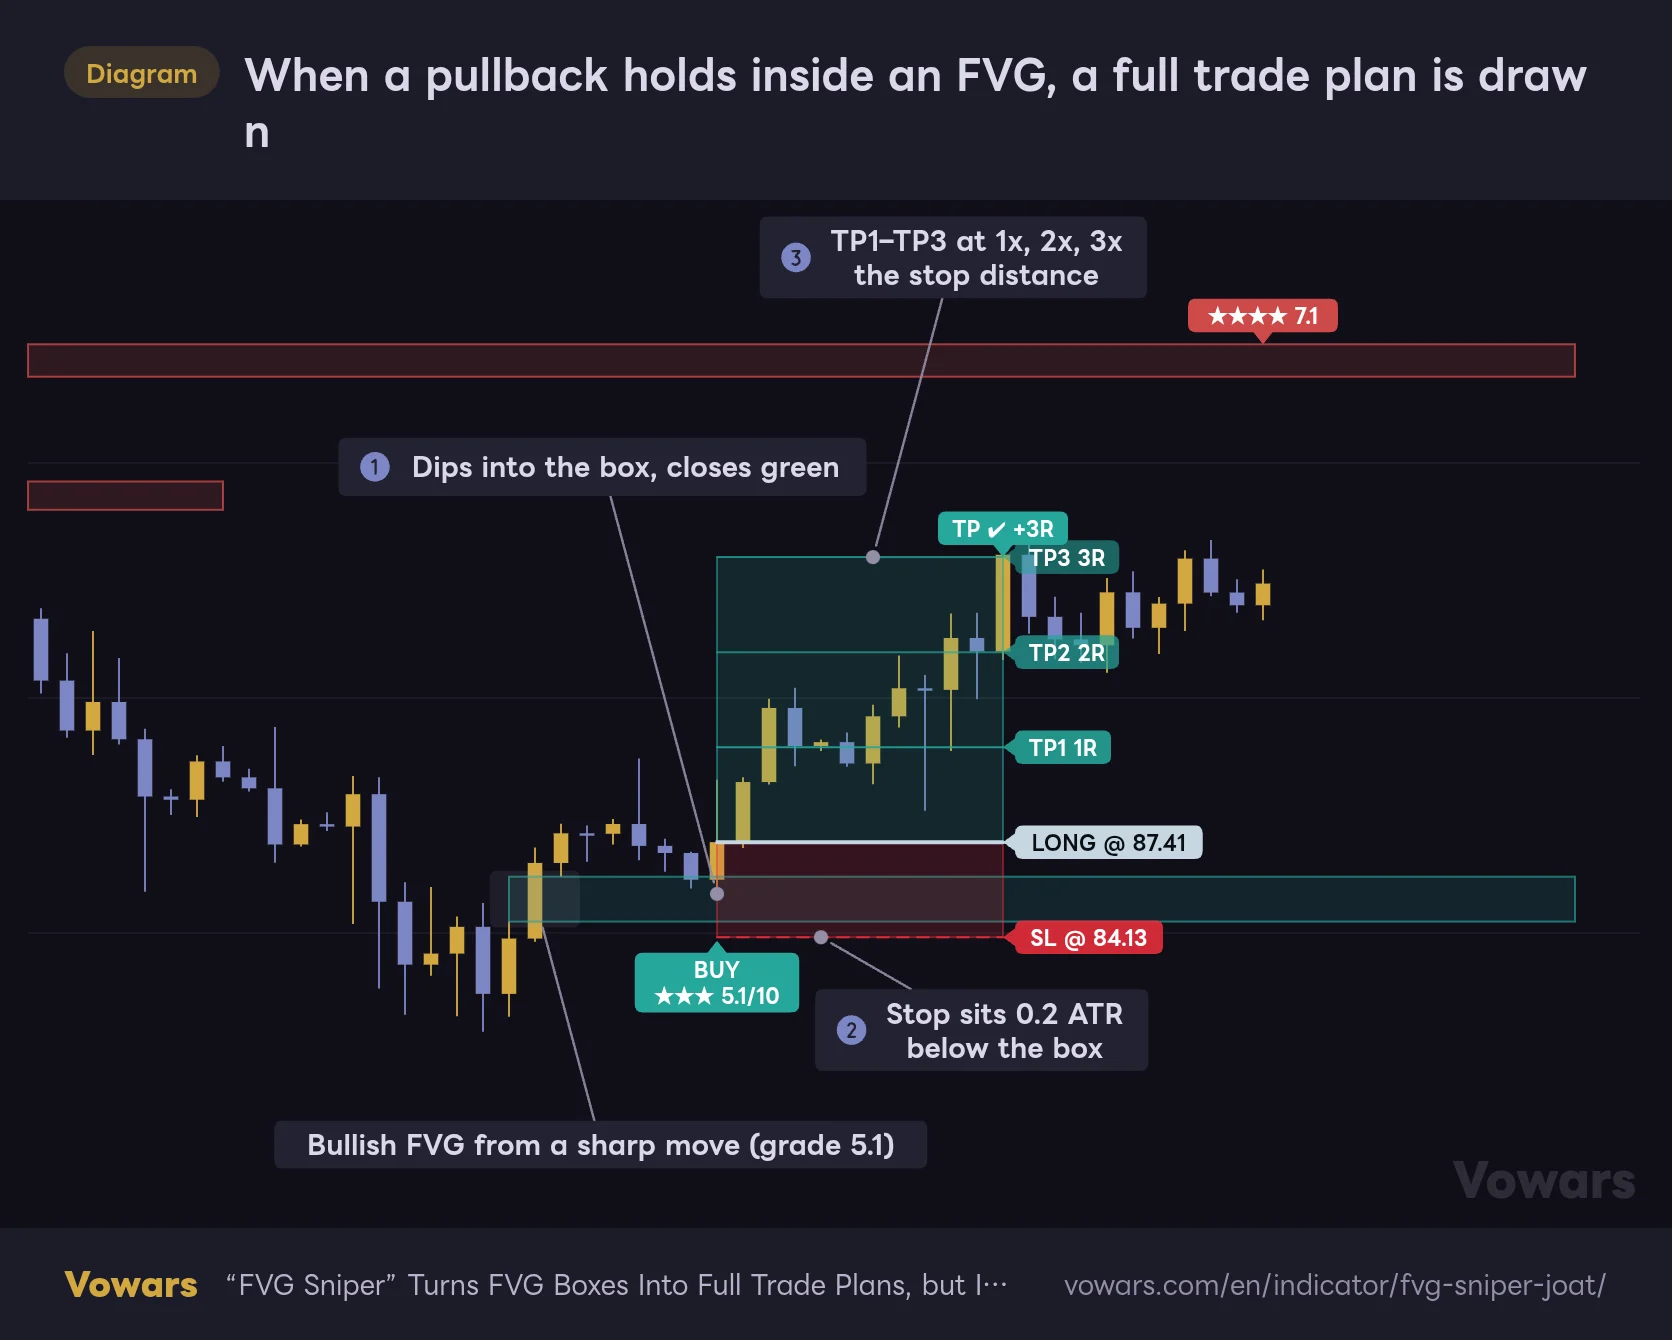
When a pullback holds inside an FVG, a full trade plan is drawn
When the pullback holds inside the box and the candle closes green, a BUY fires. Entry, stop, and take-profit levels are drawn at the same time.
Vowars DE ver.3.11.2
How to read the lines and zones of a trade plan
- The thick white line is the entry, set at the close of the signal candle
- The red dashed line is the stop. By default it sits just outside the box behind the signal, padded by 0.2x ATR
- The thin green lines are TP1–TP3, placed at 1x, 2x, and 3x the stop distance (1R)
- The green zone runs from entry to TP3, and the red zone runs from entry to the stop
- The labels on the right show the entry and stop prices and the R multiple of each TP
Stop distance has both a floor and a cap. Anything tighter than 0.4x ATR gets widened to 0.4x, and anything wider than 4x ATR gets capped at 4x. Even when the signal comes from a small box, this goes some way toward keeping the stop from sitting so close that it gets tagged right away.
Once a trade closes, a result label appears. If a high reaches TP3, you get “TP ✔ +3R.” If the stop is hit, you get “SL ✘ -1R.” If nothing resolves within 120 bars, the trade is closed at that bar’s close and labeled “EXIT” with its R multiple. If TP3 and the stop are both touched on the same candle, it’s recorded as a stop-out. I read that as a conservative call that avoids flattering the results.
Three behaviors worth knowing before you use it
A trade is a win or a loss based only on whether TP3 or the stop gets hit first
This was the one that surprised me most. TP1 and TP2 are just lines on the chart. Hitting them doesn’t get recorded anywhere.
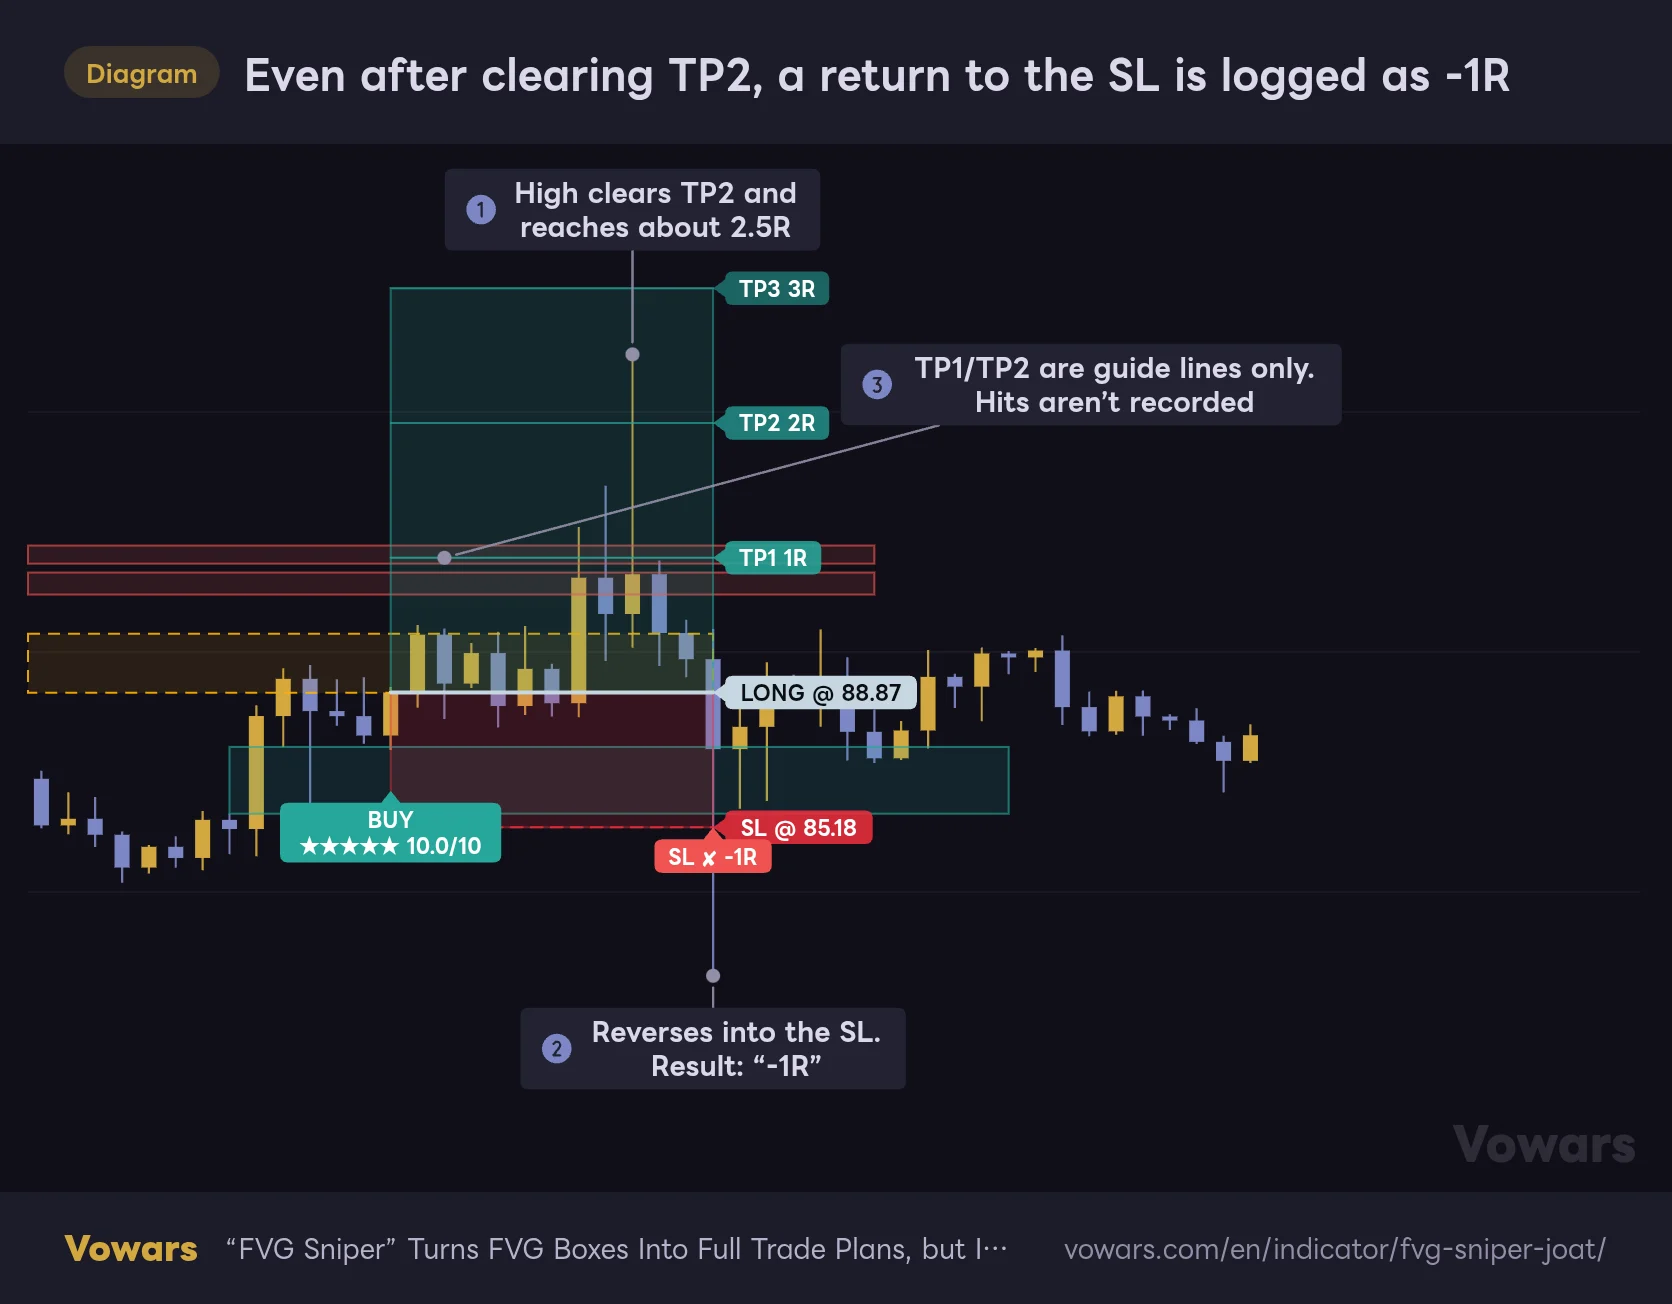
Even after clearing TP2, a return to the SL is logged as -1R
Whether a trade counts as a win or a loss depends only on which gets hit first: TP3 or the SL.
Vowars DE ver.3.11.2
As the figure shows, a trade that blew well past TP2, reversed, and tagged the stop still gets labeled “SL ✘ -1R.” If you estimate a win rate by counting result labels on the chart, the numbers won’t match a strategy that scales out at TP1. The accurate way to read these labels is as a record of what would have happened if you held all the way to TP3.
Signals that fire mid-trade trigger alerts but don’t get drawn
FVG Sniper only runs one trade plan at a time. Until the current trade ends by TP3, stop, or timeout, new BUY/SELL setups won’t draw a label or a trade plan, even when all the conditions are met. The alert conditions still fire, though, so you can get an alert with nothing showing up on the chart. The candle marked ③ in the flip figure from the previous section is exactly that situation.
If you want to cut down on this, shorten Max Trade Duration (bars). That limits how long an unresolved trade can block the next one.
Old boxes and trade plans are deleted automatically once limits are hit
Only the 14 newest boxes are kept (Max Visible Gaps), and only for 220 bars after they form (Gap Lifetime (bars)). Trade plans are limited to the last 20 as well (Max Drawn Trades). That’s why you won’t find older boxes when you scroll back.
To review the past, either raise those three values or use TradingView’s Bar Replay. Bar Replay lets you rebuild the chart one bar at a time as it looked back then. You have to step through it manually, though, and how far back you can go on intraday timeframes depends on your plan (daily and above can replay the full history).
FVG Sniper is built as an indicator, not a strategy, so the Strategy Tester won’t show any P&L or win-rate stats. Result labels are kept for the last 20 trades, so you’re left counting them by eye or checking them one by one in Bar Replay.
The top-right dashboard only reflects the latest bar
What the 11 rows of the dashboard tell you
The top-right panel summarizes the boxes still in play as of the latest bar.
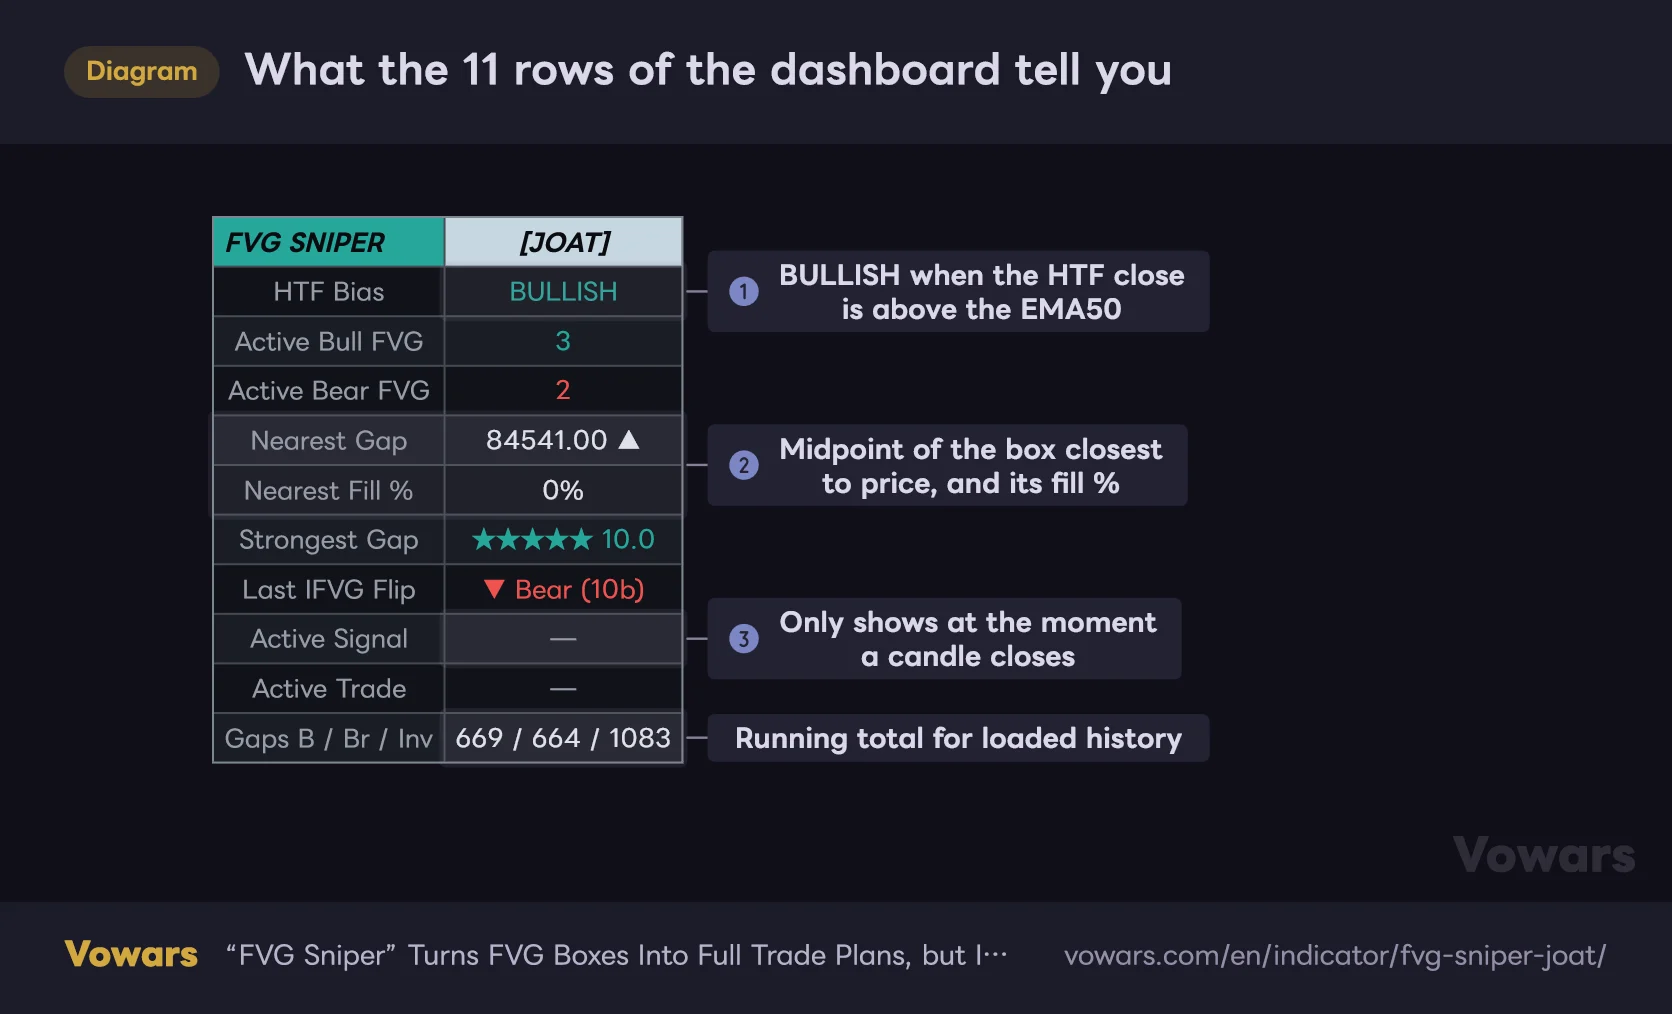
Values in the table are illustrative.
Vowars DE ver.3.11.2
The panel has 11 rows, and reading it top to bottom gives you the current picture. Active Bull FVG and Active Bear FVG count boxes that are neither fully filled nor flipped. Nearest Gap is the midpoint price of the box closest to current price, with ▲ for a bullish FVG and ▼ for a bearish one. Nearest Fill % is that box’s fill percentage.
The row that tripped me up was Active Signal. Signals only fire when a candle closes, so this row only shows something for a split second right after the close, then flips back to “—” as soon as the next candle starts moving. If you don’t want to miss signals, setting alerts is far more reliable than watching this row. The running totals on the bottom row are counted within whatever history is loaded on the chart, so they change with the timeframe and how much data is loaded.
There are four alert conditions. In TradingView’s Create Alert dialog, pick “FVG Sniper [JOAT]” as the condition and you can choose from the following.
- FVG Sniper — BUY
- FVG Sniper — SELL
- FVG Sniper — Bull IFVG Flip
- FVG Sniper — Bear IFVG Flip
The last two fire on any candle that closes through a box, regardless of HTF bias or grade. Note that if you set Signal Source to “Rejection Only,” the flip alerts stop firing as well.
Set the HTF filter to a timeframe above your chart
The default HTF Timeframe is “240,” the 4H. It only works as a higher timeframe when your chart is below the 4H. On a 4H chart it just looks at the same timeframe, and on a daily chart it actually references a lower timeframe. The daily chart above shows BULLISH on the dashboard too, but what that really means is “the last 4H candle of the day closed above the EMA50.”
When you change timeframes, change this setting along with it. A good rule of thumb is a timeframe roughly 4 to 6 times your chart.
| Chart timeframe | Suggested HTF Timeframe |
|---|---|
| 5m to 15m | 60 (1H) |
| 30m to 1H | 240 (4H, the default) |
| 4H | D (daily) |
| Daily | W (weekly) |
No repainting on closed bars, but the HTF read can shift
The author says the indicator doesn’t repaint because it only calculates on closed bars, and that the HTF request uses no lookahead. I confirmed that box detection, grading, fill tracking, signals, and trade results are all calculated on closed bars only. No future data leaks into historical bars either.
The part to watch is the HTF bias. In real time, it uses the HTF value before that HTF candle has closed. TradingView’s official documentation also explains that when higher-timeframe data is requested this way, real-time bars use the still-forming HTF value, so results can differ from the historical calculation after the chart reloads.
In practice, the risky moments are when the 4H close is chopping right around the EMA50. A BUY that fired in real time on the 30m could be gone after a reload, or the other way around. When the HTF is well away from the EMA this is rarely an issue, but for signals near the EMA it’s safer to wait for the HTF candle to close.
On historical bars, HTF bias is always evaluated from confirmed values. So even if a BUY looks like a clean winner when you scroll back, that doesn’t mean the same signal actually fired in real time. Around HTF bias flips especially, don’t lean too hard on what the history shows.
Five setting groups, and only four settings you need to touch first
There are a lot of settings, but the groups are named after what they do, so it’s easy to find your way around. The four I actually changed were HTF Timeframe, Min Signal Grade (0-10), Hide Mitigated Gap Boxes, and Max Trade Duration (bars). Everything else works fine at the defaults.
01 · Engine (the basics of boxes and signals)
| Setting | Default | Suggested | Effect |
|---|---|---|---|
| Detect Bullish FVGs | On | On | Detects bullish FVGs. Turn it off and no bullish boxes are created, which also removes BUYs from them and SELLs from their flips |
| Detect Bearish FVGs | On | On | Detects bearish FVGs. Turn it off and bearish boxes and the signals from them go away |
| Signal Source | Rejection + IFVG | Rejection + IFVG | Where signals come from: pullback rejections only, flips only, or both |
| Max Visible Gaps | 14 | 14–30 | How many boxes to keep. More shows older boxes but clutters the chart |
| Gap Lifetime (bars) | 220 | 220 | How many bars an unfilled box stays. After that, the box is deleted |
| Gap Box Extension (bars) | 12 | 12 | How many bars past the latest candle live boxes extend |
02 · Filters (which boxes and signals get through)
| Setting | Default | Suggested | Effect |
|---|---|---|---|
| ATR Length | 14 | 14 | ATR period used to measure gap size and stop distance |
| Min Gap Size (× ATR) | 0.25 | 0.25–0.4 | Smallest gap that gets boxed. Higher values drop smaller gaps |
| Min Displacement Body Ratio | 0.45 | 0.45–0.6 | Minimum body share of the middle candle. Higher values keep only strong displacement candles |
| Min Signal Grade (0-10) | 4.0 | 6.0–7.0 | Minimum grade a box needs to fire a signal. Higher means fewer signals |
| Higher-Timeframe Bias Filter | On | On | Only allows signals that agree with the HTF direction |
| HTF Timeframe | 240 | 4–6x your chart | The higher timeframe. Set it longer than your chart timeframe |
| HTF EMA Length | 50 | 50 | EMA period used to read the HTF direction |
| Require Directional Rejection Close | On | On | Requires rejection signals to close green (red for sells) |
03 · Trade Model (how trade plans are built)
| Setting | Default | Suggested | Effect |
|---|---|---|---|
| Stop Basis | Gap-Protected | Gap-Protected | Stop placement: just outside the box, or an ATR multiple from entry |
| Gap Stop Buffer (× ATR) | 0.20 | 0.20–0.30 | Padding added outside the box when using Gap-Protected |
| ATR Stop Distance (× ATR) | 1.50 | 1.50 | Stop distance when ATR is selected |
| Min Risk (× ATR) — floor | 0.40 | 0.40 | Floor on stop distance |
| Max Risk (× ATR) — cap | 4.00 | 4.00 | Cap on stop distance |
| TP1 (R) | 1.0 | 1.0 | First take-profit guide. Drawn as a line only, not used to score the trade |
| TP2 (R) | 2.0 | 2.0 | Second take-profit guide. Also not used to score the trade |
| TP3 (R) | 3.0 | 2.0–3.0 | Final target. Whether price reaches it decides the win or loss |
| Max Trade Duration (bars) | 120 | 30–60 on lower timeframes | If the trade isn’t resolved within this many bars, it’s closed at the close |
| Active Zone Projection (bars) | 8 | 8 | How many bars past the latest candle the active zones and lines are drawn |
| Max Drawn Trades | 20 | 20 | How many trade plans stay on the chart |
04 · Visuals and 05 · Dashboard (appearance)
| Setting | Default | Suggested | Effect |
|---|---|---|---|
| Show Gap Midline | Off | Your call | Draws a dotted line at the middle (50%) of each box |
| Hide Mitigated Gap Boxes | Off | On | Removes fully filled boxes so only live ones remain |
| Show Grade Spotlight ★ | On | On | Adds the ★ label to the highest-graded box |
| Show Inversion (IFVG) Styling | On | On | Restyles flipped boxes as amber dashed boxes |
| Color Candles (Zone Reader) | Off | Your call | Lightly tints candles that close inside a live box and paints signal candles in a stronger color |
| Show VWAP + σ Bands | Off | Off | Shows VWAP with upper and lower bands |
| Box Transparency | 86 | 86 | Fill transparency of the boxes |
| Label Size | Small | Small | Text size of the labels |
| Show Dashboard | On | On | Shows the top-right panel |
| Position | Top Right | Top Right | Where the panel sits |
There are also toggles to hide labels, lines, and result labels individually, plus color settings. The three colors are Bullish FVG / Long (#26A69A), Bearish FVG / Short (#EF5350), and Inversion Accent (#FFB300). The silver entry line and the red risk zone have no color inputs of their own.
The band width of Show VWAP + σ Bands is based on the standard deviation of the last 100 closes. That’s a different calculation from typical VWAP bands, which size the bands by deviation from VWAP, so don’t treat it as a bug if the numbers don’t match VWAP bands from other tools.
Tuning by goal
1Fewer signals, only the strongest boxes
Raise Min Signal Grade (0-10) to 6–7. Gap size and middle-candle displacement account for over 70% of the grade, so a higher threshold leaves only signals from boxes that opened big and fast. If that’s still too many, bump Min Displacement Body Ratio to around 0.6 and boxes born from small-bodied candles drop out.
2Day trading on the 5m and 15m
Set HTF Timeframe to 60 and cut Max Trade Duration (bars) to 30–60. At 120 bars, a single trade on the 5m can sit there for 10 hours, hiding every signal in between. If it still feels noisy, raise Min Gap Size (× ATR) to around 0.35.
3Swing trading, using boxes as levels to wait for
On a daily chart with HTF Timeframe set to W, turn on Hide Mitigated Gap Boxes. Only live boxes remain, so you can calmly map out where the next pullback is likely to stall. Treat the signals as a reference and use the boxes and ★ label as your map.
What I found running it on three Bitcoin timeframes
From here on, this is what I saw after putting it on real charts. All charts are BTCUSDT as of 2026/9/25.
On the 30m, one 10.0-grade winner sat next to high-grade losers
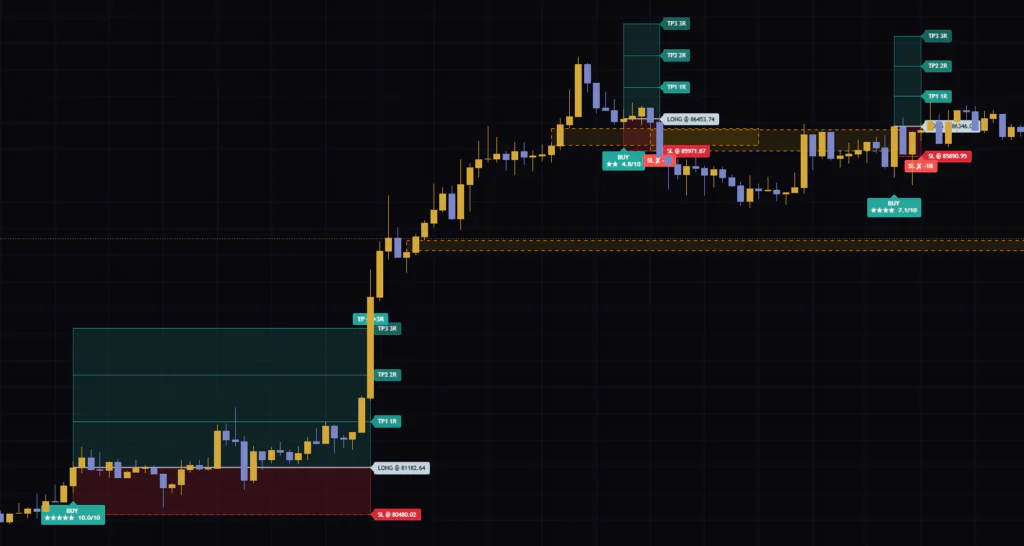
The 10.0-grade BUY that fired before the September 21 pump ran straight to TP3 for a “TP ✔ +3R.” That one was satisfying to watch. After that, though, the 4.8 and 7.1 BUYs that fired in the chop near the highs both got stopped out. Counting the four trades left on screen, it came to 1 win and 3 losses for exactly 0R.
Honestly, it drove home that the grade only measures the quality of the box, not the odds that the signal wins. Boxes left mid-pump were strong, while boxes that formed in the chop after the rally stalled tended not to hold up, even with high grades.
On the 4H, the HTF filter was just looking at itself
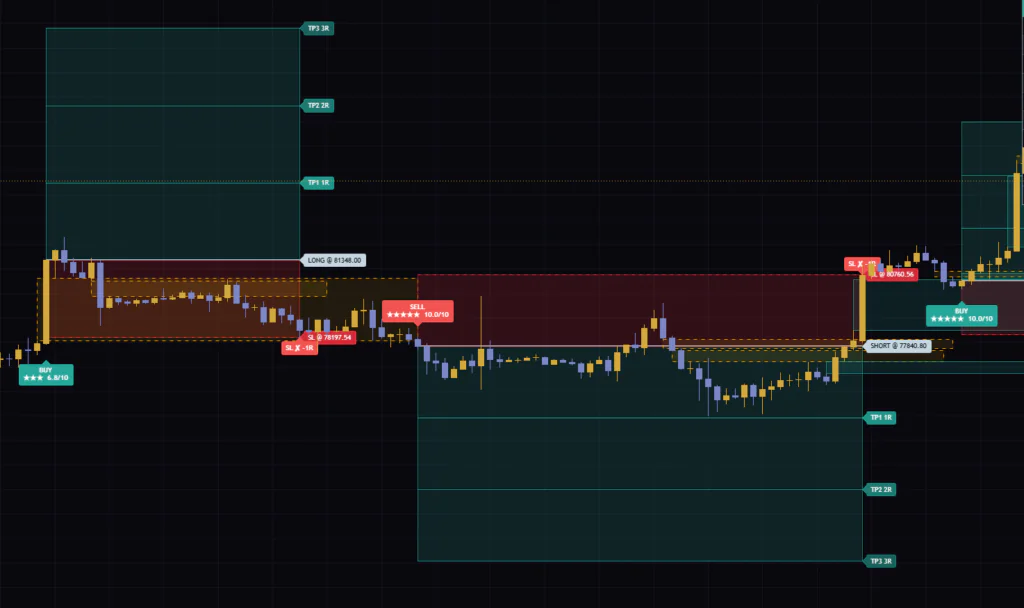
On the 4H, the default HTF Timeframe points at the same 4H, so the filter becomes “is this chart’s own close above the EMA50?” It still works, but it loses the whole point of aligning with a higher timeframe. If you trade the 4H, switching it to the daily (D) is how it’s meant to be used.
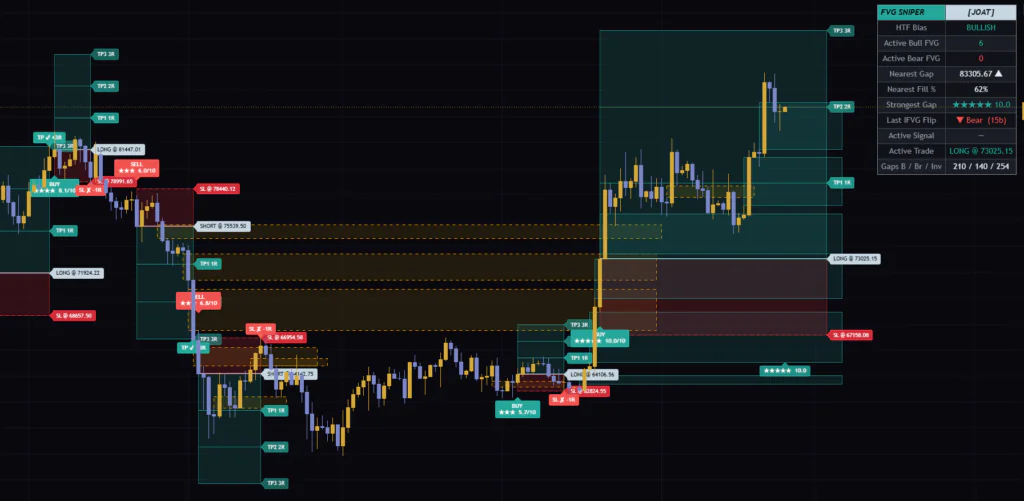
On the daily, the boxes are big and so are the trade plans
![FVG Sniper [JOAT]](https://vowars.com/wp-content/webp-express/webp-images/uploads/2026/09/FVG-Sniper5-1024x591.png.webp) Image
ImageOn the daily, each box spans thousands of dollars, and TP3 sits pretty far away. At the base of the mid-August rally, a 10.0-grade BUY had drawn a trade plan (still open as of the screenshot). On the daily, I personally found it easier to use as a map of where big unfilled gaps remain rather than for the signals themselves.
DMI is the best pairing, helping you skip BUYs in chop
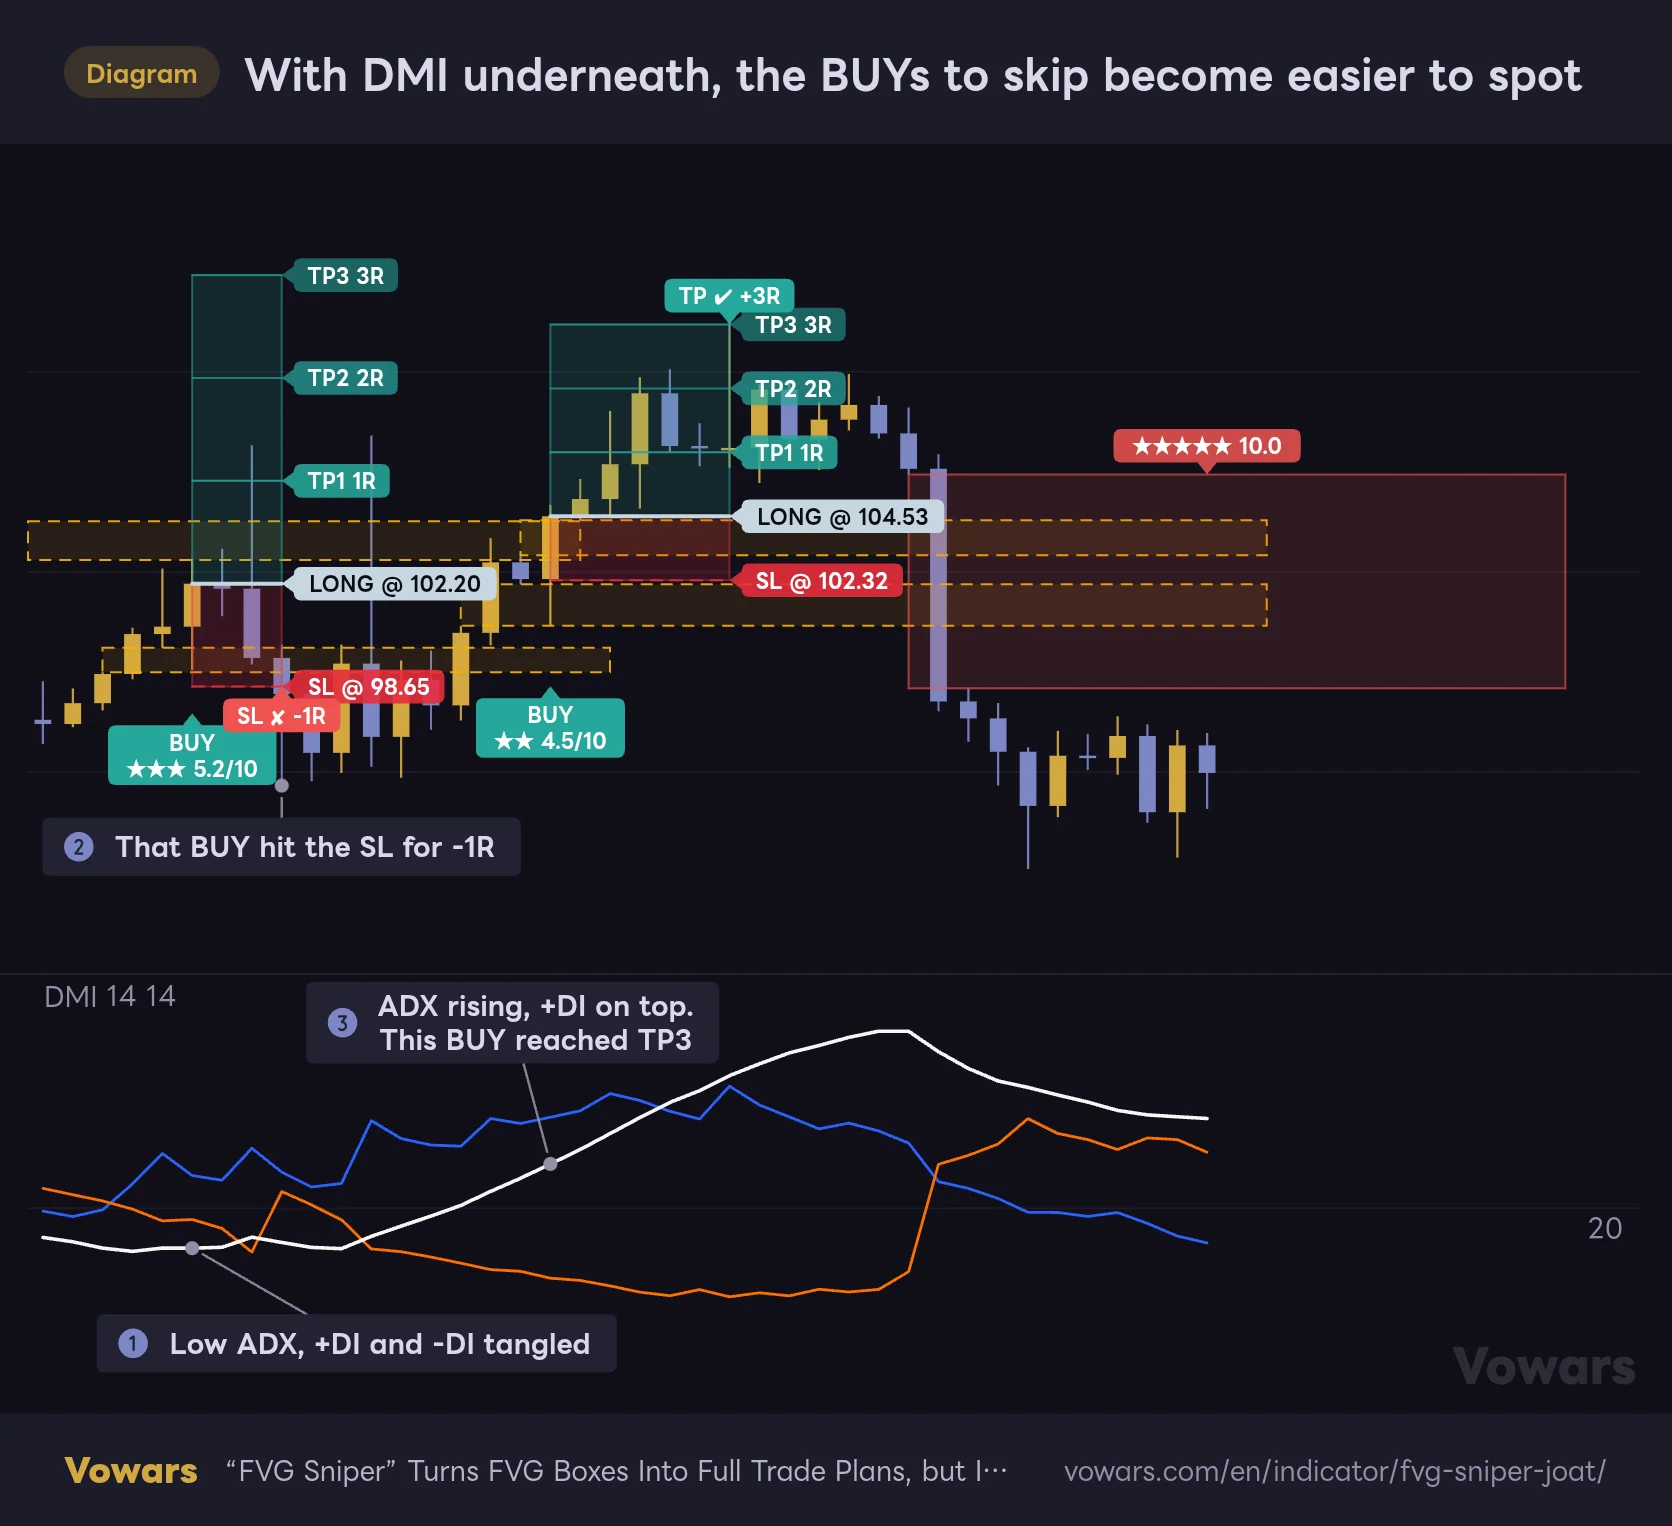
FVG Sniper’s HTF filter looks at direction, but not trend strength. The losing streak on the 30m came in chop where the direction was up but momentum had stalled. A good fit for plugging that gap is TradingView’s built-in “Directional Movement Index” (DMI).
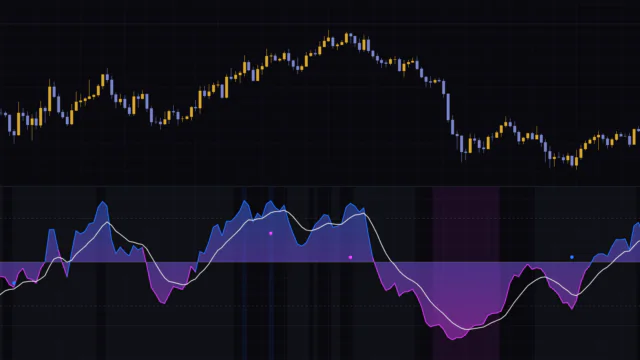
DMI has three lines. ADX measures trend strength, and when it’s rising, the trend is gaining strength. +DI tracks bullish momentum and -DI tracks bearish momentum. Just checking two things on the signal candle, whether ADX is rising and whether +DI is above -DI, makes BUYs in chop much easier to spot.
With DMI underneath, the BUYs to skip become easier to spot
On the BUY candle, just check the ADX slope and whether +DI is above -DI, and BUYs in chop become much easier to avoid.
- ADX
- +DI
- -DI
Vowars DE ver.3.11.2
As a rule, it looks like this: only take a BUY when ADX is above 20 and rising, and +DI is above -DI. SELLs are the reverse: ADX rising and -DI above +DI. FVG Sniper tells you where, and DMI tells you whether the market is actually moving. The author’s own description makes a similar point, that the tool locates the where and you confirm the when, and this pairing fits right into that approach.
It shines in strong, one-directional markets
FVG Sniper does best in markets that trend after a sharp pump or dump, printing pullbacks along the way. When price dips into a box left by a strong candle and bounces off it, textbook style, the trade plans line up beautifully. On the flip side, in ranges that just whip up and down, or when a trend is running out of steam and chopping near the highs, boxes still form but don’t hold up well, and stop-outs tend to stack up.
By trading style, it fits day trading and swing trading. It runs on scalping timeframes too, but I didn’t test around the 1m this time, and I’d expect more small gaps there to make it more vulnerable to noise. For position trading, it works as a map of boxes, but TP3 was too far away for the trade plans to be very practical.
What it does well
- FVG detection, grading, and trade-plan drawing all in one tool
- Only boxes gaps from big-bodied candles, so the chart doesn’t drown in boxes
- The ★ label shows the strongest live box at a glance
- Entry, stop, and take-profit levels plus R multiples are easy to read
- Tells wick-throughs apart from close-throughs and tracks flips (IFVG)
- Calculates on closed bars only, with no future data leaking into history
What to watch out for
- Wins and losses are decided only by TP3 or the stop, and TP1/TP2 hits aren’t recorded
- Signals that fire mid-trade aren’t drawn on the chart (alerts still fire)
- The HTF bias read can differ between real time and after a reload
- The default HTF (4H) isn’t a higher timeframe on 4H and above charts
- In chop, even high-grade signals tend to get stopped out repeatedly
- No performance stats, so reviewing results means eyeballing or Bar Replay
What to keep in mind before adding it to your chart
A BUY or SELL only tells you that two conditions lined up: an FVG and the HTF direction. It doesn’t account for momentum, key price levels, or upcoming economic releases. Don’t trade it mechanically on its own. Combine it with other confluence before making a call.
The result labels on the chart are scored on historical bars. Since the HTF bias may have looked different in real time, and since the indicator only runs one trade at a time, don’t treat a tally of those labels as a preview of your own results.
One more thing: if BUY and SELL conditions both line up on the same candle, BUY wins. It’s rare, but if you’re wondering why you got a BUY with boxes stacked close together above and below price, this is why.
Let FVG Sniper find the gaps, and bring your own reasons to enter
![FVG Sniper [JOAT]](https://vowars.com/wp-content/webp-express/webp-images/uploads/2026/09/FVG-Sniper6-1024x413.png.webp) Image
ImageFVG Sniper doesn’t stop at finding FVGs and drawing boxes. It goes on to show which box is strongest and what to do there. If you already know how FVGs work, it should cut down your chart time noticeably from day one.
That said, three things are worth knowing before you use it: result labels record what happens if you hold to TP3, signals that fire mid-trade aren’t drawn, and the HTF setting needs to be adjusted to your chart. I settled on matching HTF Timeframe to my chart, keeping DMI underneath, and only playing pullbacks into boxes that carry the ★ label. With the gap-hunting handed off, I get to spend that time on deciding whether to take the trade.