

What is “RSI Bottom/Top Retest Scalper”? A mean-reversion tool that only trades the second push
Short it because RSI tagged 70, long it because RSI dipped under 30. It’s the first thing everybody learns in technical analysis, but the moment you actually trade it you find out that fading the first extreme is the fastest way to get run over. Most of us have the scars to prove it.
“RSI Bottom/Top Retest Scalper” takes that exact problem head on. Even when RSI pushes deep into extreme territory, it will not print an entry signal there. It waits for RSI to cool off first, and only treats the move as tradeable once a second peak (or second bottom) forms inside the first one.
What makes “RSI Bottom/Top Retest Scalper” interesting is that the RSI side alone still doesn’t get you an arrow. Price has to close a set percentage of its candle body beyond a confirmation line plotted on the chart as an extra requirement, so the oscillator and price action both have to point the same way before anything counts as an entry. The author states the defaults were tuned for 5-minute gold scalping, so this is built for short-term fades from the ground up.
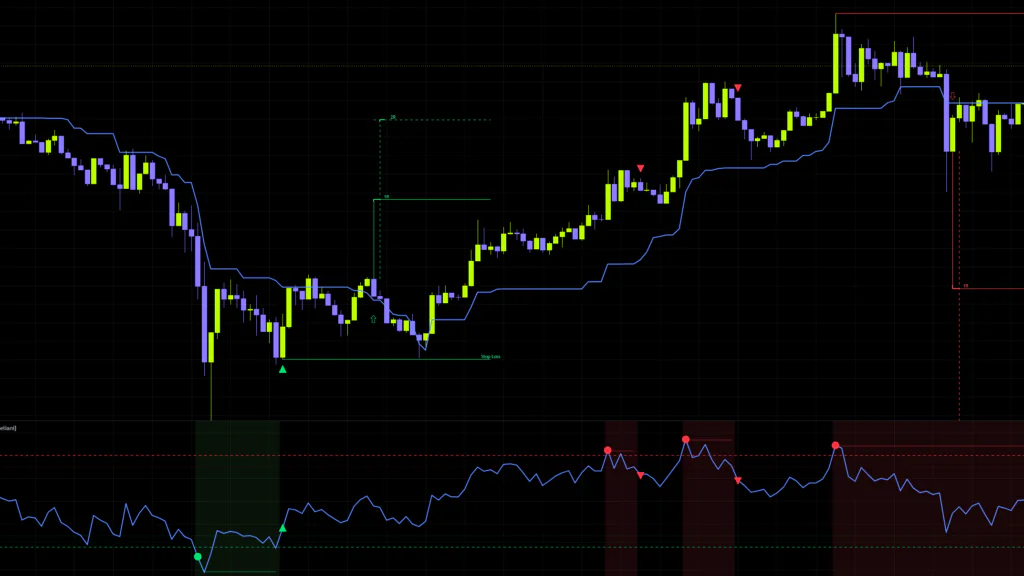
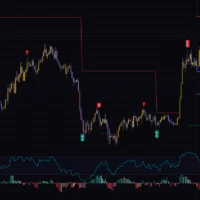
There are only three. 1. The circle in the RSI pane (first extreme). 2. The triangle (second retest confirmed). 3. The hollow arrow on the price chart (the actual entry). Lock in the idea that the circle and triangle are prep work and the arrow is the trade trigger, and everything below will click straight away.
What actually shows up on your chart
In the RSI pane
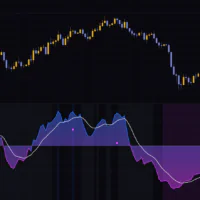
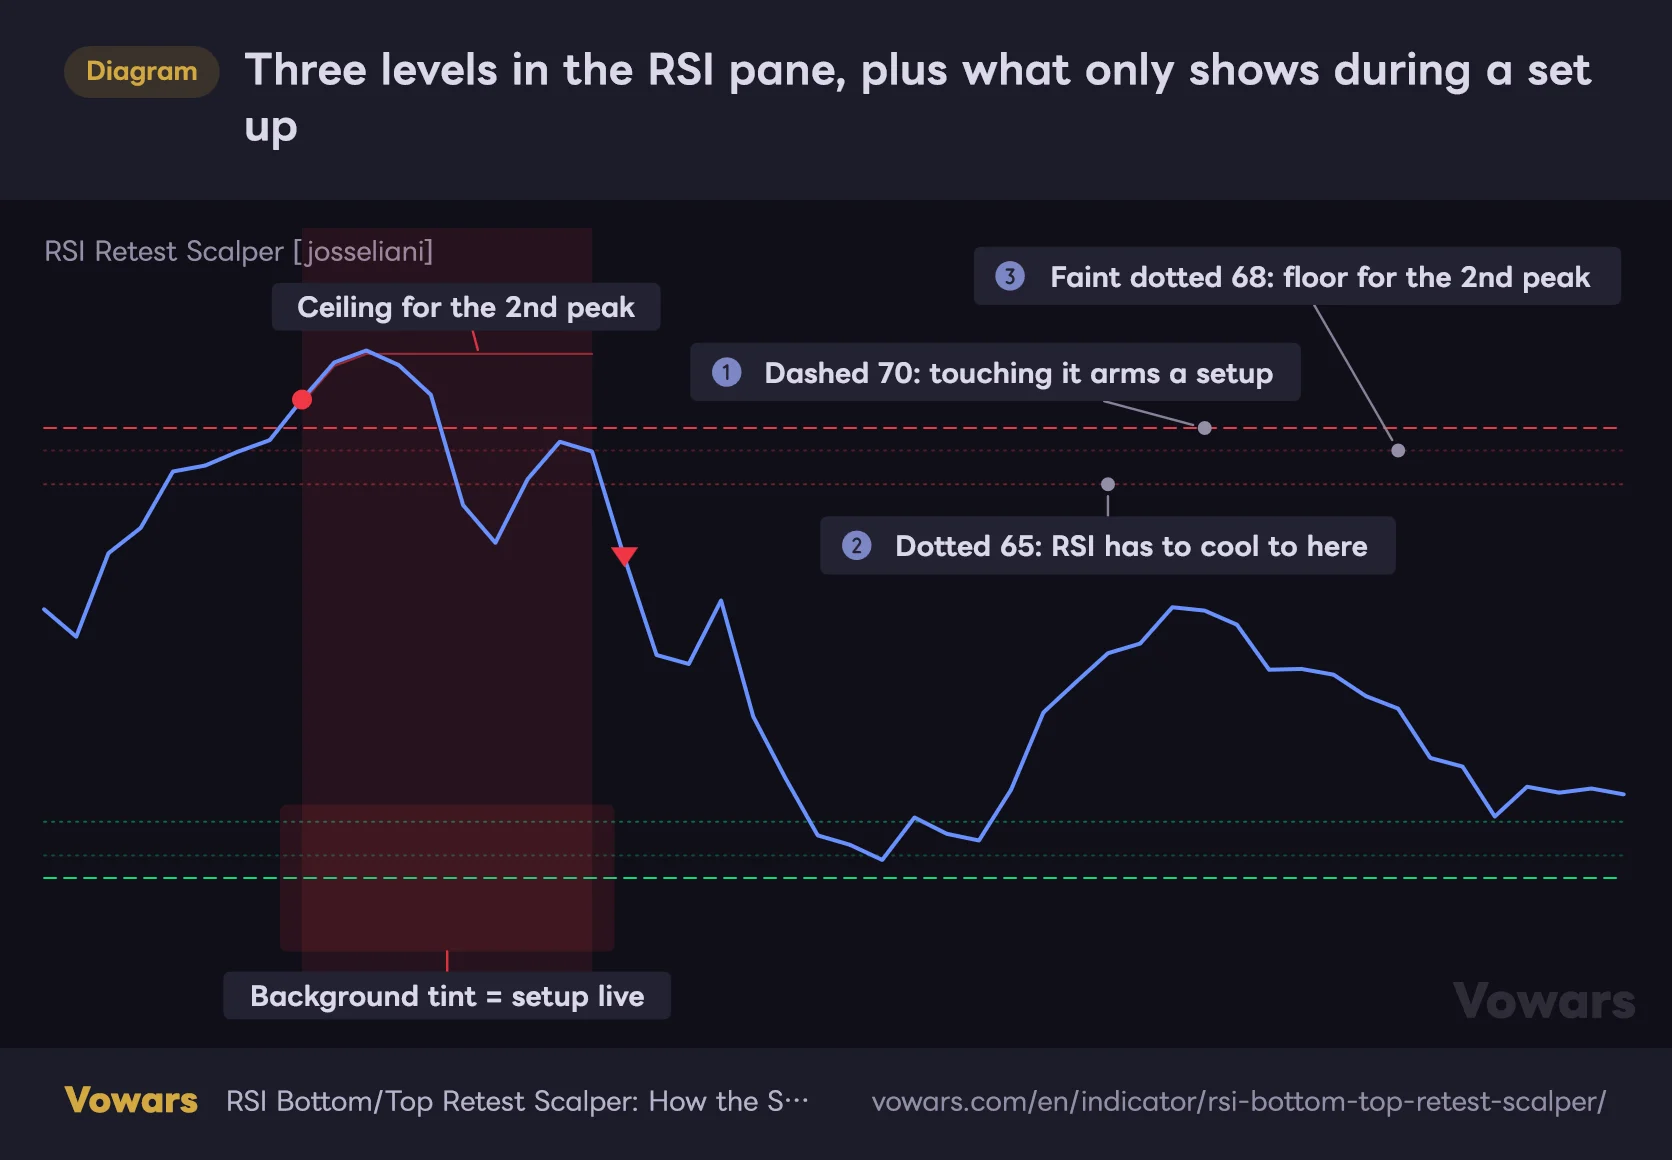
“RSI Bottom/Top Retest Scalper” plots in a separate pane below price. Alongside the usual RSI line you get three layers of horizontal levels, each doing a different job.
- Dashed lines (70 / 30) — the extreme levels that arm a setup
- Dotted lines (65 / 35) — the cooling levels RSI has to pull back to
- Faint dotted lines (68 / 32) — the re-entry levels the second peak or bottom has to reach
On top of that, a “ceiling the second peak is not allowed to break” is drawn dynamically, but only while a setup is live. It sits just inside the first peak, so you can literally see the cut-off: make a peak above that line and it won’t be accepted as a retest. The same thing happens in reverse on the bottom side, with a floor line instead.
While a setup is active the pane background also tints — red-ish when it’s hunting a short, green-ish when it’s hunting a long. Being able to tell at a glance whether the indicator is currently stalking something sounds minor, but it’s genuinely handy in live trading.
Three levels in the RSI pane, plus what only shows during a setup
The upper three lines handle short setups and the lower three handle longs. The background tint and the thin red line only appear while a setup is in progress.
Vowars DE ver.3.9.2
On the price chart
Four things get overlaid on price.
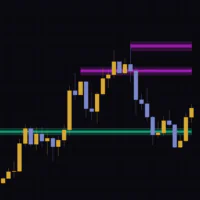
- The confirmation line (Kijun, 34 length, out of the box)
- The second-signal triangle (above/below the candles, can be switched off)
- The hollow entry arrow (⇧ / ⇩)
- The Stop Loss, 1R and 2R levels
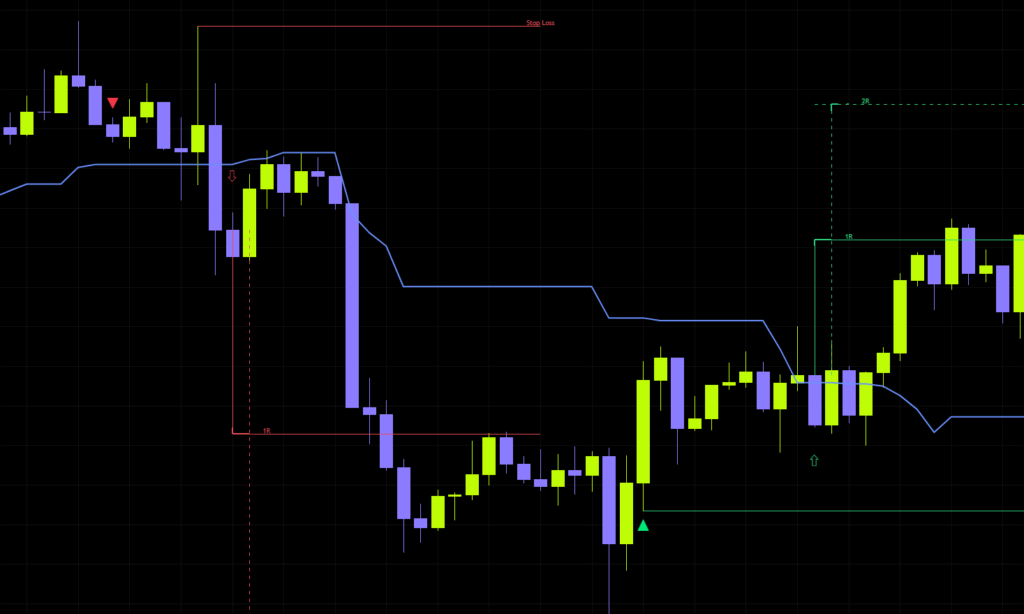
This is where “RSI Bottom/Top Retest Scalper” earns its keep, because the moment an entry fires, your stop and your 1R / 2R targets are drawn for you automatically. Not having to freeze up on “okay, the signal printed, but where does my stop go?” matters more than you’d expect when you’re scalping.
Walking through a signal from start to finish
The quickest way to get your head around “RSI Bottom/Top Retest Scalper” is to follow a short setup step by step. Longs are simply the mirror image.
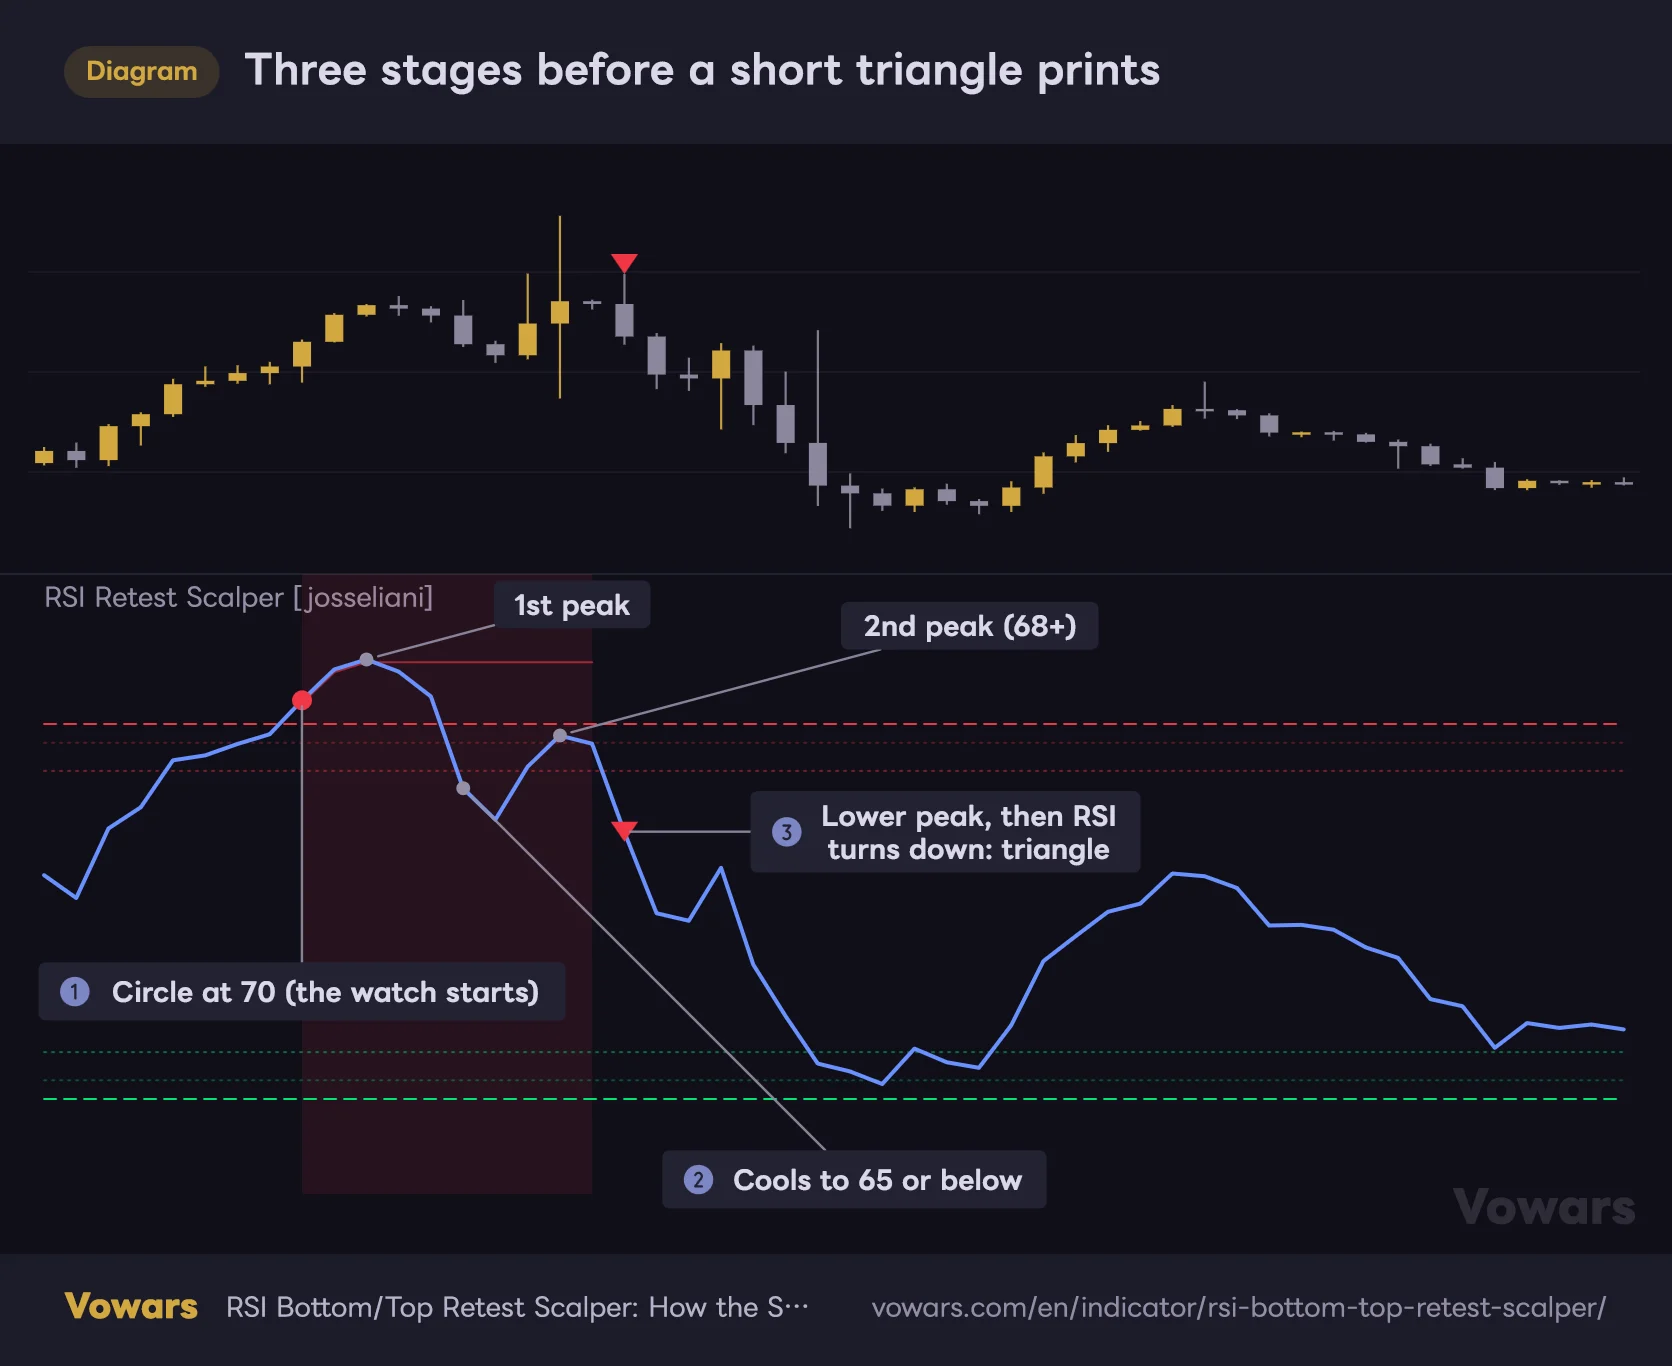
1RSI tags the upper extreme → circle marker
As soon as RSI reaches Upper Extreme (default 70), a red circle prints at that level and the setup arms. The background highlight switches on at the same time.
This circle is not an entry signal. If anything it’s saying “don’t touch it here, the watch starts now.” And if RSI keeps grinding higher from there, the first peak value simply gets overwritten as it goes — push to 75 and 75 becomes the recorded first peak.
2RSI cools off to the cooling level
Next comes the cool-off. Only once RSI drops to or below Upper Cooling Level (default 65) does it move into the phase where it starts hunting for a second peak.
That’s a filter to stop RSI chopping around near 70 from being miscounted as a genuine second peak. In a strong leg up RSI will happily oscillate between roughly 68 and 73, and thanks to this rule you get zero triangles in exactly those conditions.
3The second peak forms → triangle marker
After the cool-off, when RSI turns back up and carves out a peak, it only gets logged as the second peak if all three of these are true.
- It’s a genuine local peak (higher than the bars on either side of it)
- It reaches at least Second Peak Re-Entry Minimum (default 68)
- It sits below the first peak (and by at least the Min Lower High / Higher Low Gap distance)
In other words it’s looking for a lower high that says “we got back into overbought territory, but we couldn’t match the last push”. The key detail is that 75 first and 72 second is perfectly valid, which makes it a far more structural read than just “RSI crossed 70 twice.”
Once that second peak is locked in, the red triangle fires on the bar where RSI actually rolls over. At that point the RSI side of the setup is done.
Three stages before a short triangle prints
RSI hitting 70 does not print a triangle. It needs a cool-off and a second, lower peak, and the triangle only lands on the bar where RSI turns down.
Vowars DE ver.3.9.2
A peak isn’t a peak until the bars to the right of it have closed. That’s why the triangle doesn’t sit on the tip of the peak itself — even on default settings it lands two bars after the peak at the earliest. It’s not a bug, it’s the design choice that keeps anything from being redrawn after the fact. The author spells it out too: local peaks need confirmed bars on their right side.
4Price pushes its body beyond the confirmation line
Triangle or no triangle, there’s still no arrow. This is the point where “RSI Bottom/Top Retest Scalper” starts watching price instead.
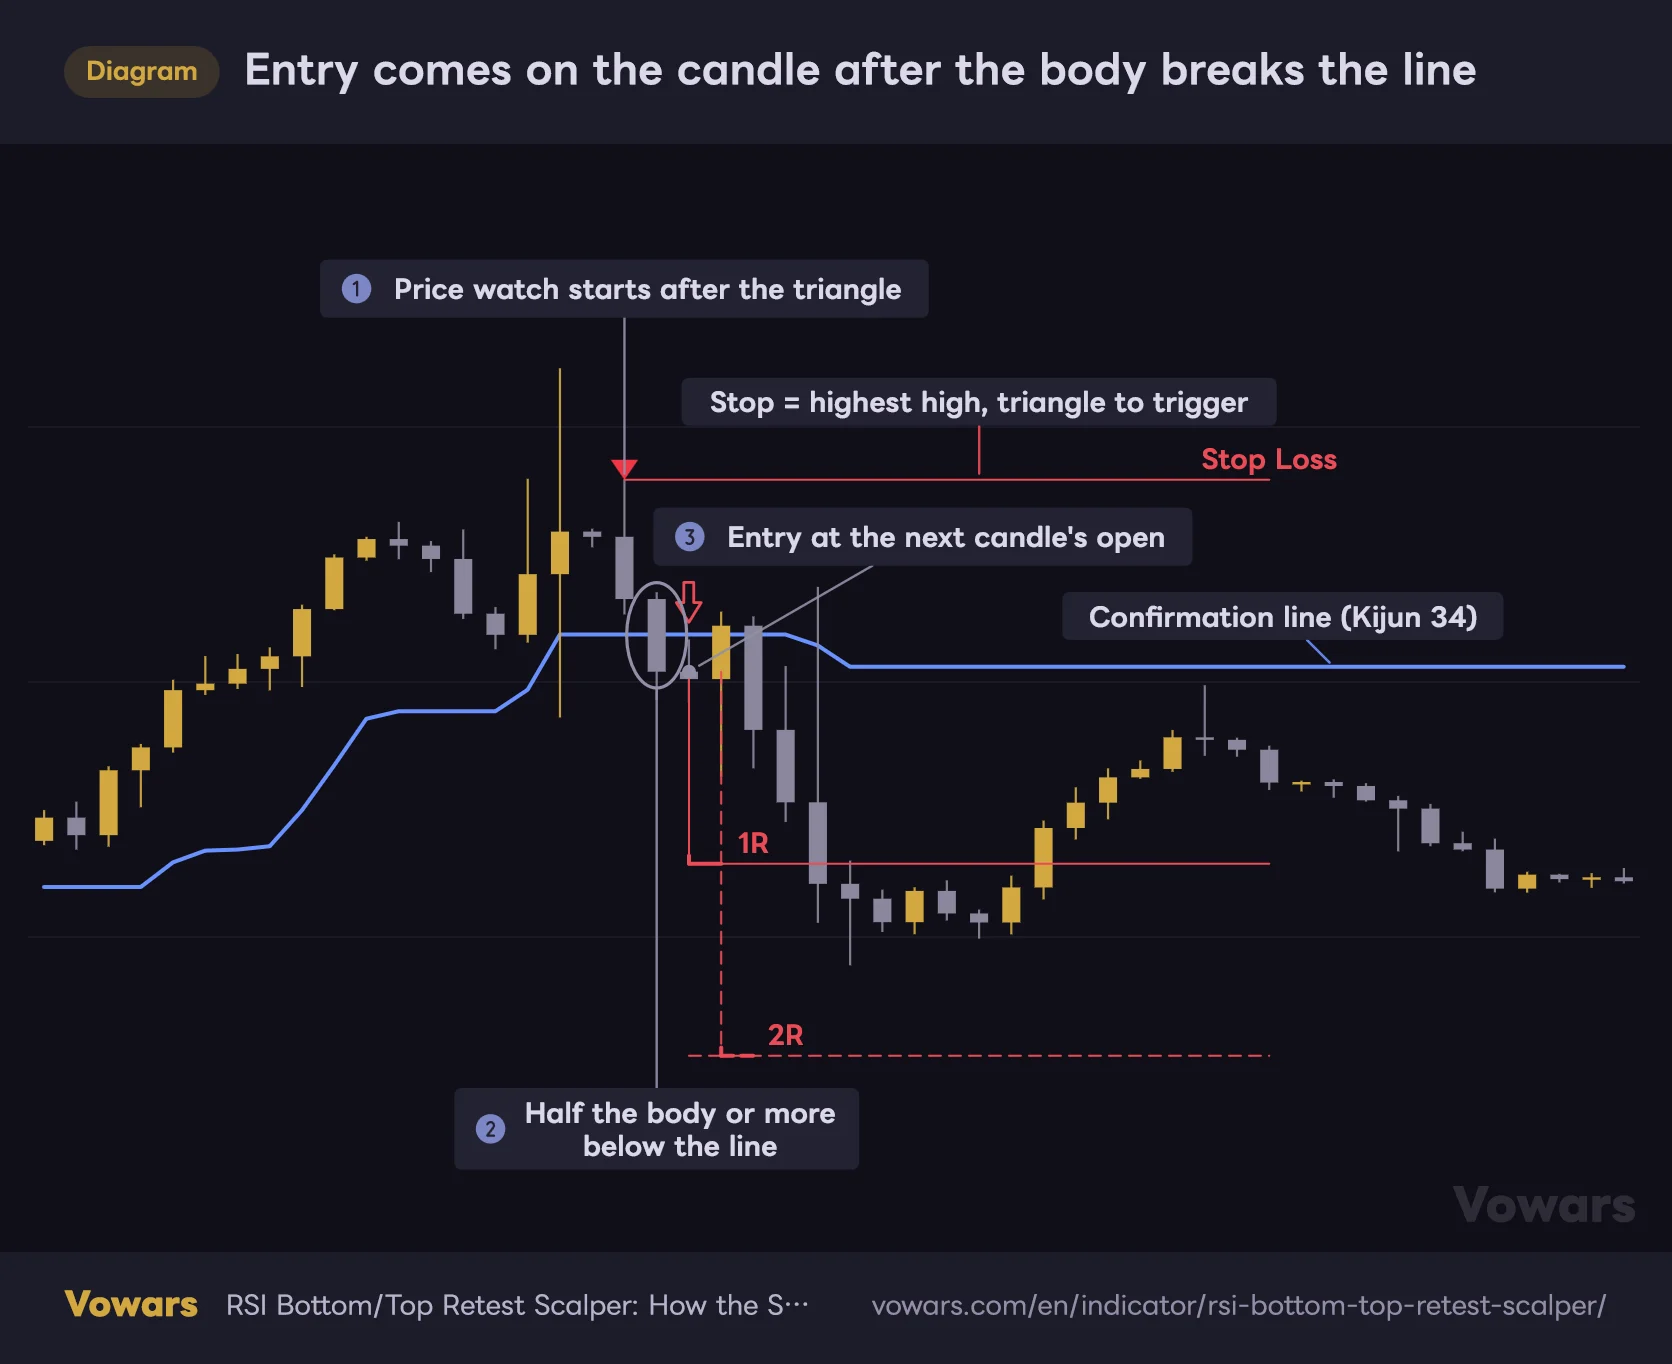
The rule is simple: a candle has to close with at least Body Beyond Line % (default 50%) of its body on the far side of the confirmation line. For a short that means half the body or more below the line, for a long half or more above it. It doesn’t care whether the candle is green or red — only where the body sits.
That search has a shelf life of Entry Search Window (default 40 bars). If no qualifying candle shows up within 40 bars, the setup is quietly binned. When you see a triangle that never turns into an arrow, this is almost always why.
5Entry is taken at the next candle’s open
Here’s the part I really appreciate about “RSI Bottom/Top Retest Scalper”. The candle that broke the line is strictly the trigger candle — it is never used as the entry price.
The hollow arrow prints on the following candle, and the entry price is that candle’s open. So there’s none of that fantasy math where it waits for a candle to close and then pretends you got filled at the low of it. It lines up with how you’d actually place the order by hand, which is why the 1R and 2R levels on screen aren’t just decoration.
How the Stop Loss, 1R and 2R are derived
The stop is normally placed at the highest high (or lowest low for longs) printed between the triangle bar and the line-break candle. It’s using the spot where price actually got rejected, so the logic behind it is about as honest as it gets.
That said, if that high sits so close to the entry that the risk would be razor thin, it automatically falls back to an ATR-based stop instead. Think of it as a safety valve against getting wicked out instantly. The 1R and 2R are then calculated mechanically from the confirmed entry price and that risk distance, and extend to the right for Trade Level Length (default 18 bars).
Entry comes on the candle after the body breaks the line
After the triangle, the trigger is a candle with half or more of its body below the confirmation line. Entry is the next candle's open, and the stop plus 1R and 2R are drawn at the same time.
Vowars DE ver.3.9.2
As the author states outright, 1R and 2R are planning references only, and there’s no guarantee price ever gets there. The line being drawn doesn’t mean the 2R is banked — treat it as a yardstick for asking whether this particular trade is even worth holding for 2R.
When a setup gets cancelled mid-flight
The background highlight was on, and then at some point it just vanished. There’s a clear reason for that — “RSI Bottom/Top Retest Scalper” has invalidation rules built in.
| Type of invalidation | Trigger | What it means |
|---|---|---|
| Opposite extreme hit | RSI reaches the lower extreme while a short setup is live | Character of the market has flipped entirely, so the short hunt is called off |
| Timeout | 40 bars pass since the first extreme | Stops stale setups from hanging around forever |
| Midline abort | RSI crosses back below 50 (off by default) | Momentum is considered fully reversed, so the setup is scrapped |
| First peak updated | RSI clears the first peak again after cooling off | A fresh circle prints and the whole count starts over |
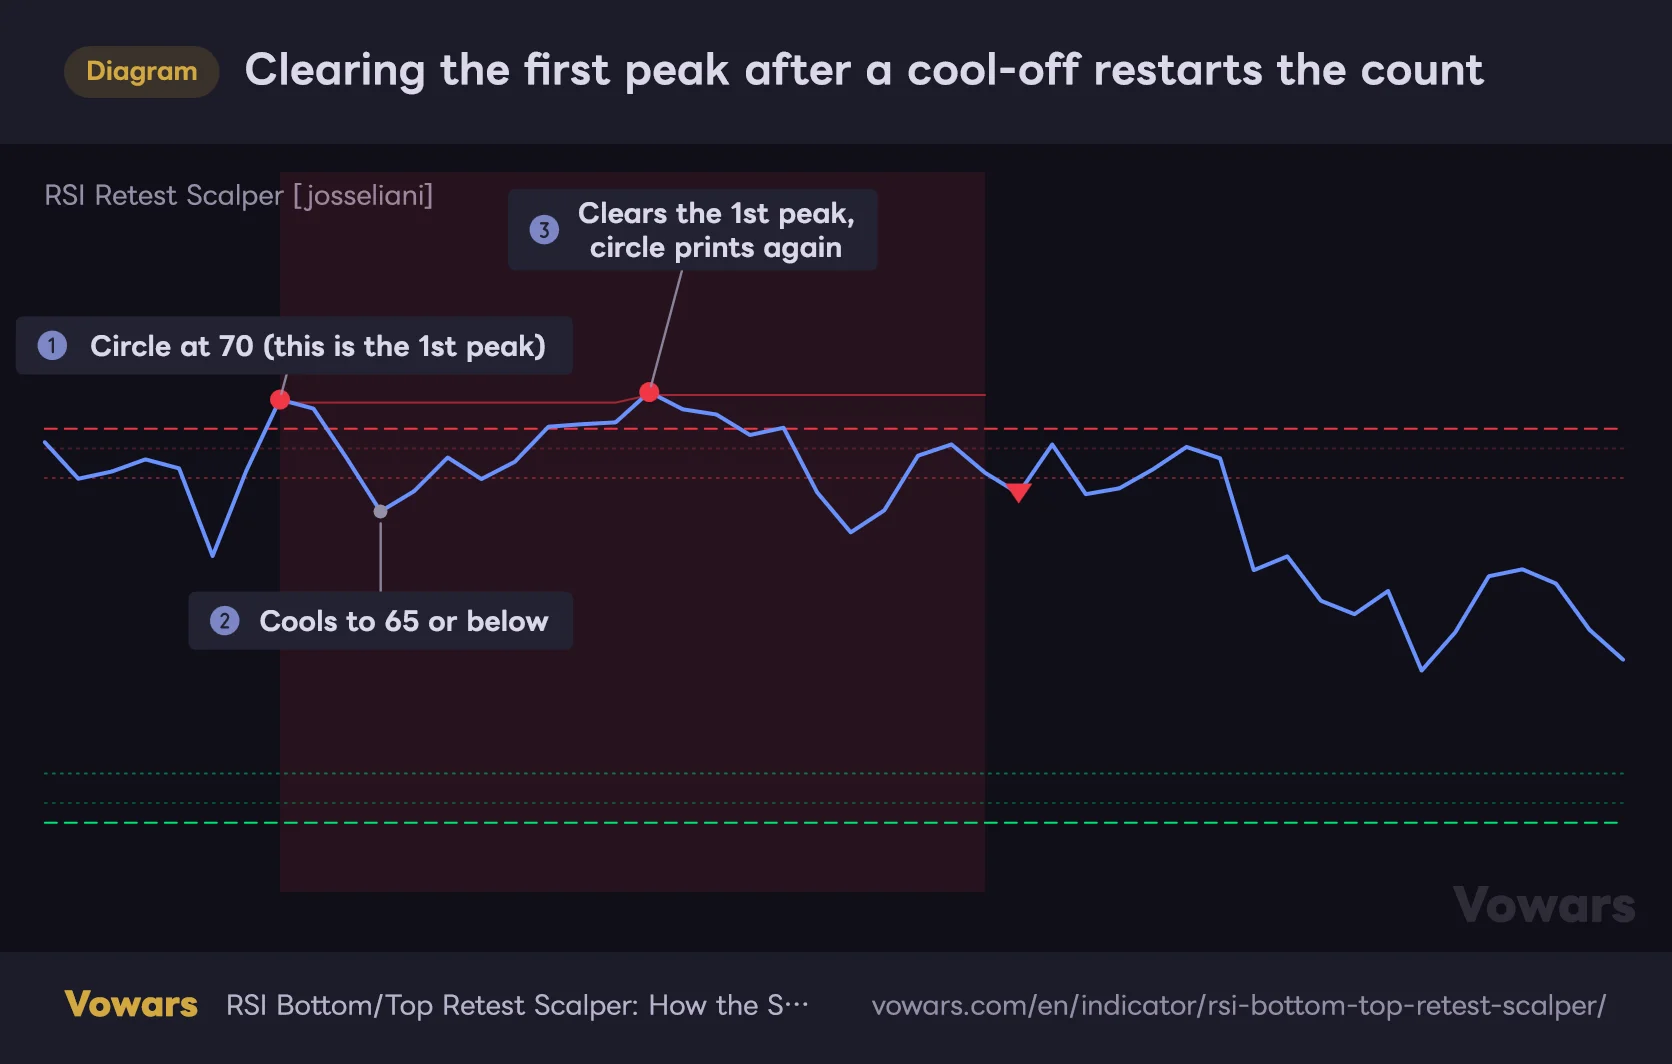
That fourth one is worth committing to memory. If RSI clears the first peak again after cooling off, a new circle prints and the count starts over from scratch. The “second peak” has to be lower than the first, no exceptions.
Clearing the first peak after a cool-off restarts the count
Even after RSI cools below 65, if it then climbs past the first peak, that is not treated as a second peak. A new circle prints and the process starts over.
Vowars DE ver.3.9.2
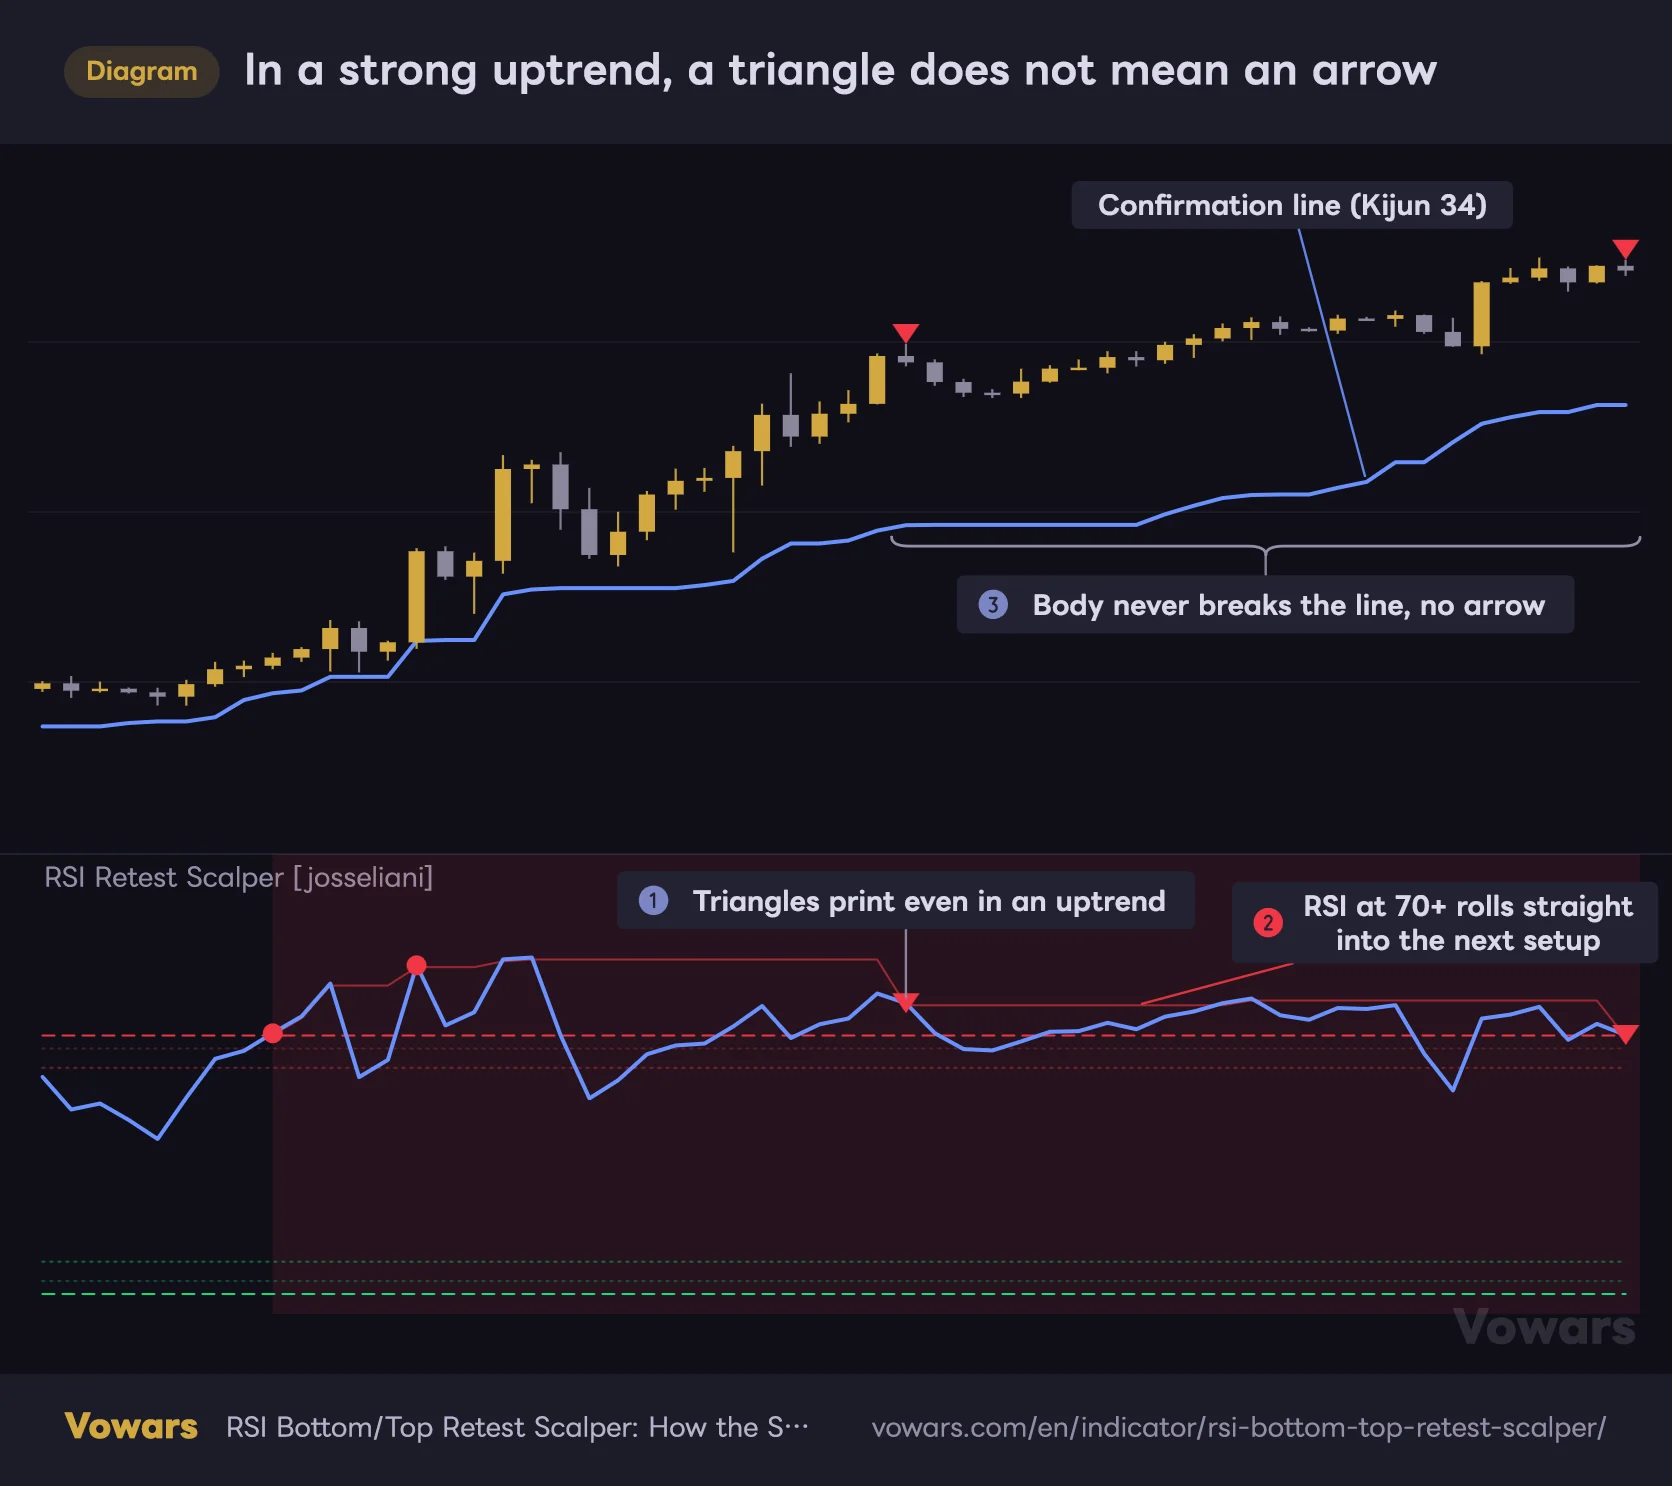
That said, this doesn’t wipe out every triangle in a strong trend. If RSI builds a peak that stays under the first one, the triangle still prints, and if RSI is at 70 or above on that bar, the next setup arms right there with no new circle. What ultimately stops counter-trend trades in a trend is the price confirmation, not the RSI side. We’ll look at that on a chart in the “Where it works and where it struggles” section.
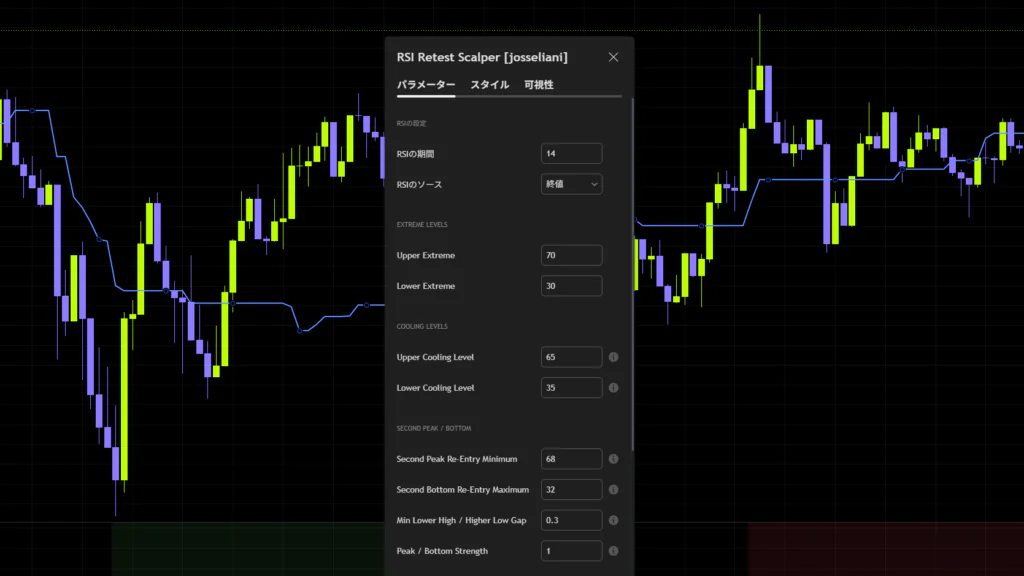
A closer look at the settings
RSI and level settings
| Setting | Default | Suggested | Effect |
|---|---|---|---|
| RSI Length | 14 | 14 (7–9 works on the 1m) | Shorter reacts faster and produces more circles and triangles. Longer smooths things out and signals dry up fast |
| RSI Source | close | close | Price input for the calculation. Only switch to something like hl2 if you want to cut down wick influence |
| Upper Extreme | 70.0 | 70 (75 on high-volatility crypto) | Arming level for short setups. Raise it and setups arm less often, filtering the signal pool overall |
| Lower Extreme | 30.0 | 30 (25 is worth testing) | Arming level for long setups. Lower it and you only pick up genuinely oversold conditions |
| Upper Cooling Level | 65.0 | 60–65 | Lower demands a deeper pullback and stretches the gap before the second push. Raise it and even small wobbles advance the count |
| Lower Cooling Level | 35.0 | 35–40 | Raise it to demand a proper bounce before the second bottom counts |
The cooling levels are where your fakeout filtering really lives. If you feel like you’re getting too many triangles, drop Upper Cooling Level to 60 first. That leaves only the peaks that came after a proper pullback, and the quality difference is obvious.
Second peak and bottom settings
| Setting | Default | Suggested | Effect |
|---|---|---|---|
| Second Peak Re-Entry Minimum | 68.0 | 65–68 | Floor for the second peak. Lower it and shallower bounces still print triangles, so signal count rises |
| Second Bottom Re-Entry Maximum | 32.0 | 32–35 | Ceiling for the second bottom. Raise it to loosen the requirement and get more signals |
| Min Lower High / Higher Low Gap | 0.3 | 0.3–1.0 | Minimum separation between the first and second push. Larger values only accept clearly defined lower highs |
| Peak / Bottom Strength | 1 | 1 (2 on noisy symbols) | How strict the peak and bottom detection is. Higher only picks genuine turning points, but delays the triangle accordingly |
The cool-off check works so that whichever of the cooling level and the re-entry level is stricter ends up being the one that applies. On defaults that effectively means 65. Knowing that pushing the cooling level above the re-entry level won’t actually loosen anything will save you some head-scratching before you start tweaking.
Entry confirmation line settings
| Setting | Default | Suggested | Effect |
|---|---|---|---|
| Use Price Entry Confirmation | On | On | Turn it off and you lose the arrows plus SL / 1R / 2R, leaving just the RSI circles and triangles |
| Body Beyond Line % | 50.0 | 50 (70–80 to be picky) | Higher only accepts candles that punched decisively through the line. Fewer arrows, but higher conviction |
| Confirmation Line | Kijun | Kijun / ALMA / EMA | Thirteen options. The balance between responsiveness and smoothness effectively sets your trading style |
| Line Length | 34 | 34 (around 20 on the 1m) | Shorter hugs price and produces more arrows. Longer makes the break requirement tougher |
| Line Source | close | close | Input for the moving average based lines. No effect on Kijun, which uses highs and lows |
| ALMA Offset | 0.85 | 0.85 | Only active with ALMA. Closer to 1 weights recent price more heavily and speeds up the response |
| ALMA Sigma | 6.0 | 6.0 | Smoothness of the ALMA. Higher makes it flow more gently |
| Kalman Process Noise | 0.01 | 0.01 | Only active with Kalman. Higher makes the line track price changes faster |
| Kalman Measurement Noise | 0.10 | 0.10 | Higher smooths the line more aggressively |
| Entry Search Window | 40 | 20–40 | Grace period in bars from triangle to arrow. Shorten it to only catch moves that happen right after the triangle |
That spread of confirmation lines is a big part of what gives “RSI Bottom/Top Retest Scalper” its personality. You get the staples like EMA, SMA and WMA, then HMA, DEMA, TEMA, ZLEMA, KAMA, Kalman and ALMA, plus the default Kijun — thirteen in total. The author explains that Kijun 34 is a personal favourite for 5m and 15m scalping, and that on the 1m a shorter, faster ALMA is often the pick instead.
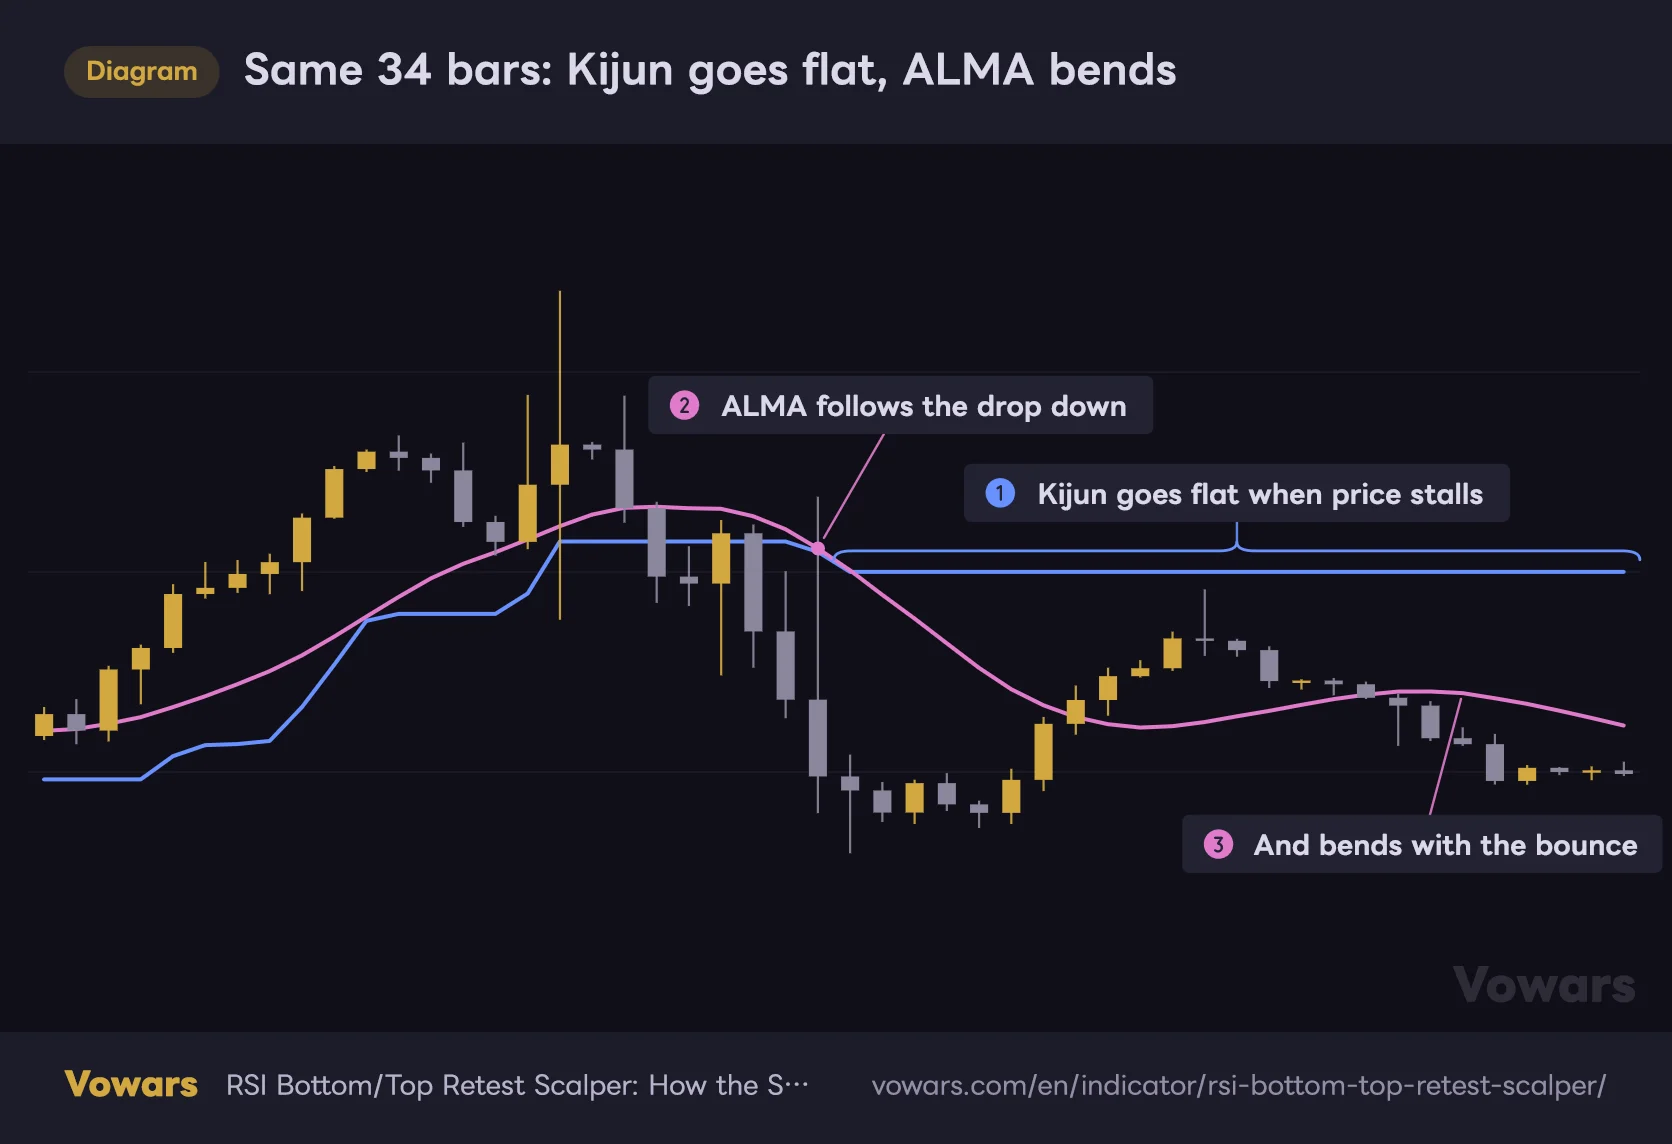
Because Kijun takes the midpoint of the highest high and lowest low over a set period, it flattens out completely when price goes quiet and acts as the middle of the range. That willingness to just sit still is exactly what you want from a reference line for fading moves. If you’d rather have something that reacts to every twitch, ZLEMA or Kalman do that job; if you want to sit back, SMA or RMA are the slower end of the scale.
Same 34 bars: Kijun goes flat, ALMA bends
Switching the confirmation line changes when arrows fire. Kijun is the midpoint of the high and low, so it flattens out easily, while ALMA weights recent prices and tracks them quickly.
Vowars DE ver.3.9.2
Signal confirmation, display and trade markup
| Setting | Default | Suggested | Effect |
|---|---|---|---|
| Reversal Confirmation Bars | 1 | 1–2 | How many consecutive bars RSI must move in the reversal direction before the triangle prints. Setting 2 delays it but raises confidence in the turn |
| Confirm Signals on Bar Close | On | On | Evaluates only on closed bars. Turn it off and signals will flicker on and off mid-candle |
| Abort on Midline Cross | Off | On if you mostly trade ranges | Scraps the setup the moment RSI crosses 50. For anyone bothered by the background highlight lingering |
| Bearish Abort Level (RSI ≤) | 50.0 | 45–50 | RSI level at which a short setup is discarded |
| Bullish Abort Level (RSI ≥) | 50.0 | 50–55 | RSI level at which a long setup is discarded |
| Max Search Bars (0 = off) | 40 | 30–40 | How many bars past the first extreme it keeps hunting for the second. Zero means unlimited, but stale setups then hang around |
| Show Trade Markup (SL / 1R / 2R) | On | On | Turn it off for arrows only and a much cleaner chart |
| Trade Level Length | 18 | 10–18 | How far right the SL, 1R and 2R extend. Shorten it to stop older levels overlapping |
| Signal Display | Both | Both | Toggles circles and triangles. You can also run background-only and use it purely for market context |
| Icon Size | Normal | Normal | Size of the markers and arrows. Go Small if things get crowded on low timeframes |
| Show Second Signal on Price Chart | On | On | Mirrors the triangle onto the price chart. Off keeps it in the RSI pane only |
| Highlight From First Extreme | RSI Pane Only | RSI Pane Only | Scope of the background highlight. RSI Pane + Chart tints price as well, making an armed setup impossible to miss |
Settings to run depending on how you trade
Scalping the 1-minute chart
As the author points out, dropping down a timeframe gets you more signals, but it gets you more noise right along with them. On the 1m, cut Line Length to around 20 and swap the confirmation line for something quick off the mark like ALMA or ZLEMA, and your arrows stop arriving late. The trade-off is that the whole style turns more aggressive, so stop management has to be that much tighter.
Day trading the 5m to 15m
This is “RSI Bottom/Top Retest Scalper” in its element. The defaults (Kijun 34, 50% body) are well balanced here, and there’s no shame in just starting there. If the signals feel too frequent, push Body Beyond Line % up to 70 and you’re left with only the candles that drove hard through the line.
When cutting fakeouts is the priority
- Raise Min Lower High / Higher Low Gap to around 1.0 so the lower high has to be unmistakable
- Set Peak / Bottom Strength to 2 to accept only the more convincing peaks and bottoms
- Set Reversal Confirmation Bars to 2 for one extra bar of confirmation on the turn
Change all three at once and the signals dry up so badly you can’t even review them properly, so the trick is to move one at a time and compare what changes on the chart.
Where it works and where it struggles
Conditions it handles well
- Ranges with real width, played from edge to edge
- The exhaustion phase after a sharp spike or flush
- Buying the dip or selling the rally inside an existing trend
- Sessions with enough volatility to work with (London, New York)
- Price approaching a key daily level
Conditions it struggles in
- Relentless one-way trends
- Dead volatility where price just coils around the confirmation line
- The whipsaw right after a news release
- Thin weekend crypto sessions
Watching it on the Bitcoin 5-minute, during stretches where price swings around but stays inside a defined range, the circle → triangle → arrow sequence flows exactly as intended and you visibly get more trades reaching 1R.
When a big break fires and price takes off in one direction, though, you can get a few triangles printing while RSI stays pinned high. Honestly, the first time I saw it I tensed up — a short signal in the middle of a rally? But as long as price holds above the confirmation line, no candle closes with half its body below it, so it never gets as far as an arrow. “Triangle but no arrow” reads as a market you shouldn’t be in. Jump the gun and short the triangle, and you’ve switched off that safety catch yourself.
In a strong uptrend, a triangle does not mean an arrow
The RSI triangle can still print inside a strong trend. What holds back the counter-trend arrow is the second condition: price refusing to break the confirmation line.
Vowars DE ver.3.9.2
Strengths and weaknesses
Strengths
- Structurally prevents the classic mistake of fading the first RSI extreme
- Two separate layers of confirmation, oscillator and price, so fakeouts drop off
- Stop, 1R and 2R drawn automatically and usable as-is for planning
- Entry priced at the next candle’s open, which is realistic
- Thirteen confirmation lines to match the symbol and timeframe you trade
- Background highlight makes “armed or not” obvious at a glance
- Alerts available for both the second signal and the confirmed entry
Weaknesses
- Strict conditions mean few signals and a lot of waiting
- Peaks need bars to their right to confirm, so the triangle is structurally late
- By the time the arrow prints you’ve given up part of the initial move
- It’s fading the move, so losses can run in a strong trend
- Plenty of inputs to tune, which is easy to get lost in early on
- No built-in performance stats, so reviewing it is mostly done by eye
Things to watch out for, and how not to use it
Don’t trade off the circle alone
At the risk of repeating myself, the circle is a “start watching” flag. Take a trade there and you’ve thrown away the entire reason for adding this thing to your chart. The value of “RSI Bottom/Top Retest Scalper” is in the wait between the circle and the arrow.
On repainting
On default settings everything is evaluated only once the bar has closed, so a circle, triangle or arrow printed on a closed bar won’t disappear later. The entry price uses the next candle’s open as well, so there’s no peeking at data that wasn’t available yet. Do note that turning Confirm Signals on Bar Close off puts you in a state where signals flicker on the forming candle. I wouldn’t run it that way.
One more thing people mix up is the difference between lag and repainting. The triangle appears a few bars past the tip of the peak, but that isn’t something being rewritten after the fact — it’s simply waiting for the peak to confirm. Scrolling back through history it’s easy to get the illusion that the triangle landed right on the high when in reality it came later, so when you’re reviewing, step through it bar by bar with Bar Replay to be sure.
Don’t skip the higher timeframe read
This goes for every mean-reversion tool, but arrows that point against the higher timeframe trend are best either skipped outright or taken profit on early. “RSI Bottom/Top Retest Scalper” has no awareness of anything above the chart it’s running on, so a long arrow that fires inside a heavy daily downtrend has to be treated as a short bounce play and nothing more.
Pairing it with other indicators
| Pairing | Its job | What you get out of it |
|---|---|---|
| Higher timeframe moving average (200 EMA etc.) | Market context | Filters out counter-trend arrows so you’re only buying dips and selling rallies with the trend |
| Horizontal levels / previous day high and low | Backing up the rejection | Works as a filter so you only take arrows that fire at levels that actually matter |
| Volume-based indicators | Confirming the push | Keeps you out of hollow line breaks that happen on thin participation |
| ATR-based volatility tools | Reading the temperature | Lets you skip dead sessions and pick spots where 1R is realistically reachable |
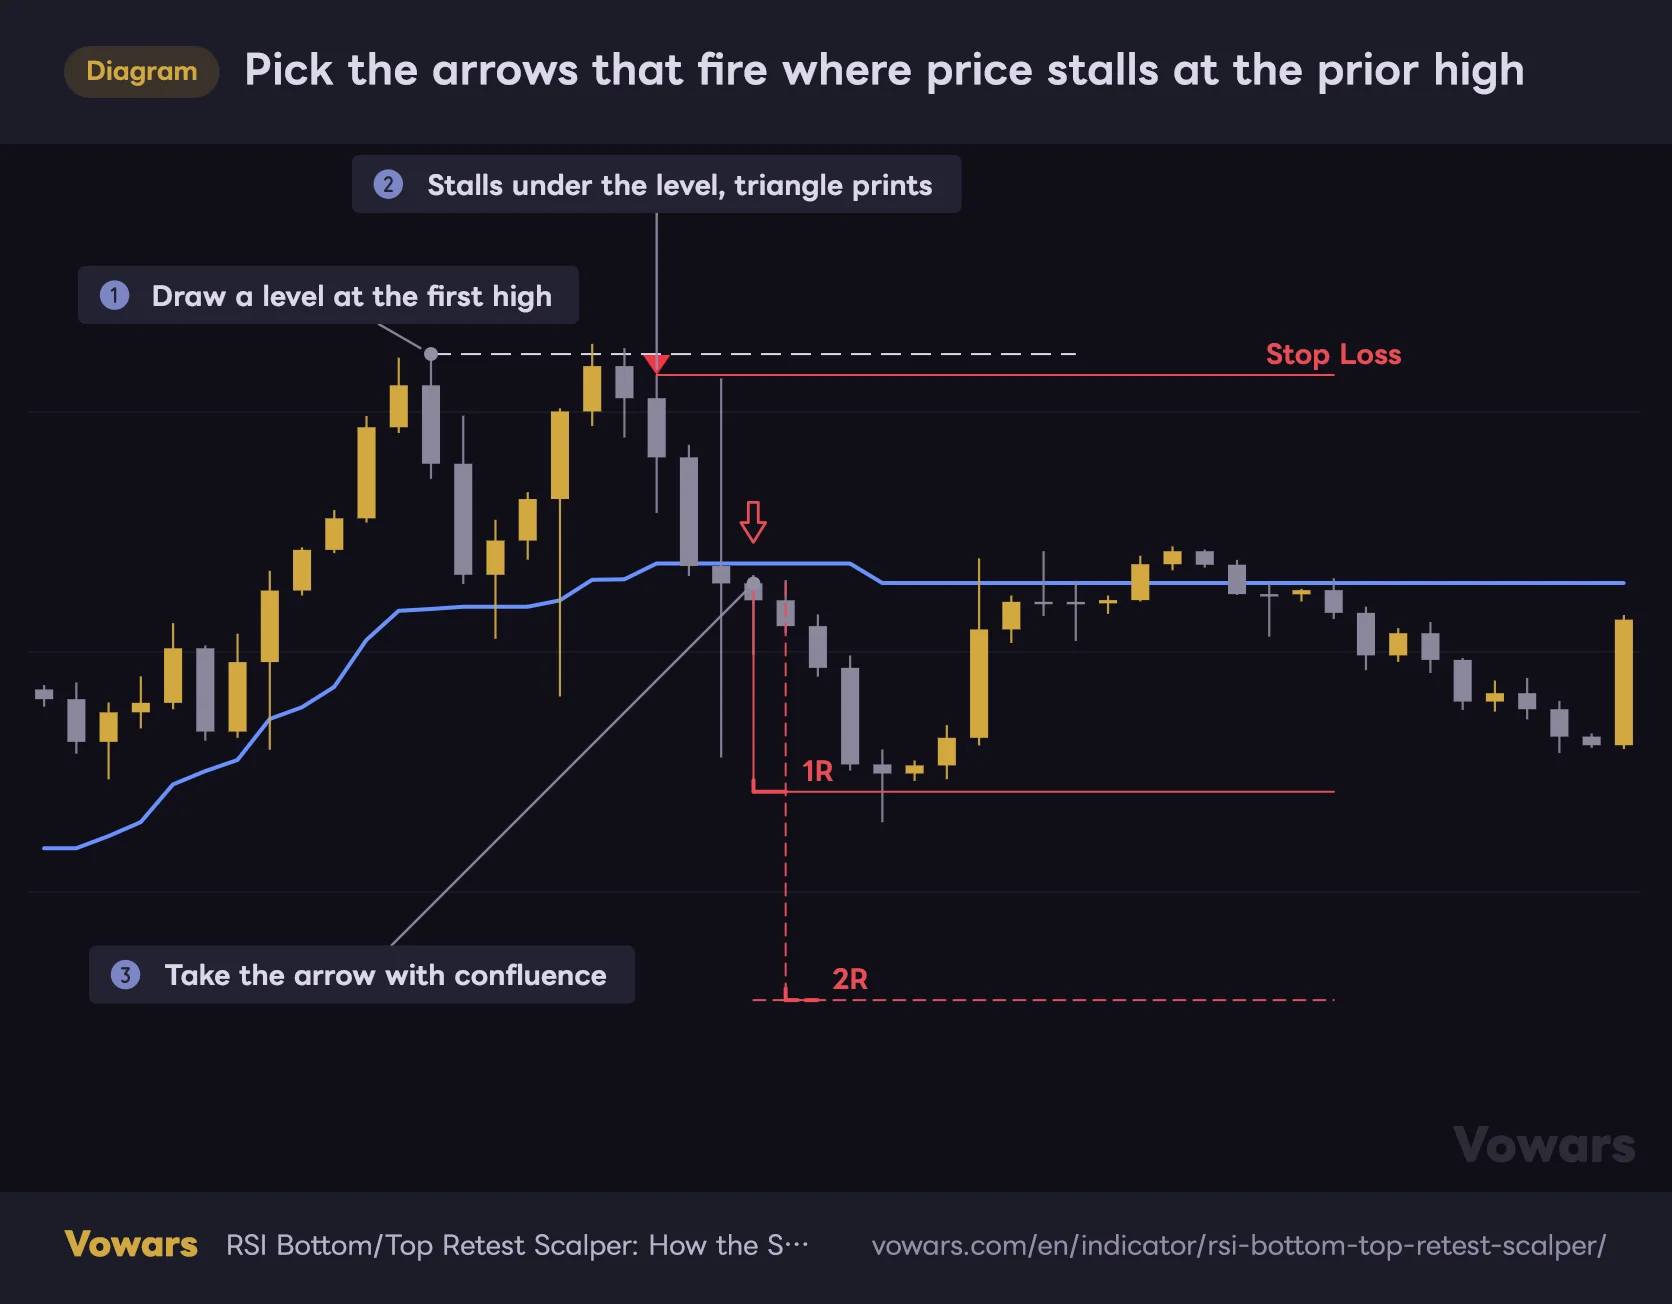
The pairing I rate most is plain horizontal levels. Instead of taking every arrow that prints, adding the single question of “is this arrow firing at a level that means something?” changes the hit rate noticeably. On instruments with clearly reactive levels — gold, the major indices — that combination tends to land especially well.
Pick the arrows that fire where price stalls at the prior high
The basic habit is checking whether anything else lines up where the arrow fires. The easiest and best-matched add-on is a horizontal level at a prior high or low.
Vowars DE ver.3.9.2
Setting up alerts
“RSI Bottom/Top Retest Scalper” ships with four alert conditions.
- Bearish second retest signal
- Bullish second retest signal
- Confirmed short entry
- Confirmed long entry
The practical way to run it is a two-stage setup: the second signal tells you to pull the chart up, the confirmed entry tells you to actually place the order. Getting pinged at the triangle means you can follow the price confirmation with your own eyes from there and never miss the arrow. Not having to sit glued to the screen is a serious help when you’re scalping.
Final verdict: who is this actually for
“RSI Bottom/Top Retest Scalper” is the kind of indicator that makes most sense to anyone who’s been burned fading RSI. It takes one single rule — don’t trade the first extreme — and mechanises it thoroughly across four stages: extreme, cool-off, lower high, price confirmation. The result is that it makes the decision to stay out for you, and for me that’s the biggest draw.
Add in the automatic stop and 1R / 2R levels and a signal stops being just an arrow — it arrives as a single trade idea with a risk-reward attached. That’s a clear step up from the kind of tool that throws a signal on your chart and leaves the rest entirely to you.
It fits traders scalping or day trading reversals on the 5m to 15m who want their stop and target defined before they click the button. If you want to be in and out several times a day, or you’re primarily a trend follower, the sheer scarcity of signals is going to feel thin.
The decision on whether to run it comes down to one thing: if you’ve been thinking “I’d like to fade RSI with some actual rules attached”, it’s well worth a look. Leave it on defaults to start with, drop it on the symbol and timeframe you already watch, and follow the circle → triangle → arrow sequence through a handful of times. If the waiting feels acceptable to you there, this is an indicator you’ll keep on the chart for a long time.