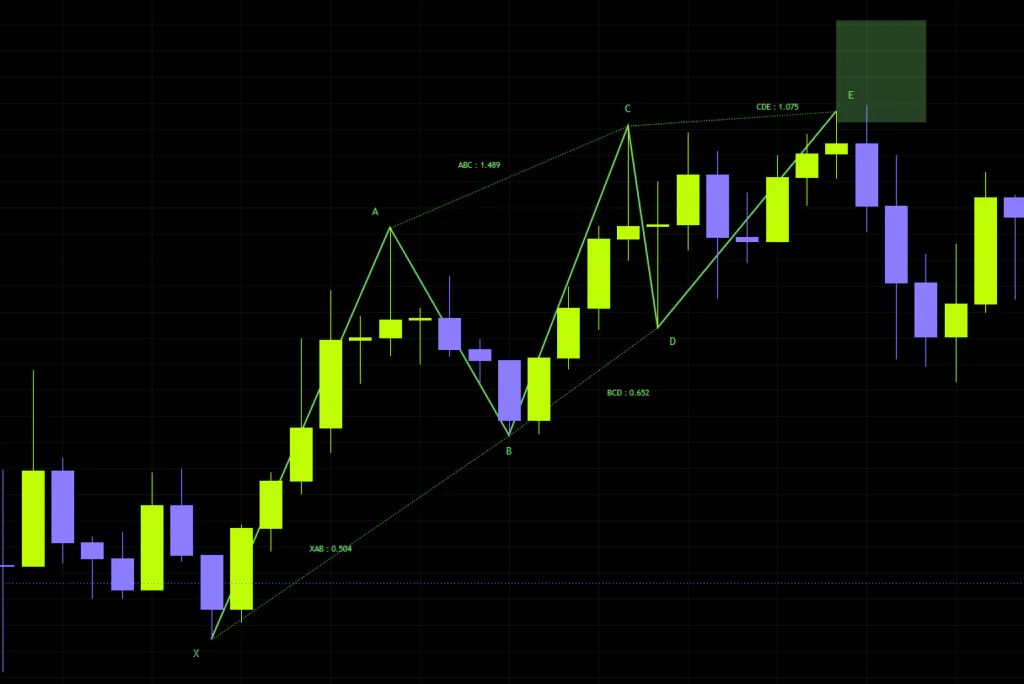


There’s no shortage of harmonic pattern indicators out there. Gartley, Butterfly, Bat, Crab — you name it. The problem is that they all run on fixed, hard-coded ratios, and almost none of them let you touch the rules. You look at a ratio and think “I’d really like to loosen that up a bit,” and there’s nothing you can do about it. The tool that finally scratches that itch is “BYO Pattern V1”.
The name says it all — “Build Your Own Pattern.” You decide which ratios matter, and within what range they have to be satisfied for something to count as a pattern. That’s the whole pitch. I’ve been running it on Bitcoin charts and poking at every setting, so let’s walk through how it looks on the chart, where the settings actually matter, and the weak spots nobody mentions, with diagrams along the way.
What is “BYO Pattern V1”? An indicator where you define the pattern itself
“BYO Pattern V1” is an open-source pattern detection indicator published by Trendoscope. In plain terms, it’s a tool that scans the sequence of swing highs and lows on your chart and automatically finds and draws only the shapes that satisfy the Fibonacci ratio conditions you specify. The author states plainly that it’s a detection and visualization tool and does not generate buy or sell signals.
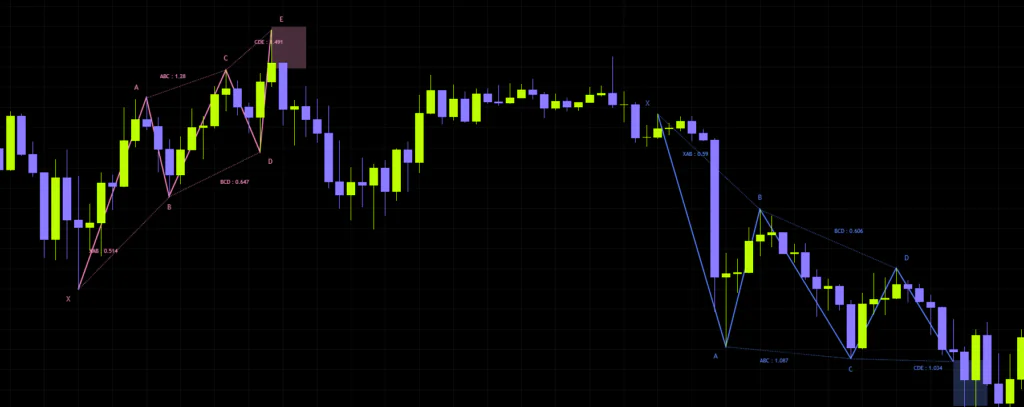
Drop it on the chart and you immediately get a set of colored polylines across Bitcoin’s price history, with “X”, “A”, “B”, “C”, “D” and “E” labels at each turning point. Those are the detected patterns. Out of the box it’s configured to hunt for the classic Three Drives pattern, so the easiest way to get a feel for it is to leave it alone at first and just watch.
When I say “pivot” here, I mean the turning points of the ZigZag — the line that connects alternating swing highs and lows. “BYO Pattern V1” builds on those pivots and checks whether the last 5 or 6 of them sit in the proportions you specified.
It’s a shape where price pushes three times in the same direction, with each thrust and each pullback lining up on Fibonacci ratios. The completion of the third drive is treated as the reversal candidate — it’s one of the oldest reversal patterns around. The defaults in “BYO Pattern V1” are set up to detect exactly this.
Four things land on your chart: a polyline, dotted lines, a PRZ and a table
Let’s start with the visuals. “BYO Pattern V1” draws three elements that make up the pattern itself, plus a table in the bottom-right corner. The three pattern elements make the most sense when you see them together.
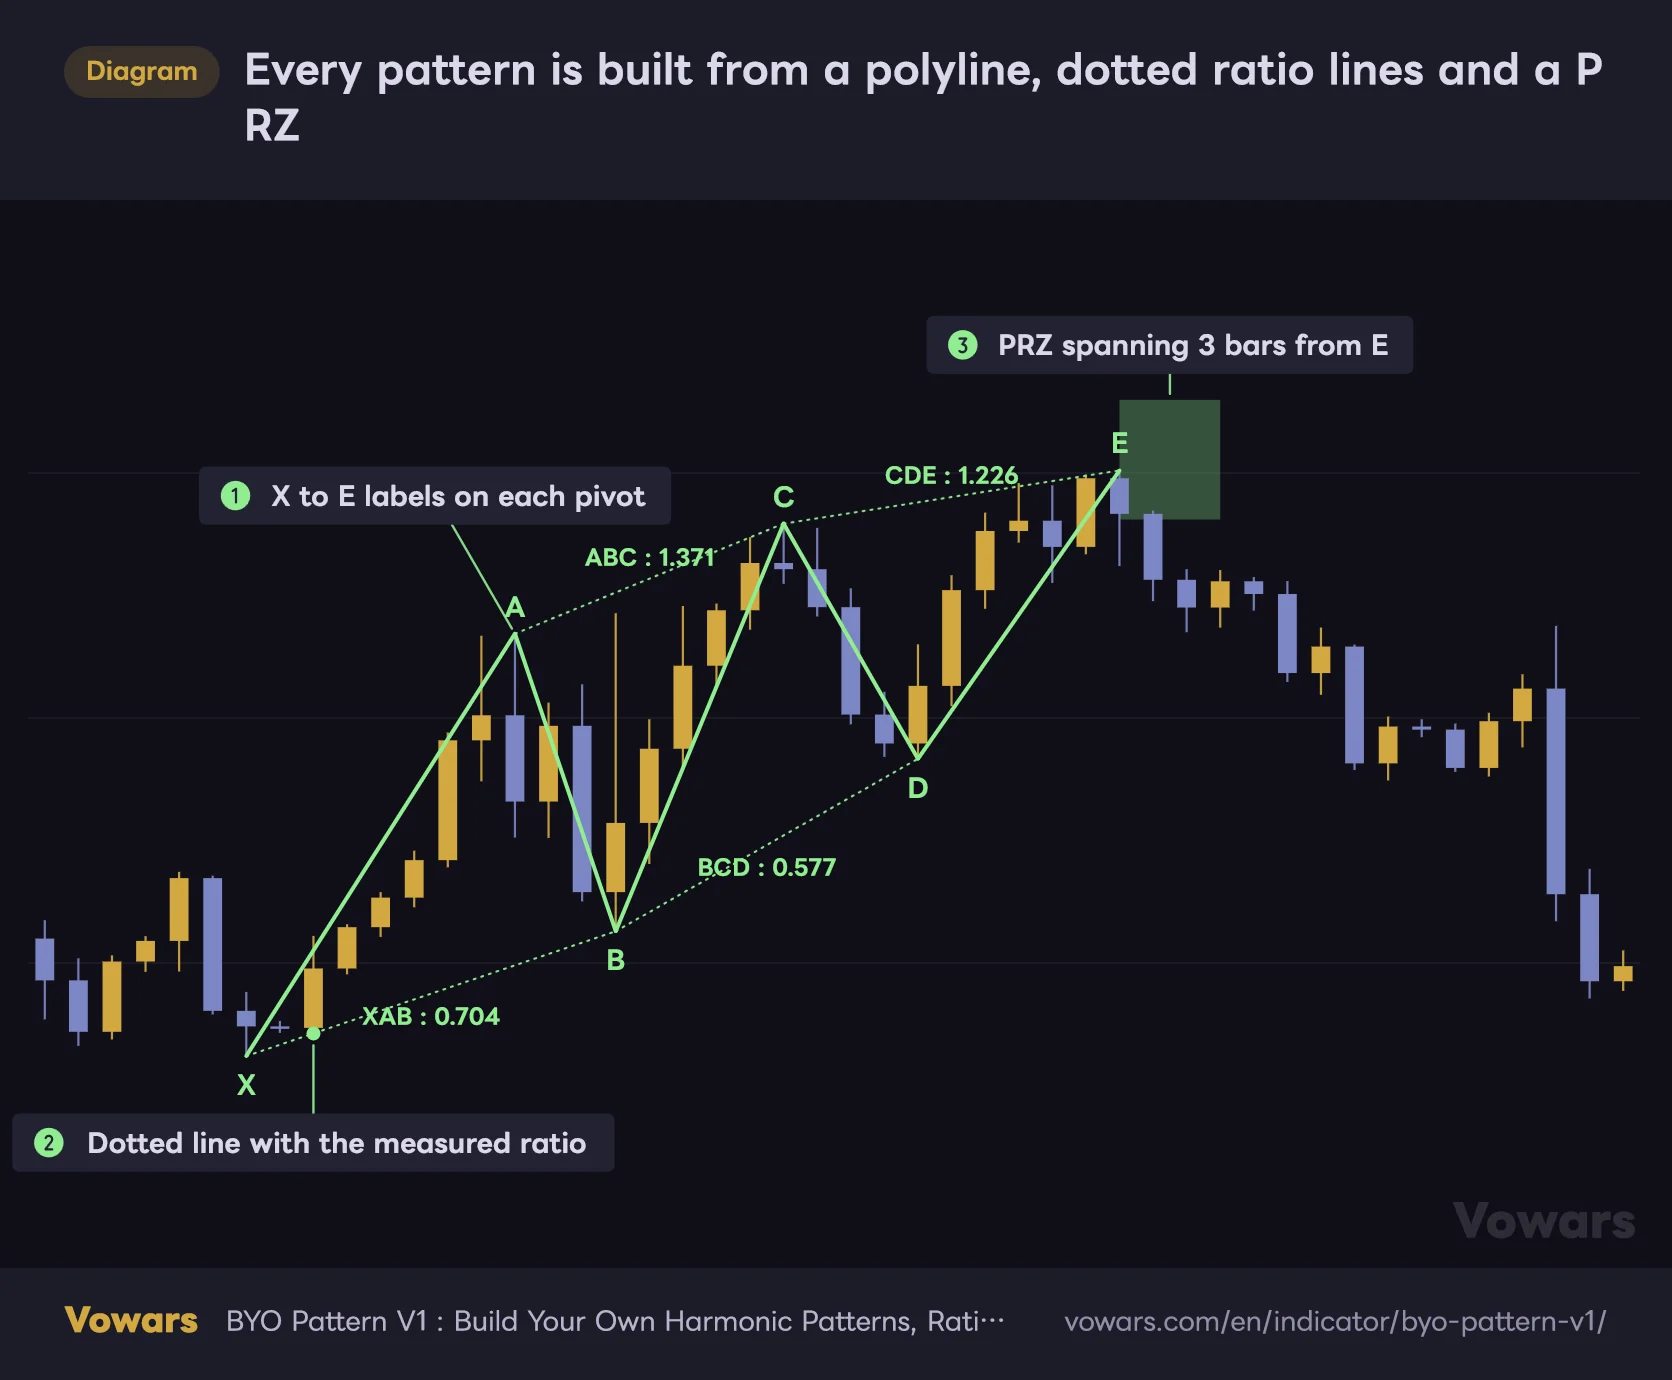
Every pattern is built from a polyline, dotted ratio lines and a PRZ
This is how the default Three Drives setup looks when it fires. All three elements are drawn in the same color.
Vowars DE ver.3.8.0
The pattern polyline and pivot labels
When a qualifying shape is found, the pivots get connected with a thick solid polyline, and each vertex is labeled from oldest to newest: X → A → B → C → D → (E if you’re on 6 pivots). The labels are plain text with no background, in the same color as the line. Five-pivot mode gives you XABCD, six-pivot mode gives you XABCDE.
Here’s the nice touch — when several patterns are found, each one gets its own color. The colors cycle every time a new pattern is found, so even when lines overlap you can follow which leg belongs to which pattern. Sounds minor, but once detections start piling up it’s a lifesaver.
Dotted ratio lines and measured values
For every ratio you’ve enabled, a thin dotted line connects the pivots being measured, with a value like “XAB : 0.704” printed at its midpoint. In other words, the reason the pattern qualified is written right there on the chart.
Personally this is my favorite part. Rather than a tool just announcing “pattern found,” I’d much rather be told “XAB is 0.704, ABC is 1.371 — that’s why this counts.” Numbers you can check beat a black box every time. If the clutter bothers you, switch it off with Ratio Labels.
The PRZ (Potential Reversal Zone)
A semi-transparent box is drawn to the right of the final pivot. That’s the PRZ — the Potential Reversal Zone. It’s back-calculated from whichever terminal ratios you have enabled, and when more than one of them is switched on, the box narrows to where they overlap.
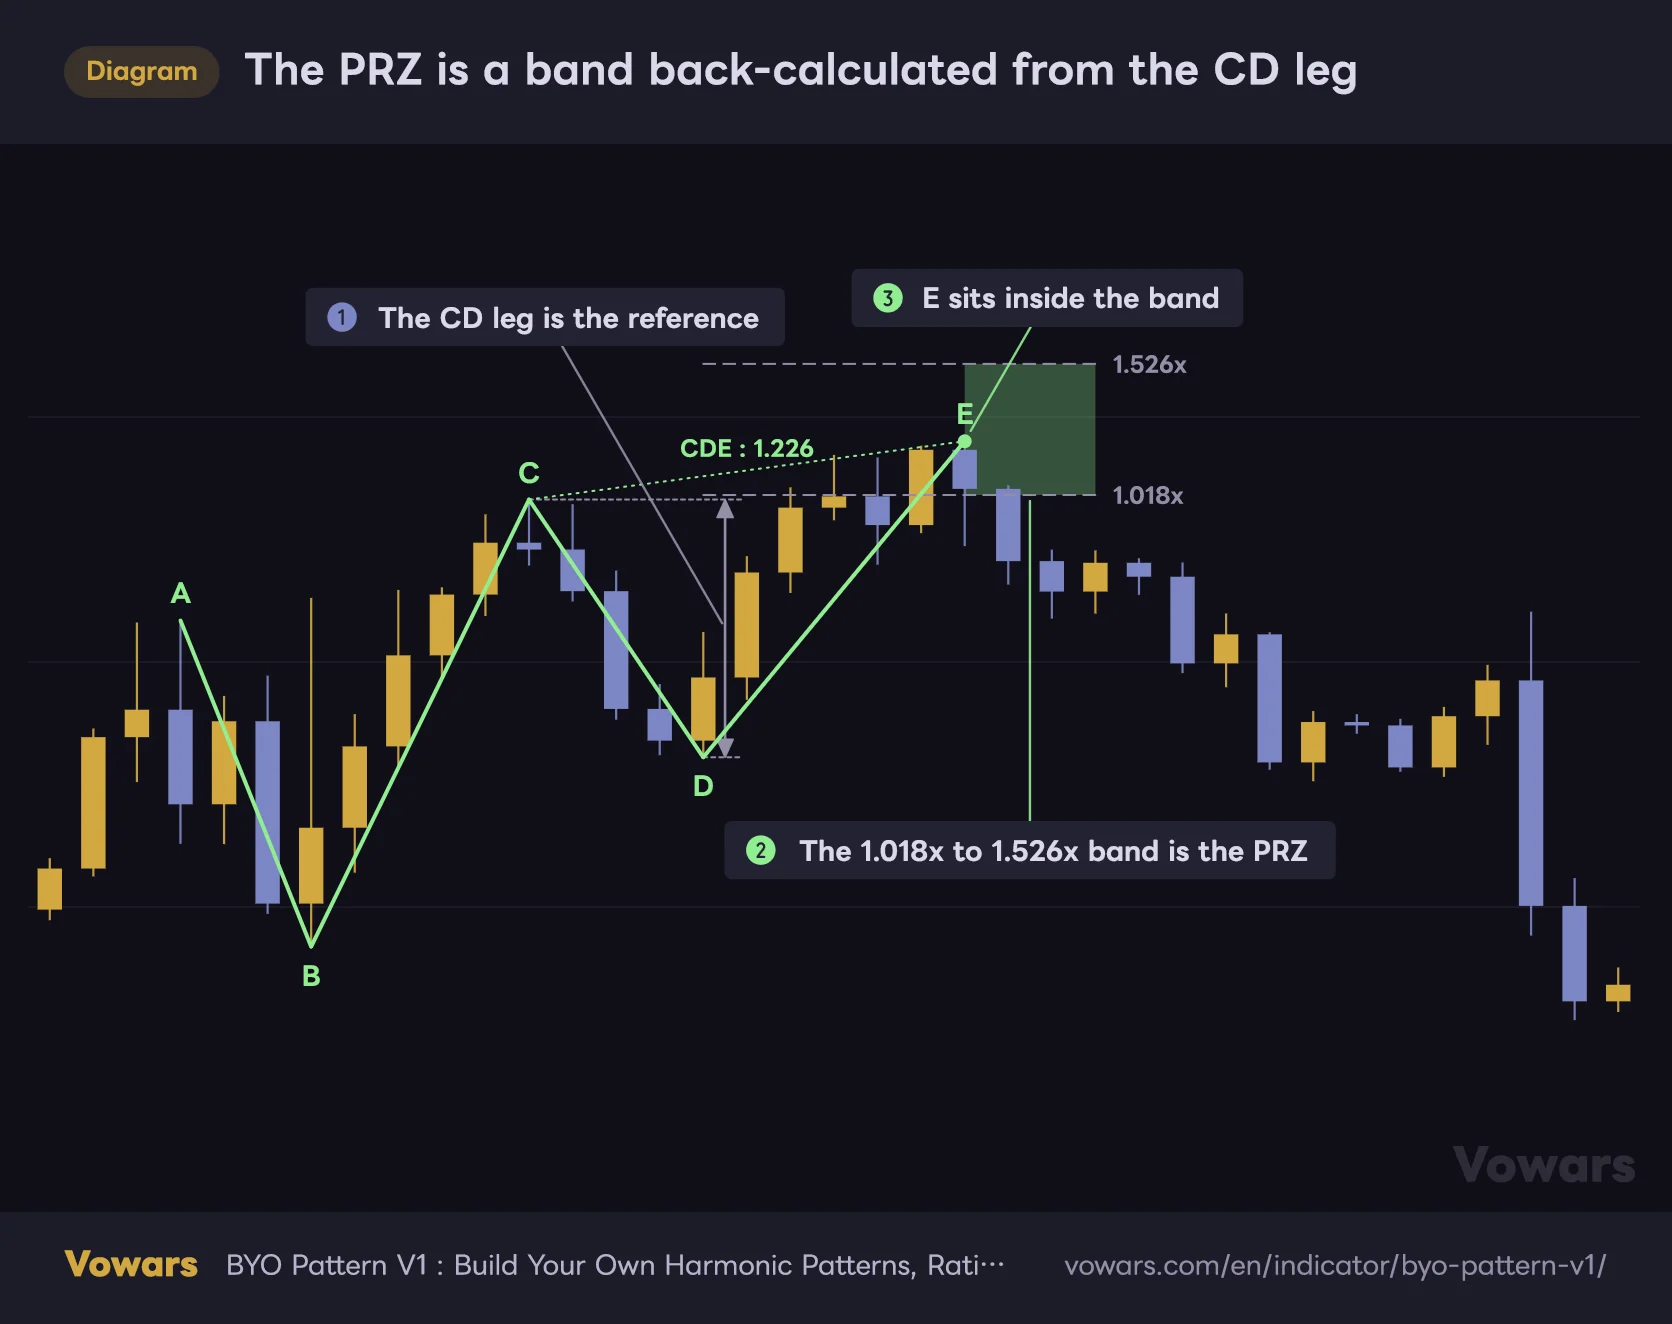
The PRZ is a band back-calculated from the CD leg
With the default CDE setting (1.272, Error Percent 20), the PRZ covers 1.018x to 1.526x of the CD leg.
Vowars DE ver.3.8.0
This is the part people misread, so let me be clear. The PRZ range is exactly the passing range of CDE (or BCD and friends on 5 pivots). And a pattern is only detected when E lands inside that range. So whenever a PRZ is drawn, E is already sitting inside it.
Don’t think of the PRZ as an early heads-up about where price is going. Think of it as a marker confirming that E landed where it was supposed to. The box only runs three bars to the right of the E bar and never stretches to the right edge of the chart.
The summary table
A small table sits in the bottom-right corner. Top to bottom it shows the pattern name, pivot count, each enabled ratio with its tolerance range, and the total number of patterns detected so far (Identified).
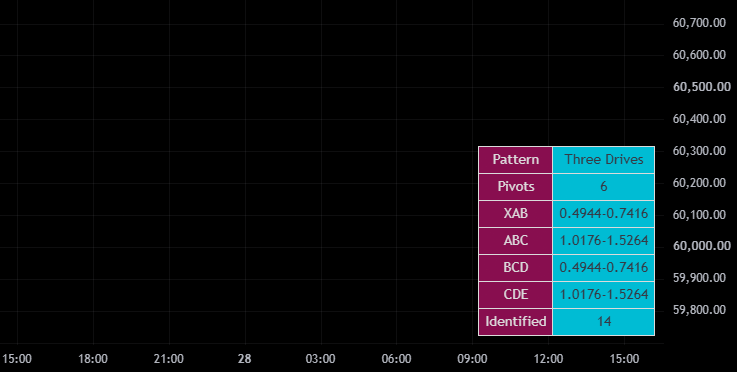
What makes this table worth keeping on is that you can see exactly what you’re scanning for at any moment. You never have to reopen the settings panel mid-tweak, and the detection count at the bottom tells you instantly whether your configuration is too loose or too tight. If you tightened the rules and the count didn’t drop, it’s still too loose.
How “BYO Pattern V1” decides something is a pattern
Everything is built on the ZigZag
It all starts with the ZigZag. It picks up swing highs and lows at the sensitivity you set with Length, then slices off the most recent 5 or 6 of them. Which means the quality of the ZigZag is the quality of the pattern. This is the single biggest lever on how well “BYO Pattern V1” performs.
It also doesn’t stop at one level of ZigZag. It keeps rolling the ZigZag up into larger swings and scans several degrees of pattern in parallel. That’s why on a Bitcoin daily chart you’ll see small patterns spanning a few dozen bars sitting alongside big ones spanning hundreds. How deep that stack goes is controlled by Depth.
The eight ratio conditions
There are eight ratio conditions available. Each one toggles independently and takes whatever values you give it.
| Ratio | What it measures | Pivot count |
|---|---|---|
| XAB | AB as a retracement of the XA leg | Both 5 & 6 |
| ABC | BC measured against the AB leg | Both 5 & 6 |
| BCD | CD measured against the BC leg | Both 5 & 6 |
| CDE | DE measured against the CD leg | 6 only |
| XAD | AD measured against the XA leg | Both 5 & 6 |
| XCD | The CD side measured against the XC span | Both 5 & 6 |
| ABE | BE measured against the AB leg | 6 only |
| ADE | DE measured against the AD leg | 6 only |
Combine those eight and you can express ABCD patterns, Gartley-style structures, Three Drives, and shapes nobody has bothered to name yet. Note that XAD and XCD share a single dotted line from X to D, and ABE and ADE share a single line from A to E, with their values printed together.
Two ways to define a ratio: fixed value or range
Every ratio has two input fields — a start value and an end value. The behavior here is a little unusual.
- Put the same number in both fields (fixed value) and the tolerance band widens above and below by the Error Percent amount
- Put different numbers in (range) and that range is used as-is, with Error Percent ignored
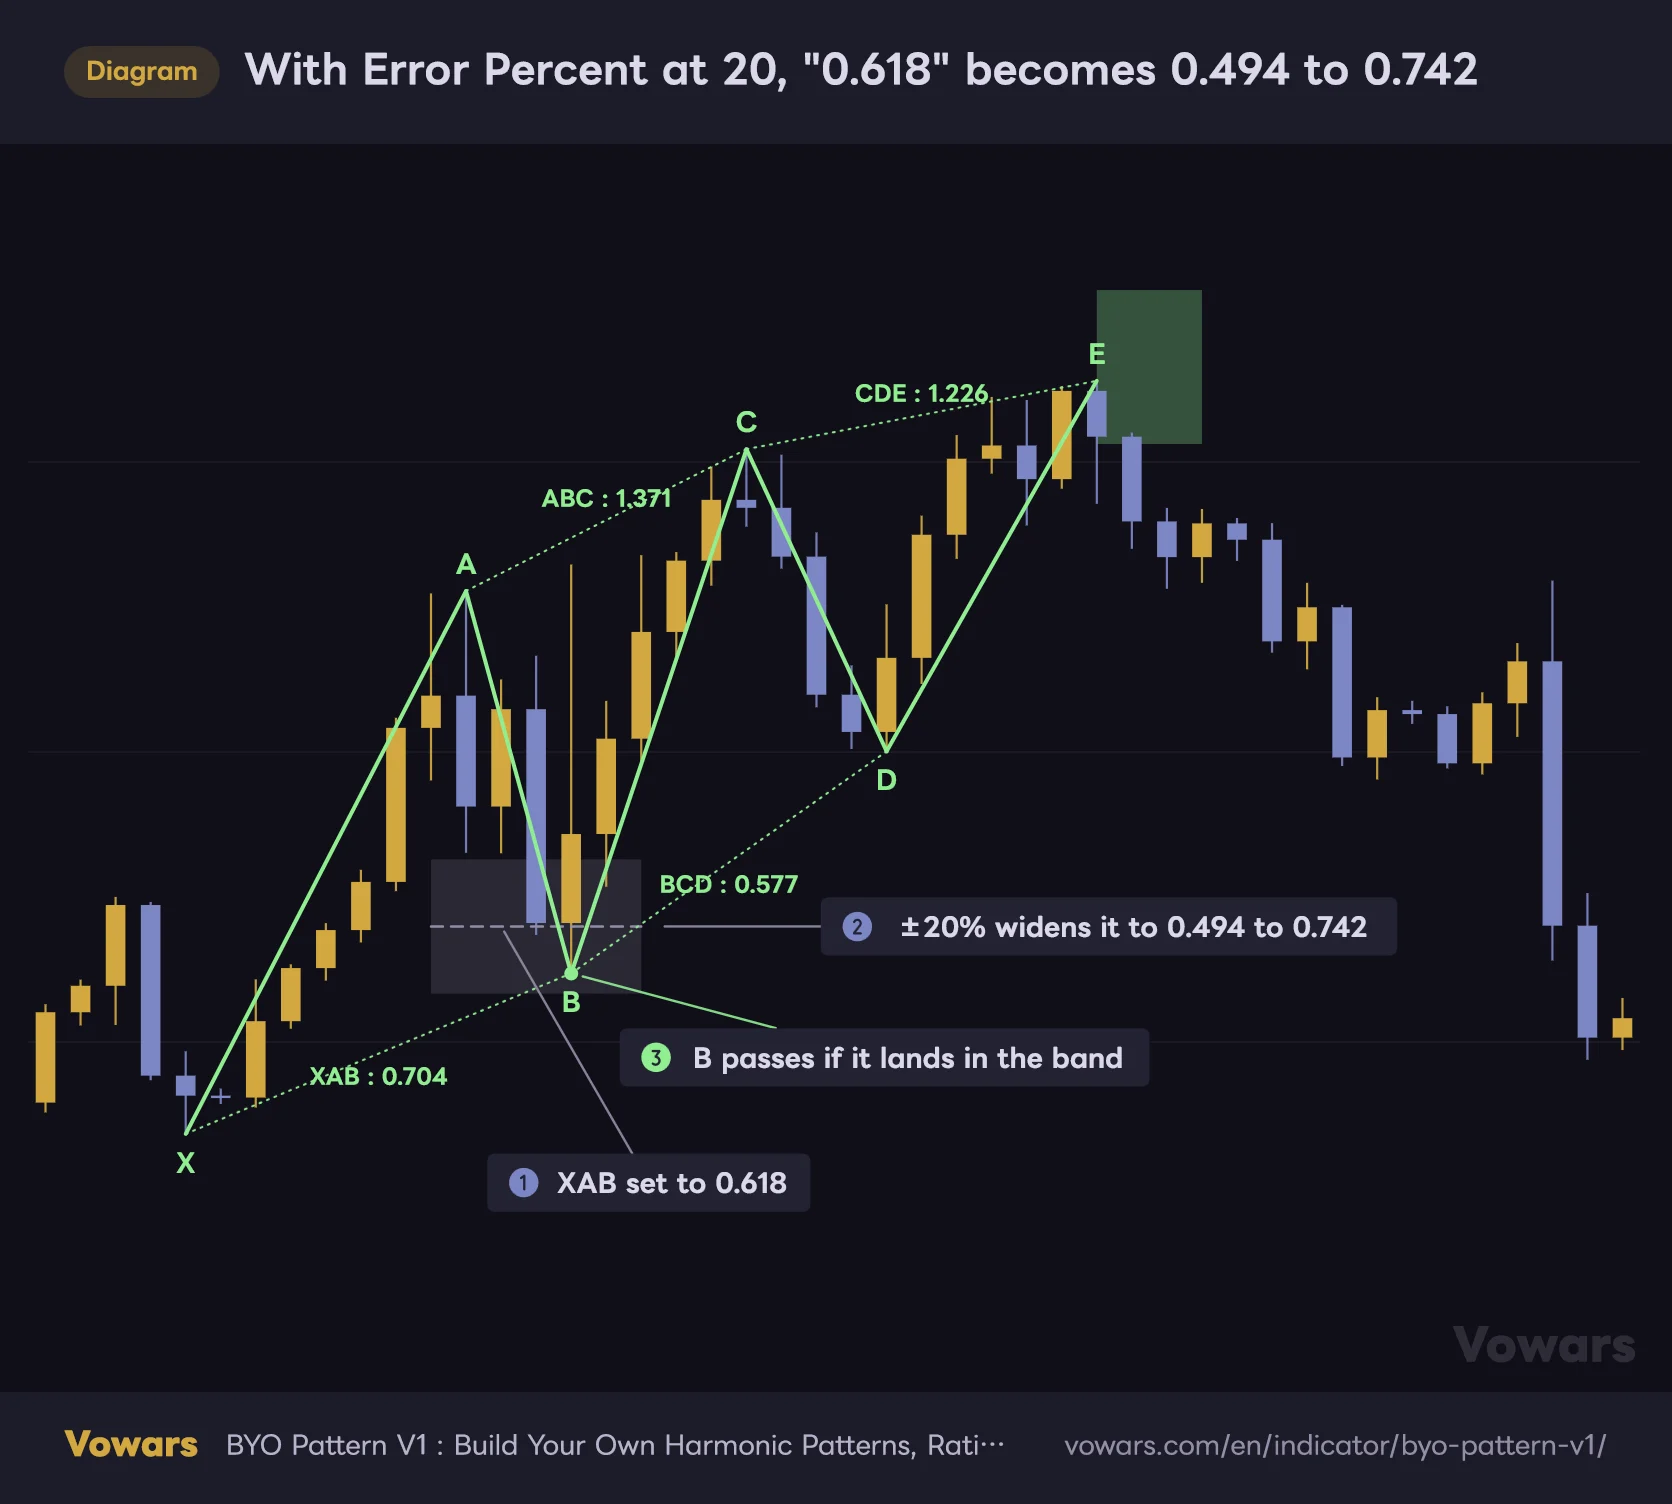
The default XAB is “0.618 / 0.618” — a fixed value — and Error Percent is 20. The quickest way to see what that actually accepts is a picture.
With Error Percent at 20, "0.618" becomes 0.494 to 0.742
Enter the same number as the start and end value and Error Percent adds a tolerance band above and below it.
Vowars DE ver.3.8.0
Roughly 0.494 to 0.742. That’s wide. A 0.5 pullback and something close to a 0.786 pullback both sail through, so treat the defaults as a deliberately loose scan. The summary table shows the expanded range after tolerance is applied, so always confirm the real numbers there.
Terminal ratios: at least one is mandatory
“BYO Pattern V1” has a group of ratios you are required to keep enabled.
On 6-pivot mode you need at least one of CDE, ABE or ADE; on 5-pivot mode you need at least one of BCD, XAD or XCD. Switch them all off and the indicator throws an error message and stops running. It’s easy to get caught out mid-tweak when everything suddenly vanishes from the chart, so keep it in mind.
There’s a good reason for that rule: these ratios are the ones that pin down where the pattern terminates. Without a defined endpoint there’s no way to calculate a PRZ, and no way to say when the pattern is even complete. Hence the requirement.
Every setting, and the order to touch them in
The settings are split into four groups: “Zigzag”, “Pattern”, “Ratios” and “Display”. Here’s the full rundown first.
| Setting | Default | Suggested | Effect |
|---|---|---|---|
| Length | 5 | 5–15 | ZigZag sensitivity. Raise it and you get fewer pivots, capturing only the larger swings |
| Depth | 50 | 50–100 | How many pivots are scanned and how many ZigZag levels are stacked. Higher means more detections but heavier processing (max 500) |
| Use Real Time Bars | ON | OFF when reviewing | Whether the forming bar is included in calculations. OFF judges on confirmed bars only |
| Title | Three Drives | Rename to match your setup | The name shown in the summary table. Rename it whenever you change the rules and you’ll never lose track |
| Number of Pivots | 6 | 5 or 6 depending on the shape | How many points make up the pattern. 5 gives XABCD, 6 gives XABCDE |
| Error Percent | 20 | 5–10 | Tolerance applied to fixed values. Lower is stricter and cuts detections dramatically |
| Log Scale | OFF | ON for higher timeframe Bitcoin | Calculates ratios on a logarithmic basis. Useful on wide-range instruments and higher timeframes |
| XAB | ON / 0.618–0.618 | Range of 0.5–0.786 | Governs how deep the first pullback has to be |
| ABC | ON / 1.272–1.272 | Range of 1.13–1.618 | Governs the size of the second thrust |
| BCD | ON / 0.618–0.618 | Range of 0.5–0.786 | Governs the depth of the second pullback. Acts as a terminal ratio in 5-pivot mode |
| CDE | ON / 1.272–1.272 (6-pivot only) | Range of 1.13–1.618 | Governs the size of the final thrust. The main terminal ratio for 6-pivot patterns |
| XAD | OFF / 0.382–0.618 | ON only when you want tighter filtering | Restricts where D can sit relative to the XA origin |
| XCD | OFF / 0.382–1.000 | Verify the printed values before using | Restricts the positional relationship measured against the XC span |
| ABE | OFF / 1.000–2.618 (6-pivot only) | ON when tightening the endpoint | Terminal ratio limiting how far E travels relative to AB |
| ADE | OFF / 1.000–2.618 (6-pivot only) | ON when tightening the endpoint | Terminal ratio limiting how far E travels relative to AD |
| Theme | Dark | Match your chart background | Lighter colors on dark backgrounds, darker colors on light ones |
| Pivot Labels | ON | ON | Shows the XABCDE labels. Off leaves you with just the polyline |
| Ratio Labels | ON | OFF when detections pile up | Shows the dotted ratio lines and their measured values |
| Summary | ON | ON | Shows the summary table in the bottom-right corner |
Start with “Length” — everything else can wait
There are a lot of settings here, but the first one to touch is unquestionably Length. The default of 5 is very sensitive, and on something like Bitcoin’s 15-minute chart it treats every little wiggle as a pivot. The result is that noise-level shapes get flagged as “patterns”.
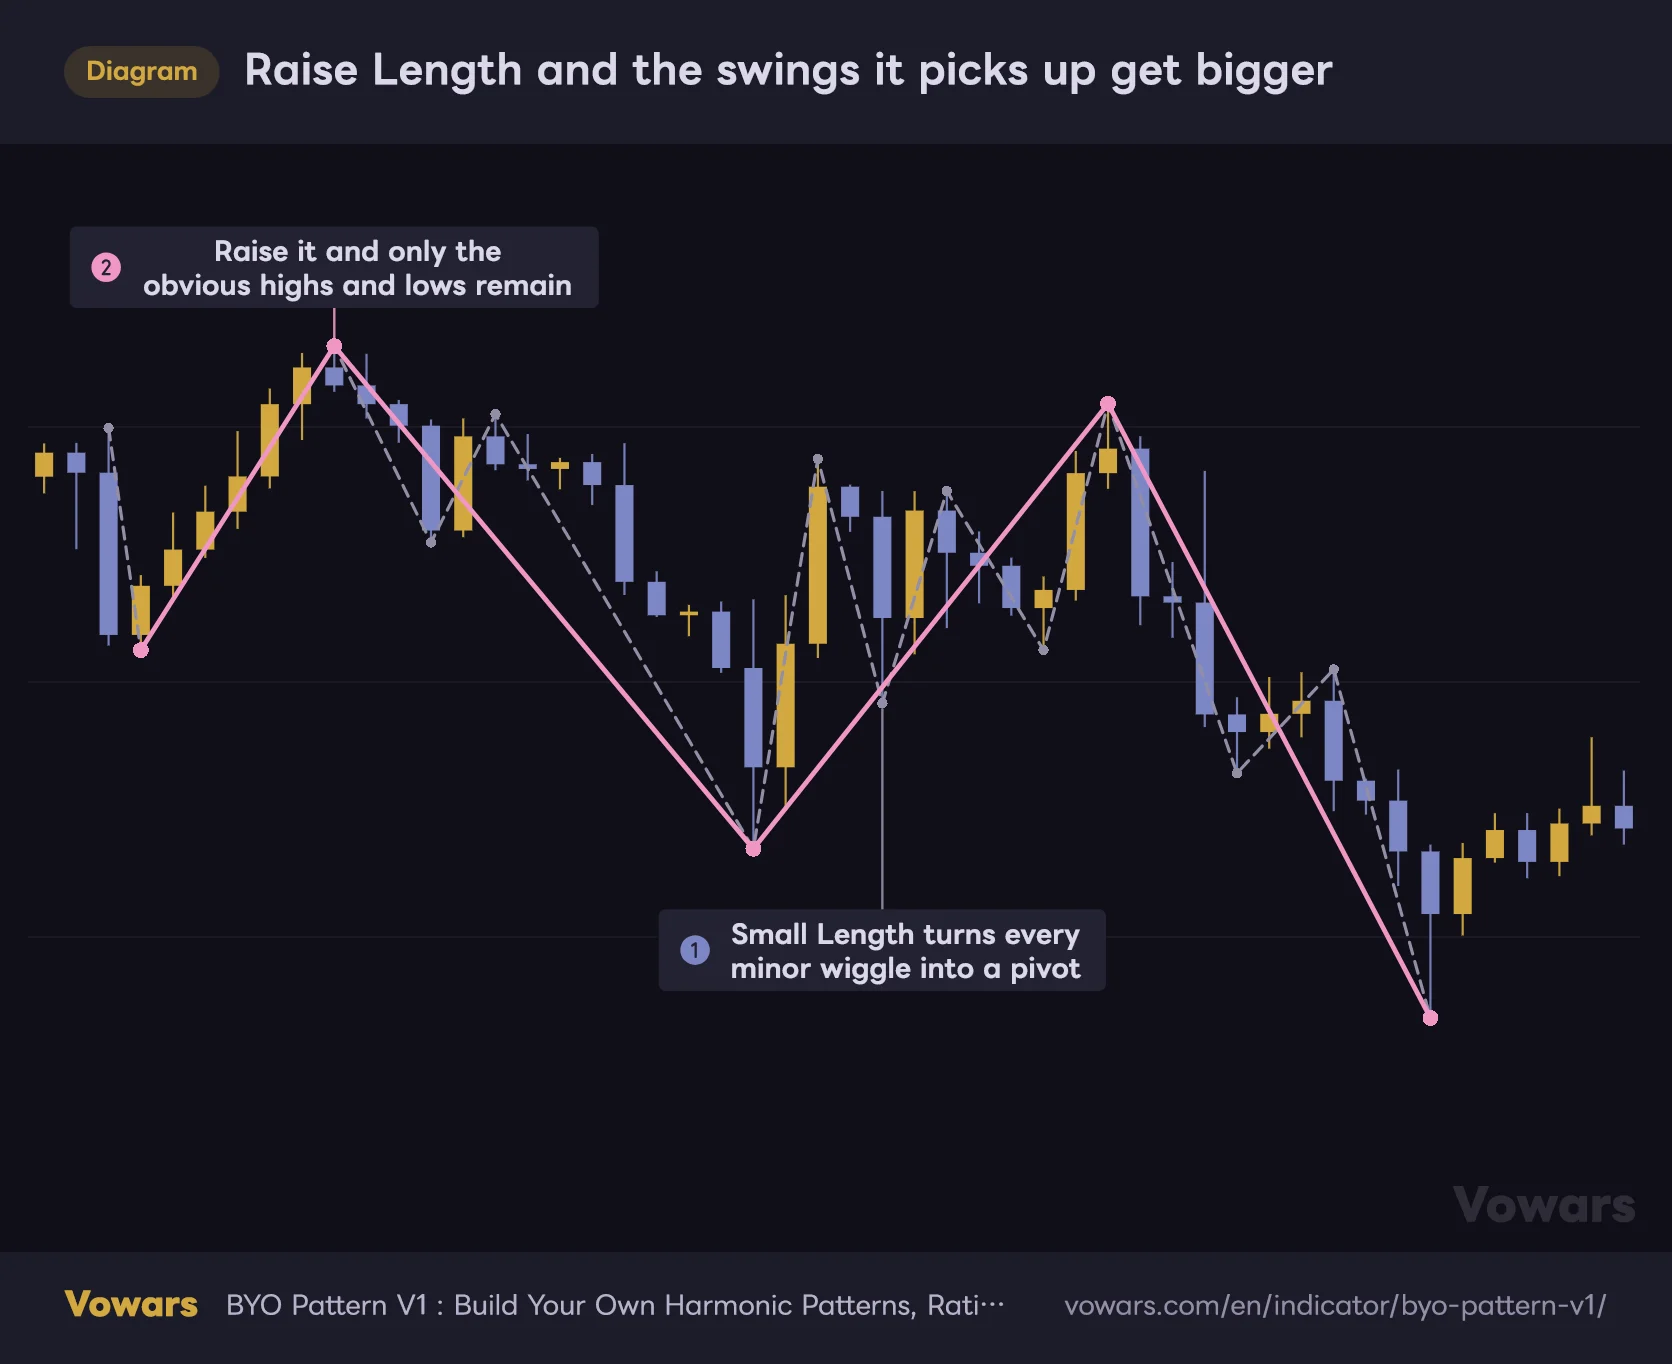
Raise Length and the swings it picks up get bigger
"BYO Pattern V1" builds patterns from the turning points of this line. Change the pivots and you change which patterns get found.
Vowars DE ver.3.8.0
Testing on Bitcoin’s 4H chart, leaving it at 5 buried the chart in lines. Pushing it to 10–15 noticeably widened the swings it picks up, and only the shapes where I thought “yeah, that one actually means something” survived. If you’re getting too many detections, raise Length before you start tightening ratios — it looks like the long way round but it’s the fastest fix.
Leaving Error Percent at 20 is too generous
As the earlier diagram showed, the default Error Percent of 20 is very wide in practice. Give 1.272 a 20% tolerance and anything from roughly 1.018 to 1.526 passes. That lumps “barely extended at all” in with “nearly a 1.618 extension,” and a lot of the pattern’s precision goes out the window.
My own approach is to leave it at 20 to get the lay of the land, then walk it down to 10 and then 5. Watching the detection count in the summary table as you tighten is genuinely interesting — you find the point where it suddenly falls off a cliff.
If you want fine control over tolerance, entering different numbers in the start and end fields is far more intuitive. Set XAB to “0.5–0.786” and you’ve turned the standard Fibonacci pullback zone into a rule directly. Error Percent doesn’t apply in that case, which means every ratio can carry its own independent tolerance.
Log Scale earns its keep on Bitcoin’s higher timeframes
Log Scale is easy to overlook, but it’s worth knowing if you trade Bitcoin. On a long-term chart that runs from a few thousand dollars to six figures, the same “$1,000 move” means wildly different things depending on where you are. Calculating ratios logarithmically means you’re measuring proportions in percentage terms rather than raw price distance, which tends to give far more sensible results on weekly and monthly charts.
On the daily and below, flipping it on or off barely changes anything. It’s fine to file this one away as “the higher timeframe switch.”
From first load to a setup you can actually use
1Add it on defaults and just watch
Add “BYO Pattern V1” from TradingView’s indicator search. Change nothing and load it on something like the Bitcoin daily. Since the defaults are Three Drives, you should be seeing shapes that push three times in the same direction.
What you’re doing at this stage is going through each detection and asking “did this actually lead to a reversal?” Build that intuition now and dialing in the settings later gets much easier.
2Tune Length to the swing size you care about
Adjust Length for your timeframe and instrument. Too many lines, raise it; almost no detections, lower it. The trick is to line up the swing size the ZigZag picks up with the swing size you actually trade.
3Build the rules for the pattern you want
This is the main event. Say you want to detect a classic ABCD — set Number of Pivots to 5, enable XAB, ABC and BCD, and enter your target ratios in each. Change Title to something like “ABCD” while you’re at it, so one glance at the summary table tells you what you’re hunting.
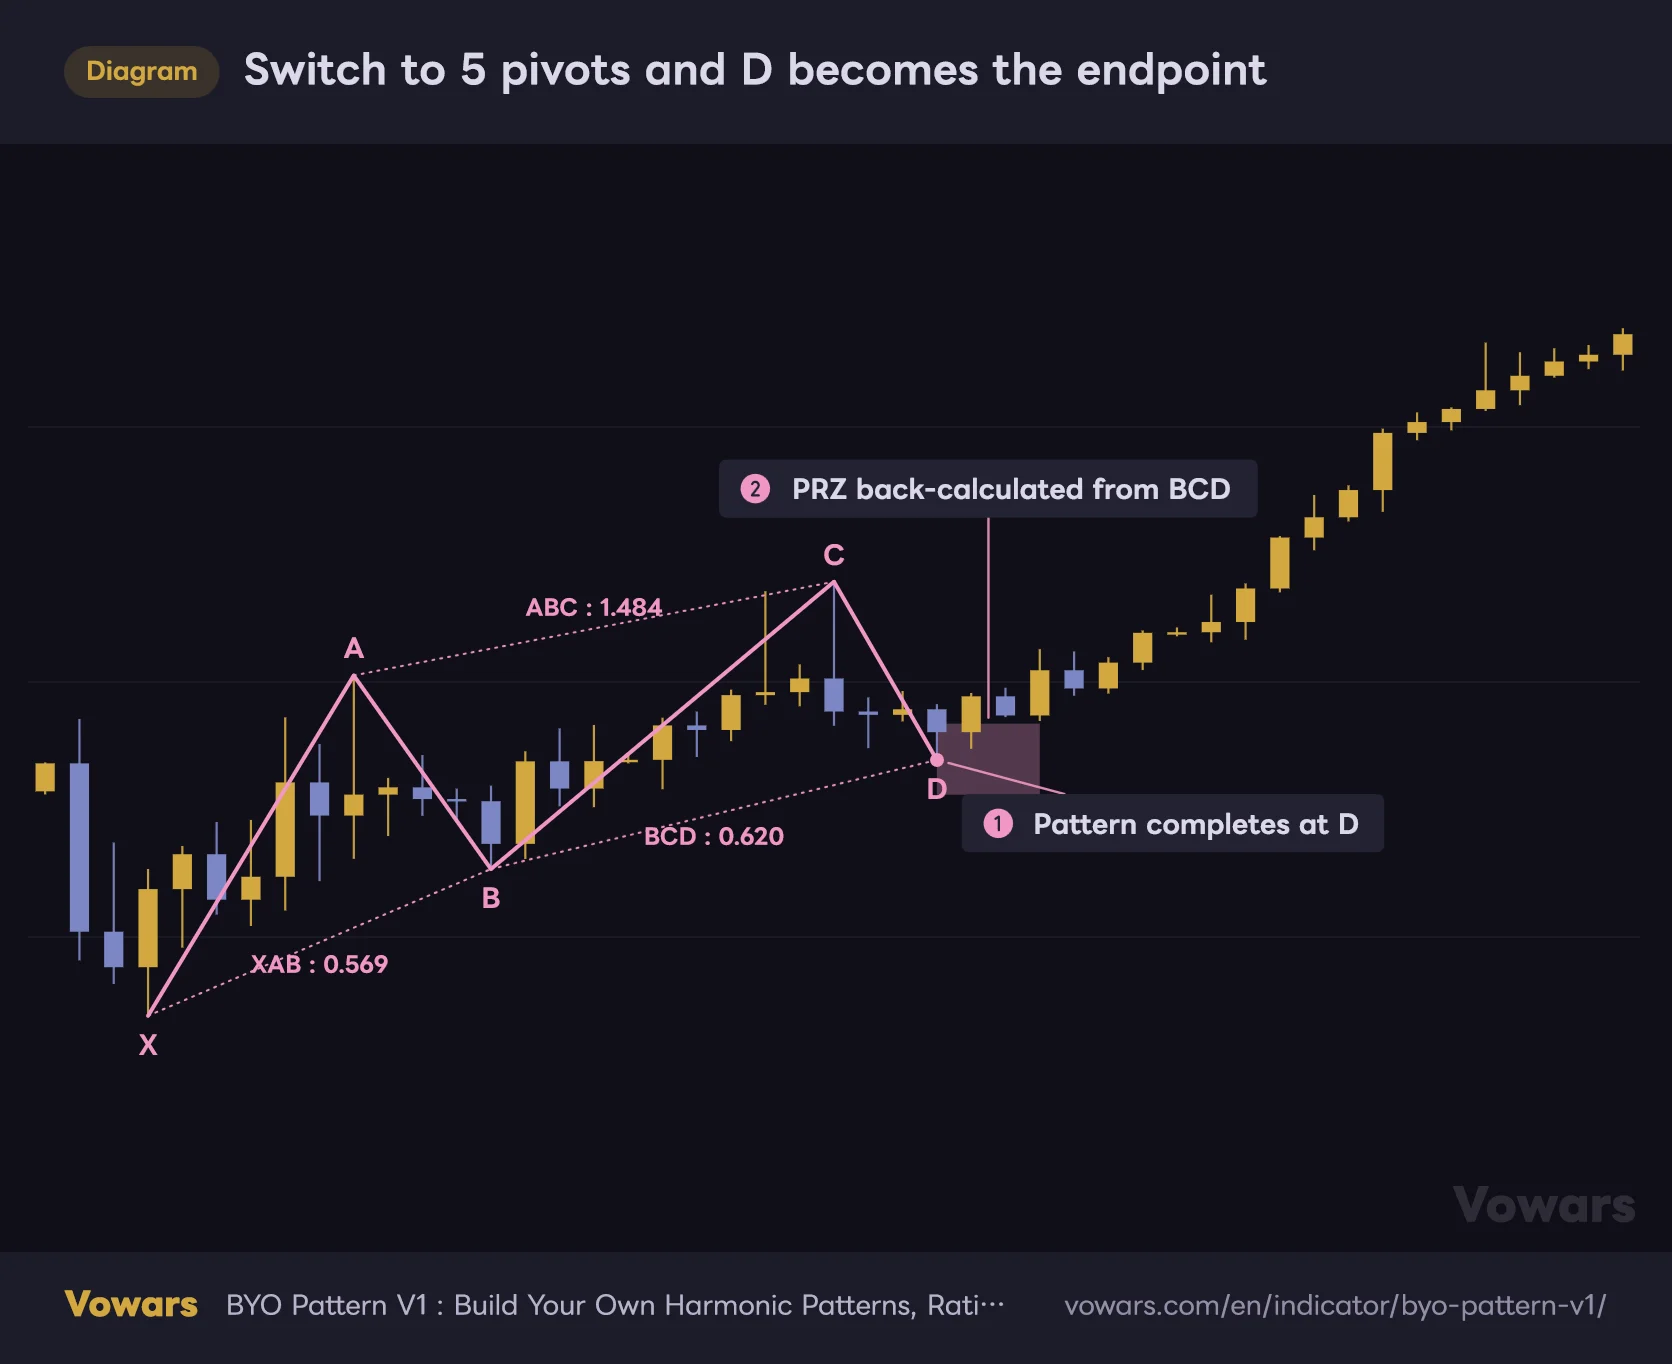
Switch to 5 pivots and D becomes the endpoint
Set Number of Pivots to 5 and E disappears. The pattern completes with four legs, XABCD.
Vowars DE ver.3.8.0
On 5 pivots E disappears and the pattern completes at D. The PRZ is drawn from the D bar too, so this setup pairs well with hunting for where a pullback or rally is likely to stall.
The opposite approach works too — keep a single condition and cast a wide net. Run 6 pivots with only CDE enabled and it’ll surface every shape where the final thrust hit your target extension.
4Cross-check the PRZ against your other levels
Once a pattern is drawn, look at where the PRZ sits. Check whether it overlaps a horizontal level from a prior high or low, or whether it’s close to a moving average or trendline. “BYO Pattern V1” doesn’t produce buy or sell signals, so the entry decision comes from you, combined with your own confluence.
5Use the detection count to sanity-check your settings
Finally, look at the count. Dozens of detections means your rules are too loose; one or two means they’re probably too tight. A good yardstick is whether the number of patterns on the visible range is small enough to eyeball them all.
Where it shines, and where it spins its wheels
Conditions it handles well
“BYO Pattern V1” is at its best late in a trend, when you’re on alert for a reversal. The default Three Drives configuration in particular catches the moment where a third push in the same direction is running out of steam, which suits instruments like Bitcoin and gold that tend to run hard one way and then snap back.
It also works for systematically mapping out buy-the-dip and sell-the-rally candidates. Configure the ratios toward continuation shapes and it becomes a tool for locating where a mid-trend correction is likely to end. Because you define what you’re looking for, the indicator isn’t locked into a single use case — that’s its real edge.
On timeframes, swing trading on the 4H to daily felt like the sweet spot. Patterns need a decent number of bars to complete, so on very low timeframes the shapes tend to break down, and the wait rarely justifies the move you get. On the daily and weekly it works perfectly well as a context tool for position trading too.
Conditions it struggles with
What it hates is a tight, directionless range. The ZigZag generates a flood of small pivots, and you end up mass-producing “patterns” that only qualify because the ratios happened to line up. The shape can look textbook-clean while the price action underneath is complete noise.
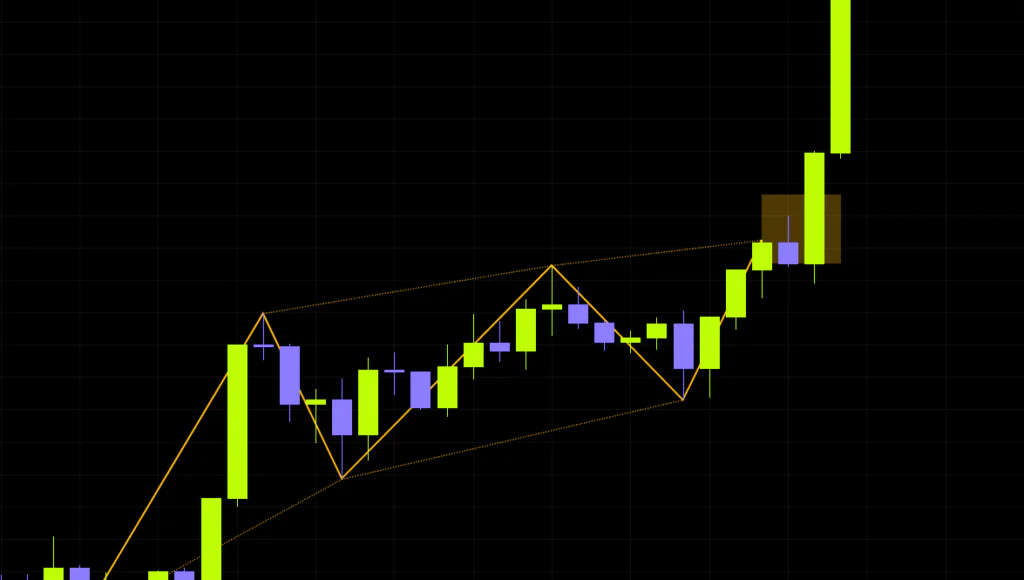
The other weak spot is news-driven gaps and spikes. Long wicks and gaps distort the leg sizes, which distorts the ratio math, and shapes that should never have qualified suddenly do. Those two were the clearest weaknesses I ran into while testing on Bitcoin charts.
What you can lean on, and what to watch out for
What you can lean on
- Total freedom to define the ratio rules yourself
- Fixed values or ranges, with fine-grained control over tolerance
- Prints the measured ratios, so you can see why a pattern qualified
- PRZ is calculated automatically, saving you the manual drawing
- Scans multiple degrees of pattern at the same time
- Color-codes patterns so they stay readable when they overlap
- Summary table keeps your current rules and detection count in view
- Open source and free
What to watch out for
- No alerts of any kind
- No buy or sell signals — every call is yours to make
- If price runs past E after the pattern is drawn, the drawing doesn’t update
- The default Error Percent of 20 is loose and over-detects
- You can’t build rules without understanding what the ratios mean
- Older patterns lose their labels first
- Churns out meaningless shapes in choppy conditions
- Disabling every terminal ratio stops the indicator with an error
Things to know before you rely on it
E is just the latest high or low at that moment
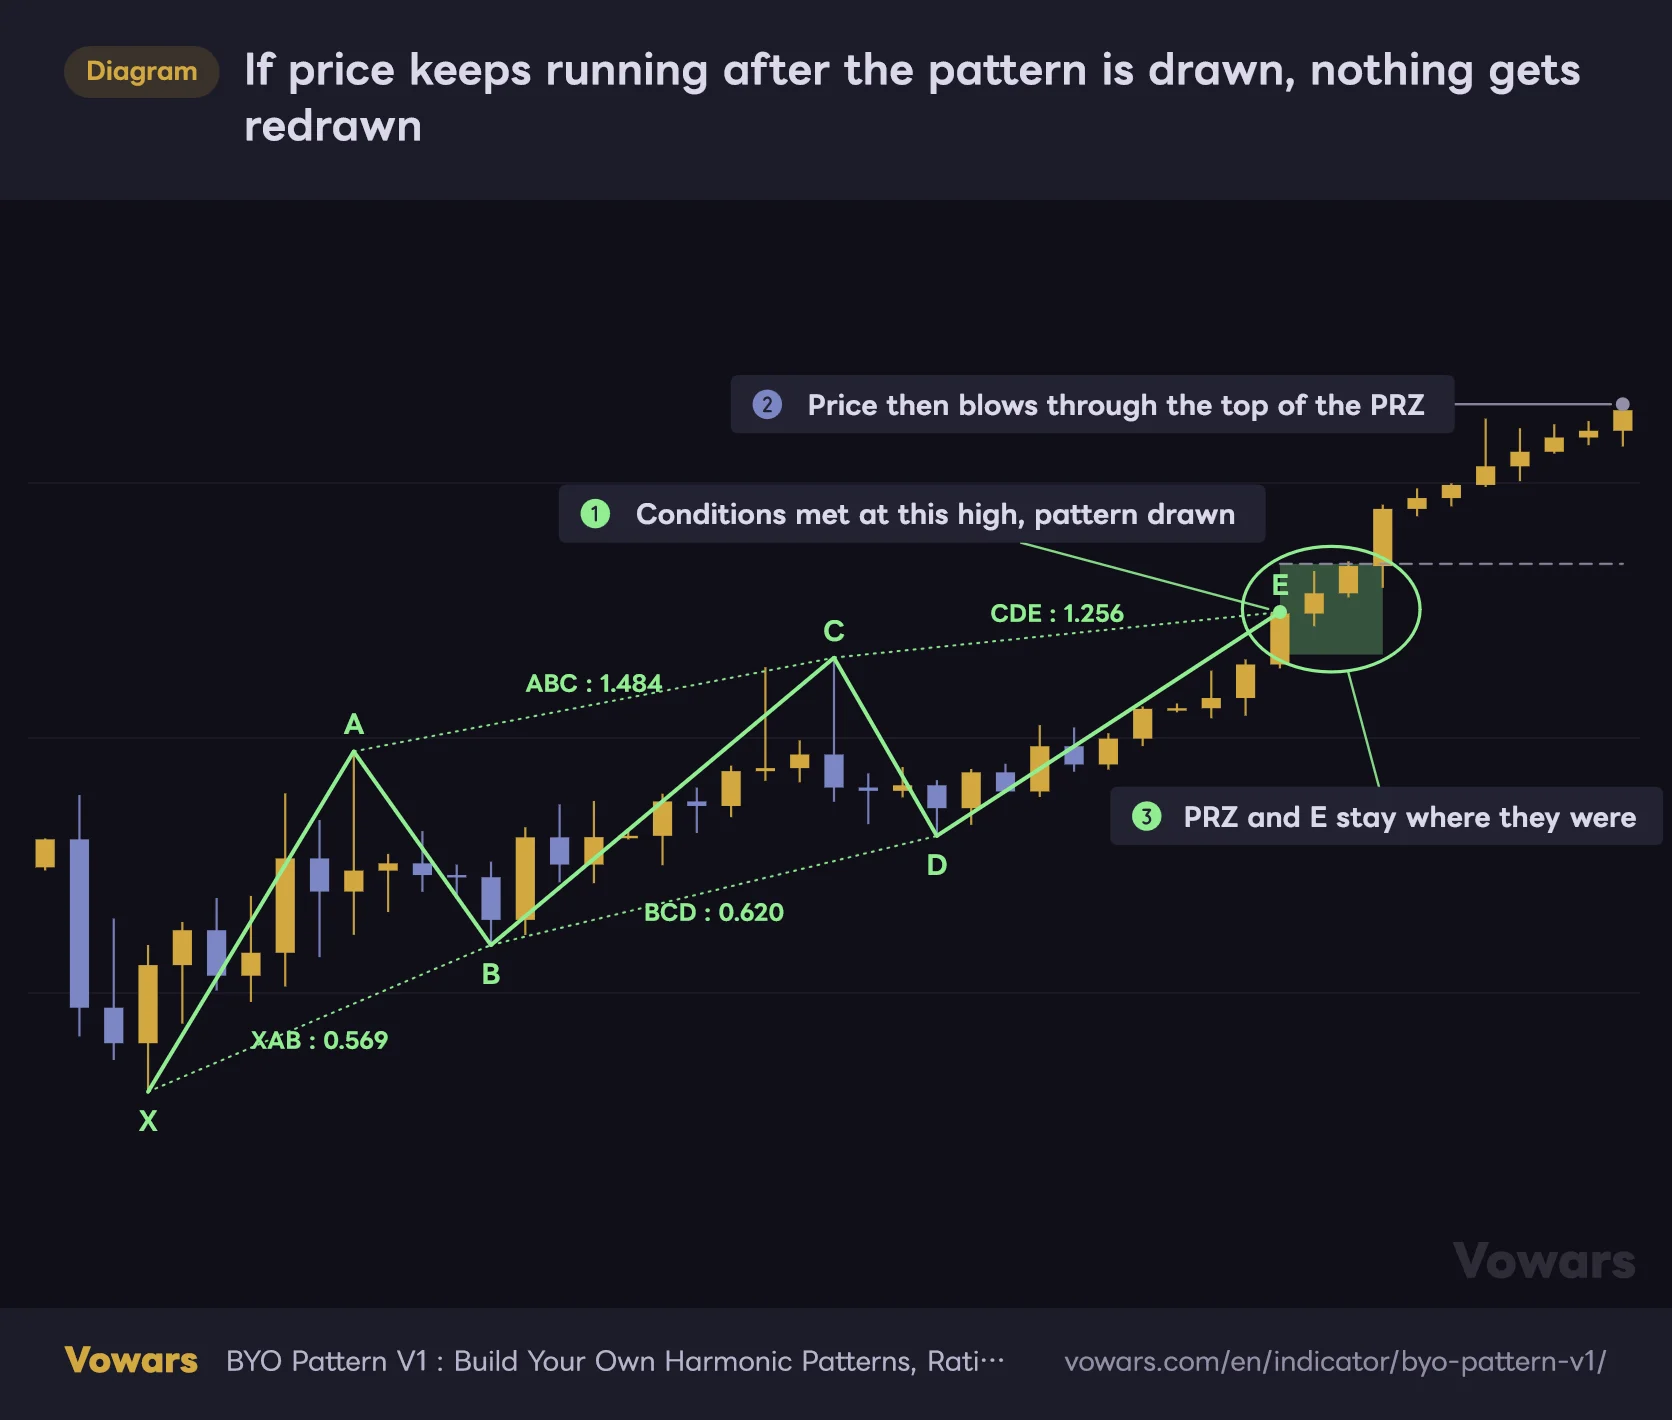
The final point E is simply the newest pivot the ZigZag has at that moment. If price keeps extending, the ZigZag’s latest pivot moves on with it. But once a pattern is drawn, it is never redrawn or removed.
If price keeps running after the pattern is drawn, nothing gets redrawn
E is simply the latest high at the moment of detection. The drawing never moves to follow what price does afterward.
Vowars DE ver.3.8.0
Scroll back through history and every pattern tends to look like it reversed cleanly at E. Live, though, nobody knows whether the E you’re looking at will turn out to be the actual top or bottom. If price breaks out of the PRZ and keeps going, treat the pattern as failed — that’s the safe read.
With Use Real Time Bars switched ON, patterns are evaluated on the bar that hasn’t closed yet. Anything drawn on the forming bar can appear and then vanish again depending on how that bar develops, so don’t jump on it. Switching it OFF judges on confirmed bars only and keeps the display stable.
TradingView’s Bar Replay lets you step forward one bar at a time and see which bar a pattern was drawn on, and whether price then broke out of the PRZ. It’s the best way to feel the gap between how history looks and when patterns actually print. How far back you can replay depends on your plan and timeframe.
Older patterns lose their labels first
TradingView caps how many lines, labels, boxes and so on a single indicator can display, and unless the script sets its own limits, that cap is roughly 50 per type. Once you go over, the oldest drawings are removed automatically. “BYO Pattern V1” doesn’t change these limits, so the defaults apply.
| Drawing type | Per pattern (default settings) | Roughly how many patterns keep it |
|---|---|---|
| Labels (XABCDE letters and measured ratios) | Up to 10 | The last 5 or so |
| Dotted ratio lines | 4 | The last 12 or so |
| Polyline and PRZ box | 1 each | The last 50 or so |
So as you scroll back, you’ll run into patterns with just the polyline and no text. That’s not a bug. Also note that Identified in the summary table is the total detection count, including patterns whose drawings have since been removed.
There are no alerts
“BYO Pattern V1” ships with no alert conditions. You can’t get notified when a pattern is detected, so you have to open the chart and check for yourself. If you’re watching a basket of symbols, this will be the biggest constraint you run into.
What you can do is draw a horizontal line at the PRZ yourself and set a regular price alert on it. I like to park a price alert just outside the PRZ as my “the pattern just failed” signal.
Eyeball the numbers before you trust XCD
Small detail, but of the eight ratios, XCD was the one where the printed value sometimes didn’t match what I’d expect from the name. It’s off by default so it won’t affect normal use, but if you do enable it, check the printed value against your own measurement before building rules around it. The other seven lined up with their labels exactly.
Don’t crank Depth
Depth goes up to 500, but the higher you push it the more levels get scanned and the heavier it gets. The author also notes that pushing it too far slows things down and can lead to errors. Rather than jumping straight to the max, start at 50 and raise it in steps while you watch how it behaves.
What to pair it with
“BYO Pattern V1” gives you one piece of evidence, so making trade decisions off it alone isn’t realistic. Here are the combinations that worked best for me in practice.
| Pair it with | What you get |
|---|---|
| Horizontal levels / prior swing highs and lows | Check whether the PRZ overlaps a key level to gauge how much weight to give it |
| RSI / Stochastics | Look for divergence around the final pivot |
| Volume | Thinning volume on the last thrust backs up the loss of momentum |
| Higher timeframe trend read (moving averages, etc.) | Filter out patterns fighting the HTF direction and cut down on fakeouts |
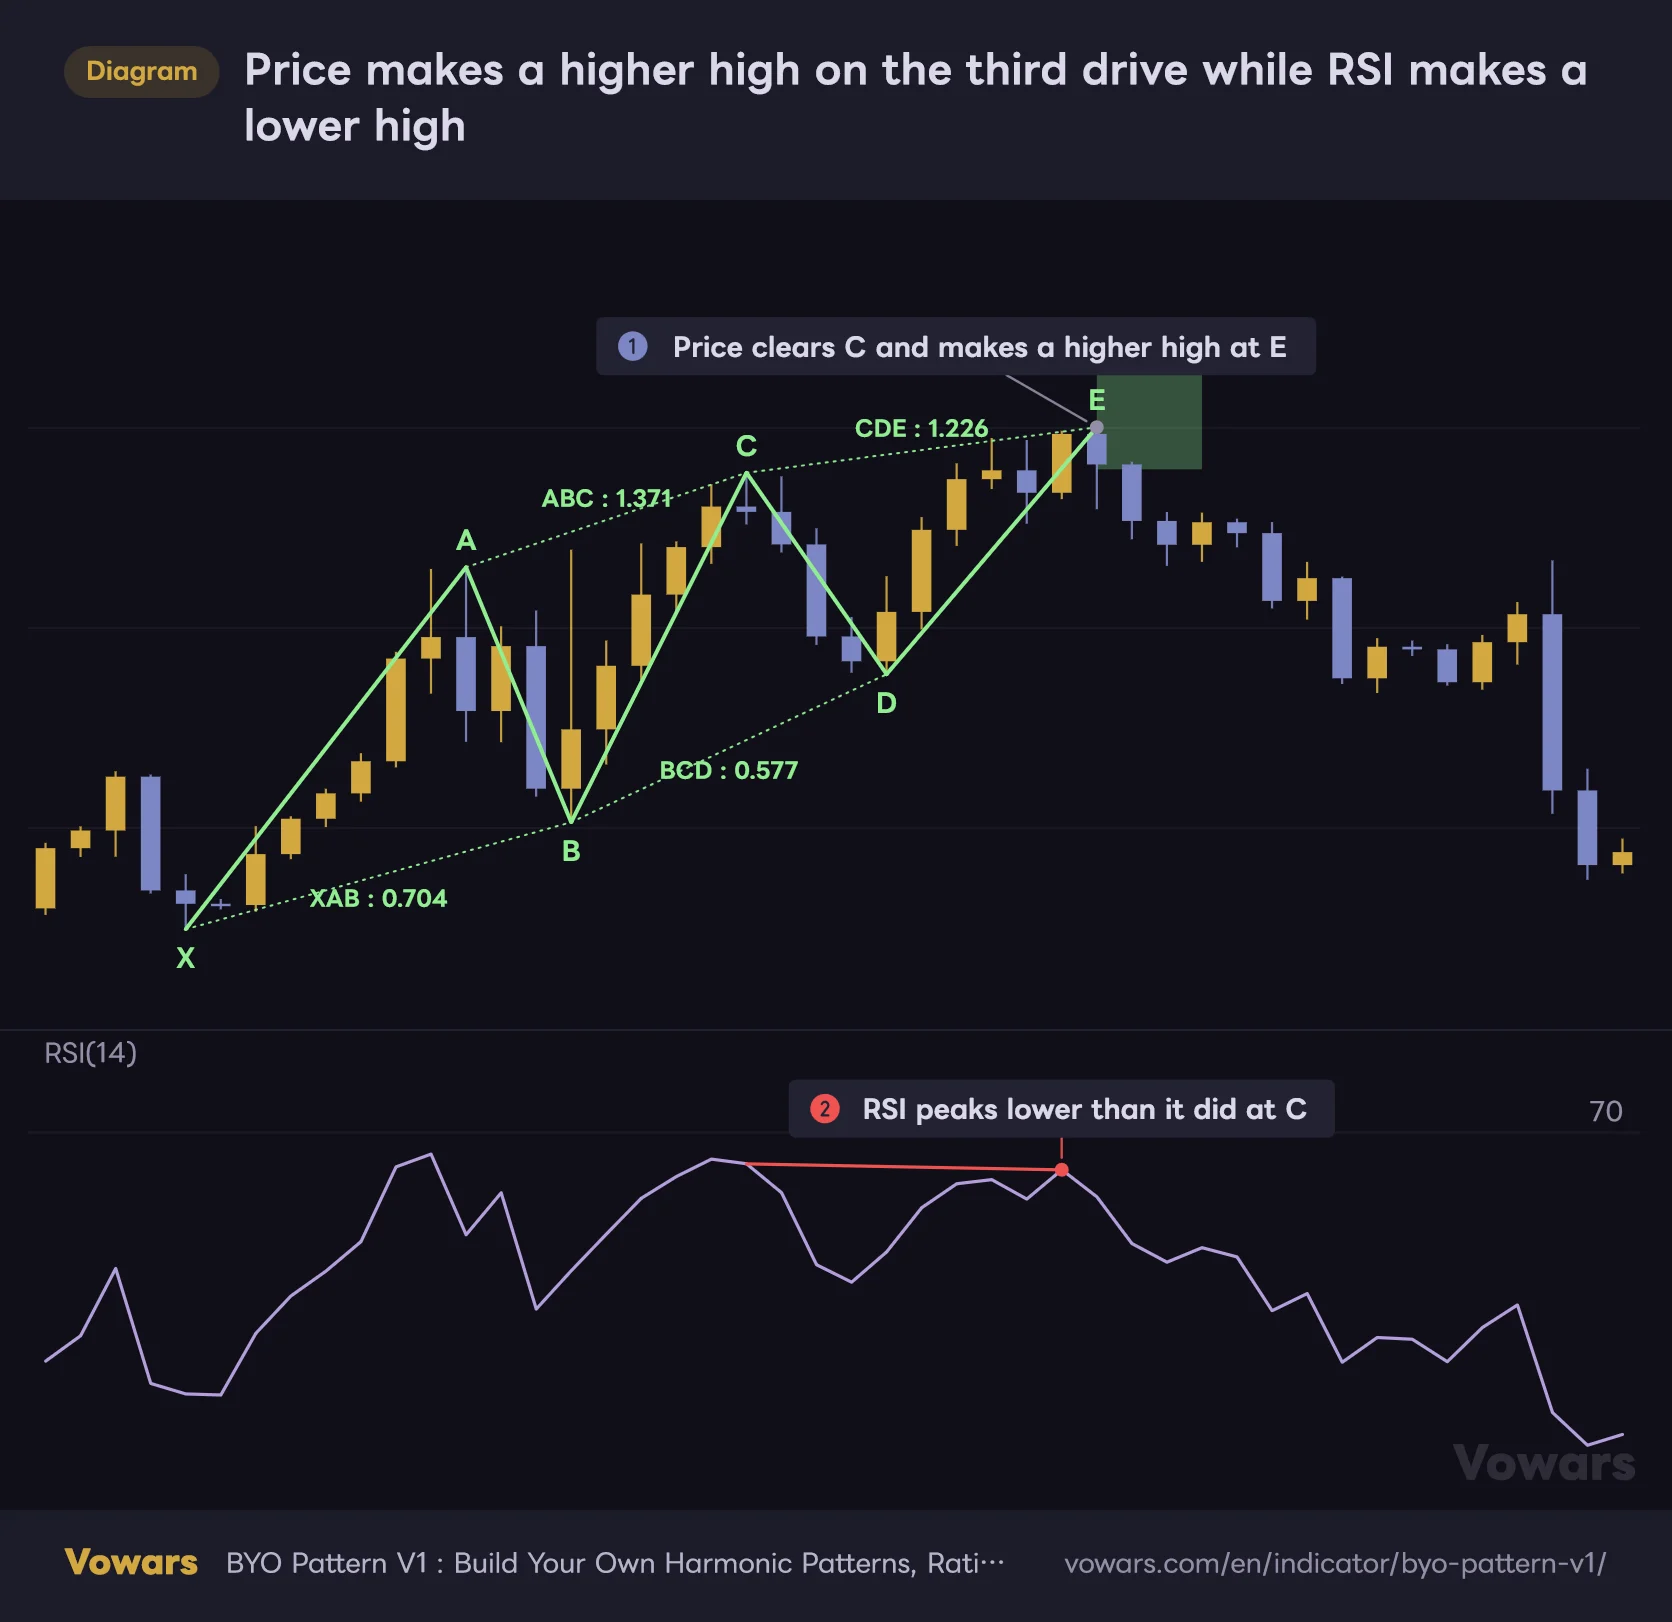
The one that made the biggest difference was RSI divergence.
Price makes a higher high on the third drive while RSI makes a lower high
Layering fading RSI momentum on top of the "BYO Pattern V1" structure gives you a second piece of evidence.
Vowars DE ver.3.8.0
Shapes like Three Drives that push three times in the same direction usually show fading momentum on that last leg, and having RSI confirm it changes how much confidence you can put behind the read. Waiting for both the pattern structure and the momentum fade to line up before doing anything is a very practical filter.
A pattern scanner that puts the ratio rules back in your hands
“BYO Pattern V1” is a tool for traders who want to set the harmonic ratios themselves. If off-the-shelf pattern scanners have always felt limiting, or if you have your own ratio hypotheses you want to put to the test, there’s very little else offering this level of freedom.
That said, if you don’t know what the ratios mean you’ll freeze at the settings panel. If you’re after something that prints arrows the moment you add it, this isn’t built for that. No alerts, no signals — it finds shapes and draws them, and that’s the job it’s committed to.
If you’re already drawing harmonic patterns by hand, or you have your own ratio rules and want to test them systematically, this comes highly recommended. The entire routine of dragging Fib tools around and measuring ratios by hand gets automated, and your research speed changes completely.
Start by leaving it on the default Three Drives setup and watching the Bitcoin daily for a week or so. As you see what shapes it picks up and what price does afterward, you’ll naturally start thinking “I’d change that ratio if it were me.” That’s where “BYO Pattern V1” really begins.