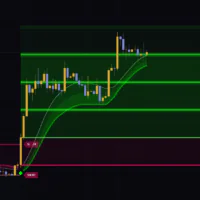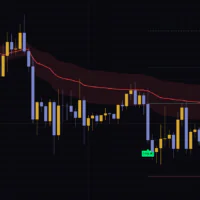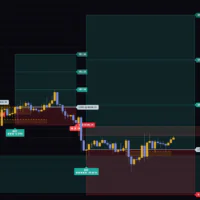


“Divergence for Many Indicators v4” Watches 10 Oscillators at Once
You go looking for RSI divergence, so you pull up RSI in a sub-pane. Then you add MACD. Before you know it, the bottom half of your chart is buried in oscillators. Sound familiar? “Divergence for Many Indicators v4” takes that whole job off your hands.
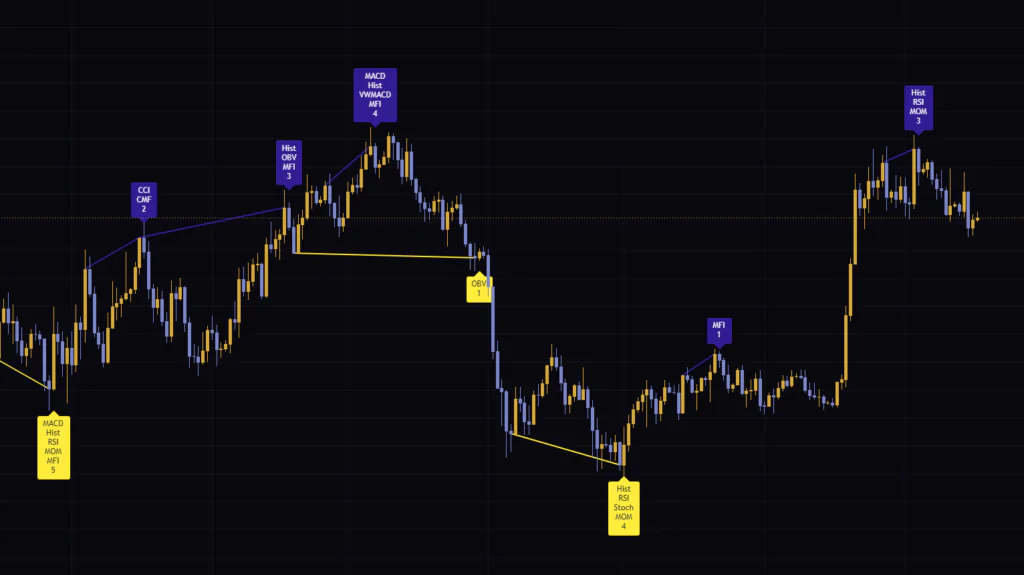
It’s built by LonesomeTheBlue and was picked as a TradingView Editors’ Pick. It calculates 10 indicators like RSI and MACD behind the scenes, and whenever it finds divergence against price, it drops a label on that bar listing the indicators and how many there are. You don’t get a single extra oscillator pane. All you see are lines and labels on the main chart.
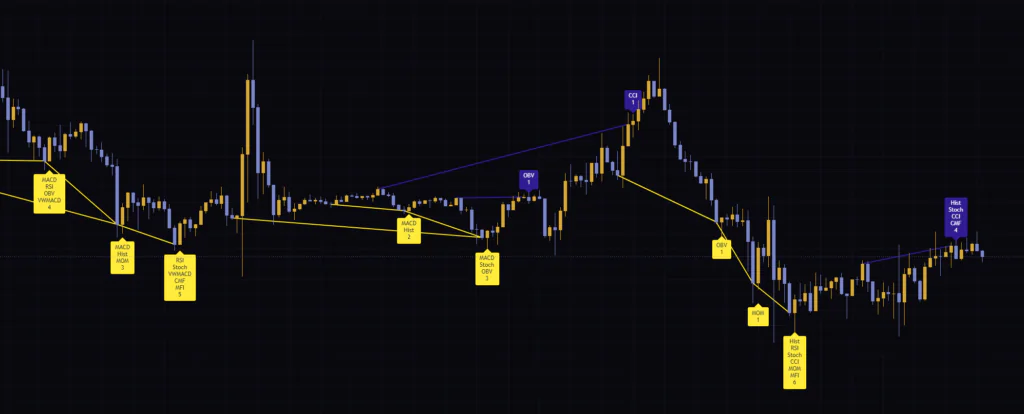
I ran it on Bitcoin’s 1H, 4H, and daily charts for a while. The first thing that stood out was how useful the number on each label is on its own. But the more I used it, the more I noticed there are things you simply can’t see on a historical chart. This article walks through both sides, with diagrams.
The 10 indicators it checks, and their lengths
These are the 10 indicators it scans for divergence. All lengths are hard-coded and can’t be changed in the settings. Also note that CCI and MFI are calculated from the close rather than the usual typical price. Keep that in mind and you won’t be confused when your own oscillators read slightly differently.
| Label | Indicator | Length / inputs |
|---|---|---|
| MACD | MACD line | 12 / 26 / 9 (close) |
| Hist | MACD histogram | 12 / 26 / 9 (close) |
| RSI | RSI | 14 (close) |
| Stoch | Stochastic | 14-period %K smoothed over 3 bars |
| CCI | CCI | 10 (close) |
| MOM | Momentum | 10 (close) |
| OBV | OBV | None (cumulative) |
| VWMACD | Volume-weighted MACD | Difference between the 12 and 26 volume-weighted moving averages |
| CMF | Chaikin Money Flow | 21 |
| MFI | Money Flow Index | 14 (close) |
You can’t change the lengths of the 10 built-in indicators, but turning on Check External Indicator lets you add the output of another indicator on your chart as an 11th input. For example, add a 9-period RSI to the chart first, then select it in External Indicator. It shows up on labels as “Extrn”. There’s only one external slot, so if you want more than one, add a second copy of “Divergence for Many Indicators v4” and assign a different indicator to each.
Labels Appear When a “Past Swing Low” and the “Previous Bar” Disagree
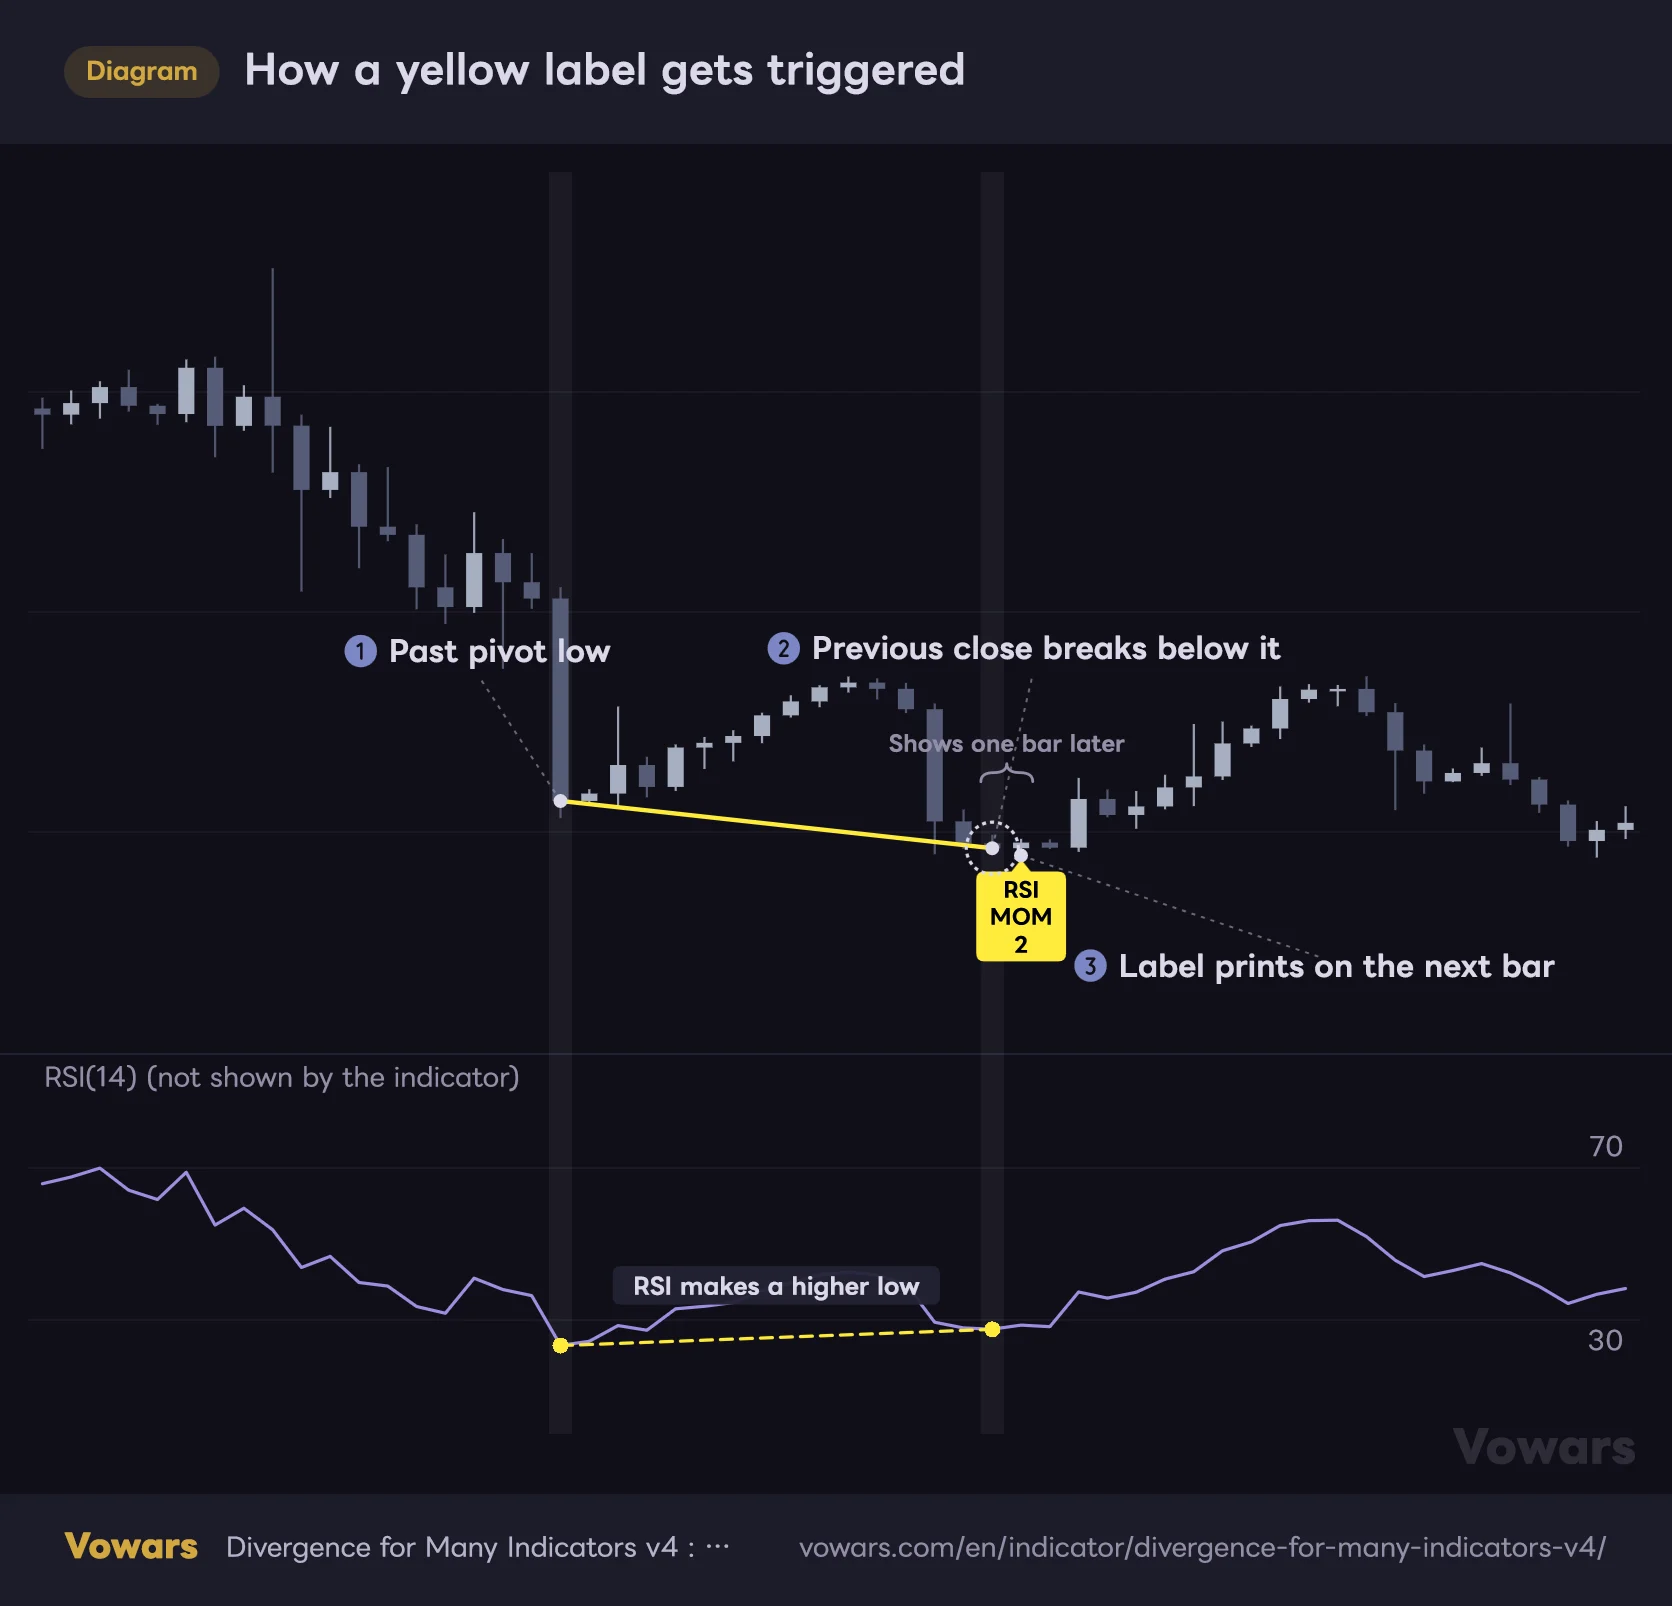
Let’s start with the label you’ll see most often: the yellow one (regular bullish divergence), and how it gets triggered. The RSI pane at the bottom is there for illustration only. It doesn’t appear on the actual chart.
How a yellow label gets triggered
Price is making a lower low, but RSI and Momentum have already stopped falling.
Vowars DE ver.3.5.0
On every bar, “Divergence for Many Indicators v4” checks up to 10 confirmed pivot lows (swing lows), newest first. What it compares them against is the bar right before the current one. If that bar closed below the old swing low while the indicator is higher than it was at that low, you have a mismatch. When it finds one, it draws a line from the swing low to the previous bar and places a label under the current bar.
What’s interesting here is that the newer point doesn’t have to be a pivot. Most divergence indicators compare swing low to swing low, so you wait several bars for the new low to confirm. “Divergence for Many Indicators v4” just uses the previous bar, so signals fire while price is still making new lows. Fast signals are a big plus, but the flip side is that labels show up before the bottom is actually in.
The “confirmation bar” is simply a bar where either the indicator or the close ticks back
With default settings, the bar that gets the label has its own condition too. Either the indicator is higher than on the previous bar, or the close is higher than the previous close. Meeting just one of those is enough to move on to the divergence check. The author’s description reads as if both the close and the indicator need to rise, but in actual use I saw labels on bars where only one of them did. The bearish side works the other way around: the check runs on bars where either the indicator or the close ticks lower.
Pivots older than Maximum Bars to Check (100 bars by default) are ignored. Pairs of points that are 5 bars apart or less are also skipped.
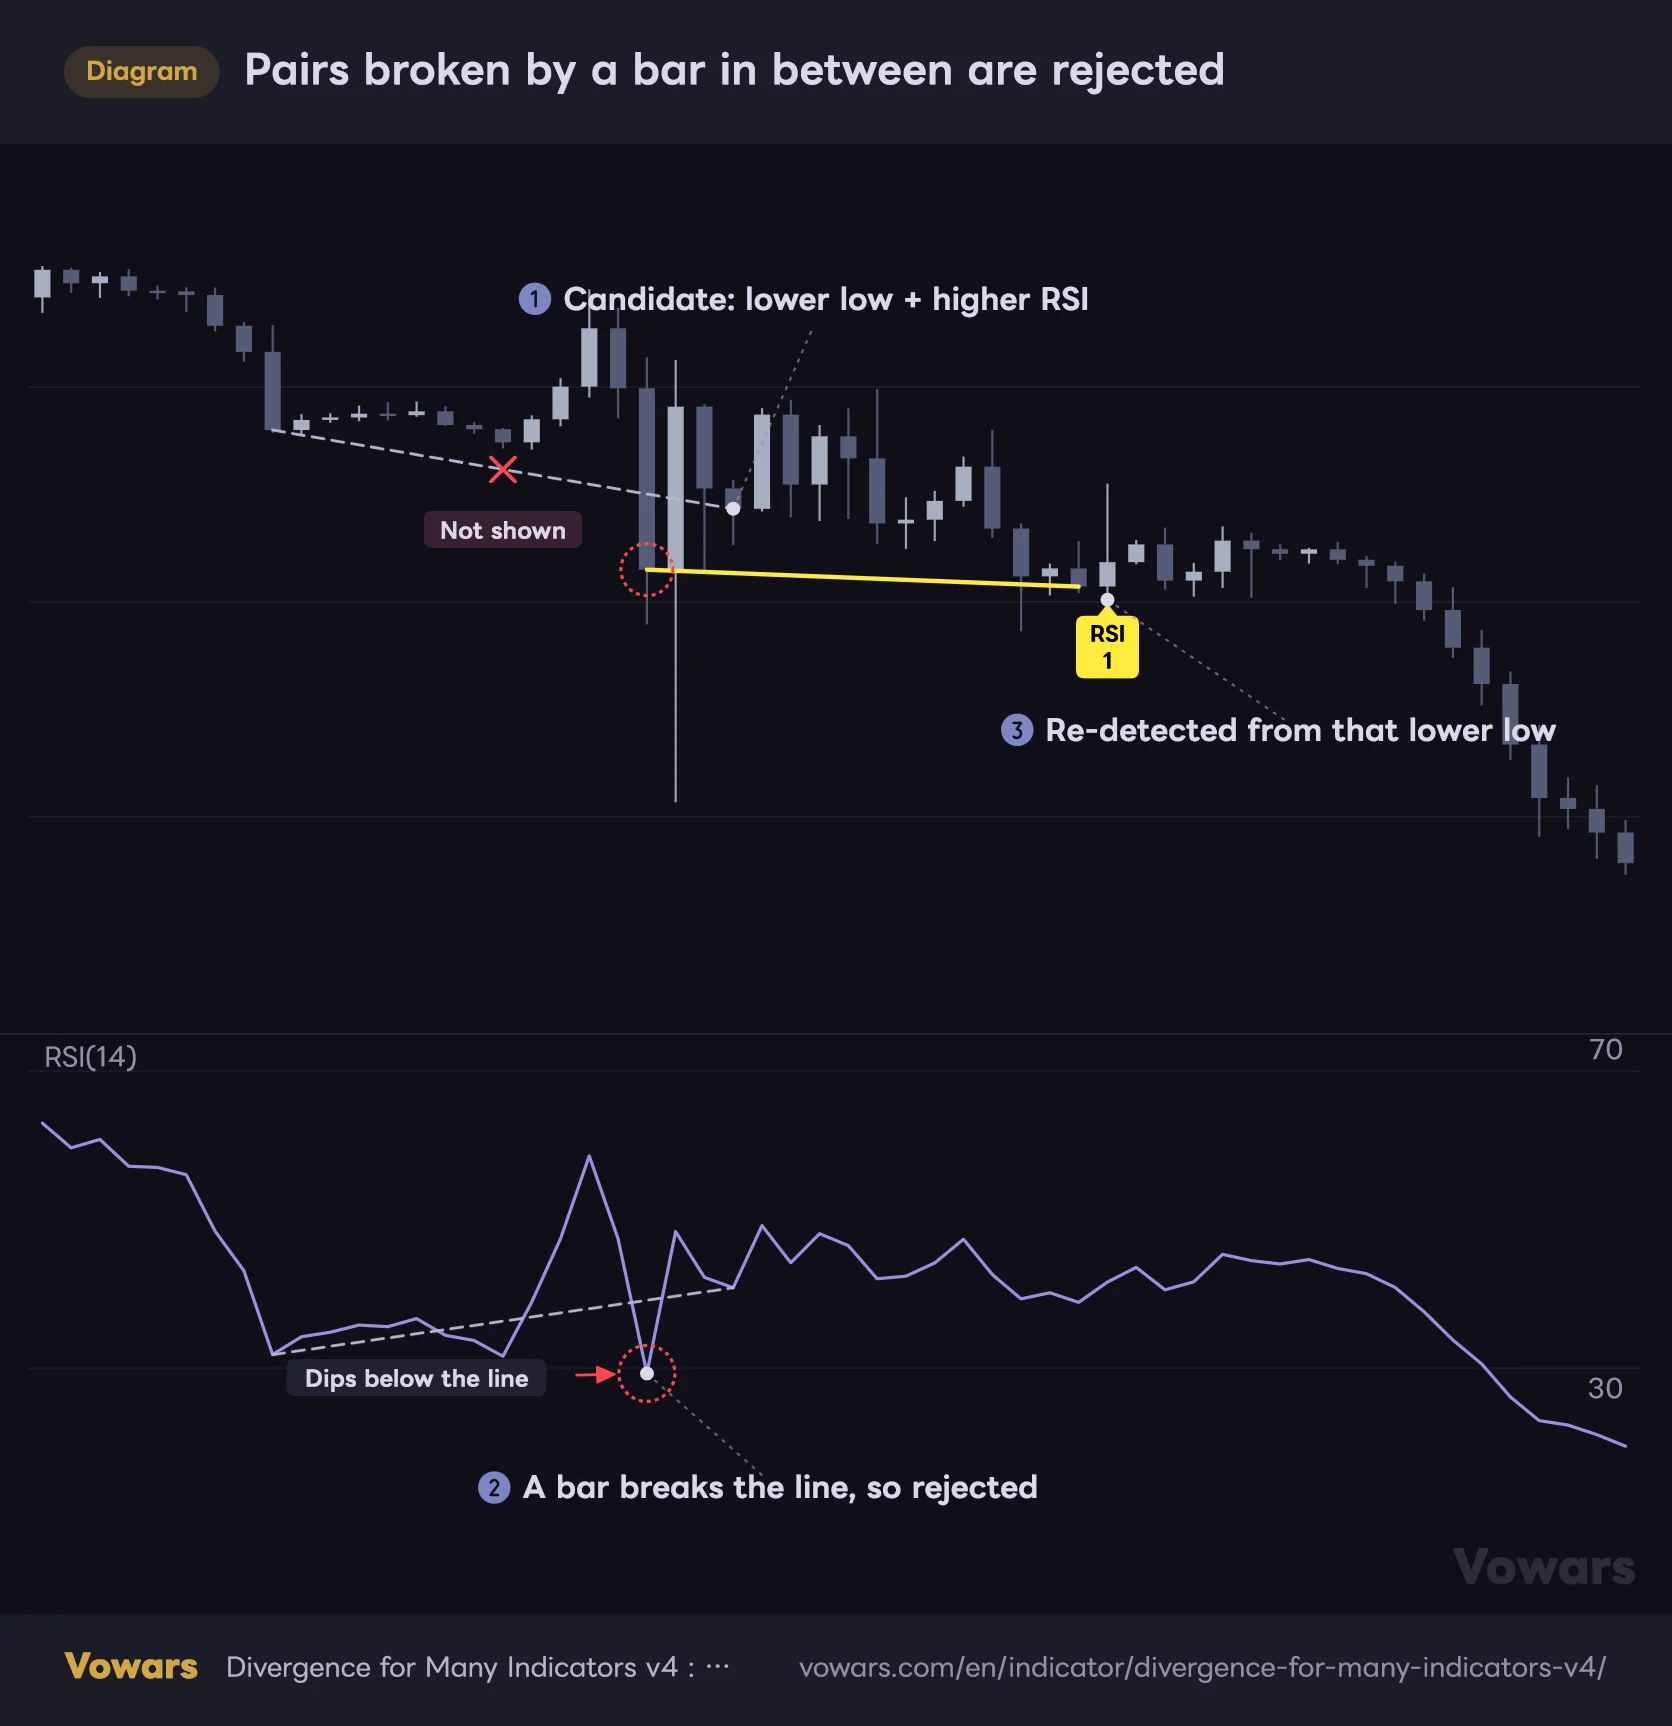
Pairs where something cuts through the line get thrown out
There’s another mechanism that’s easy to miss but really matters. Draw a straight line between the two points, and it checks whether any bar in between pierces that line. It looks at both the indicator value and the close, and if either one dips below the line (above it, for bearish setups), the pair is rejected.
Pairs broken by a bar in between are rejected
"Divergence for Many Indicators v4" also checks that no low cuts in between the two points.
Vowars DE ver.3.5.0
In the diagram, there’s a single flush candle between the two candidate points, and both RSI and the close punch well through the line. In a case like that, the real low is the flush in the middle. “Divergence for Many Indicators v4” doesn’t ignore it, and later picks up a new pair that starts from that flush instead. This is the part that made me think, “OK, this is well built.” Divergences that would look off if you drew the line yourself are filtered out from the start.
Set Source for Pivot Points to High/Low and swing highs, swing lows, and the line endpoints are all based on highs and lows. The check for bars piercing the line, however, still uses the close. A bar that only wicks through for a moment won’t get the pair rejected.
Yellow, Navy, Green, Red: The Four Divergence Patterns
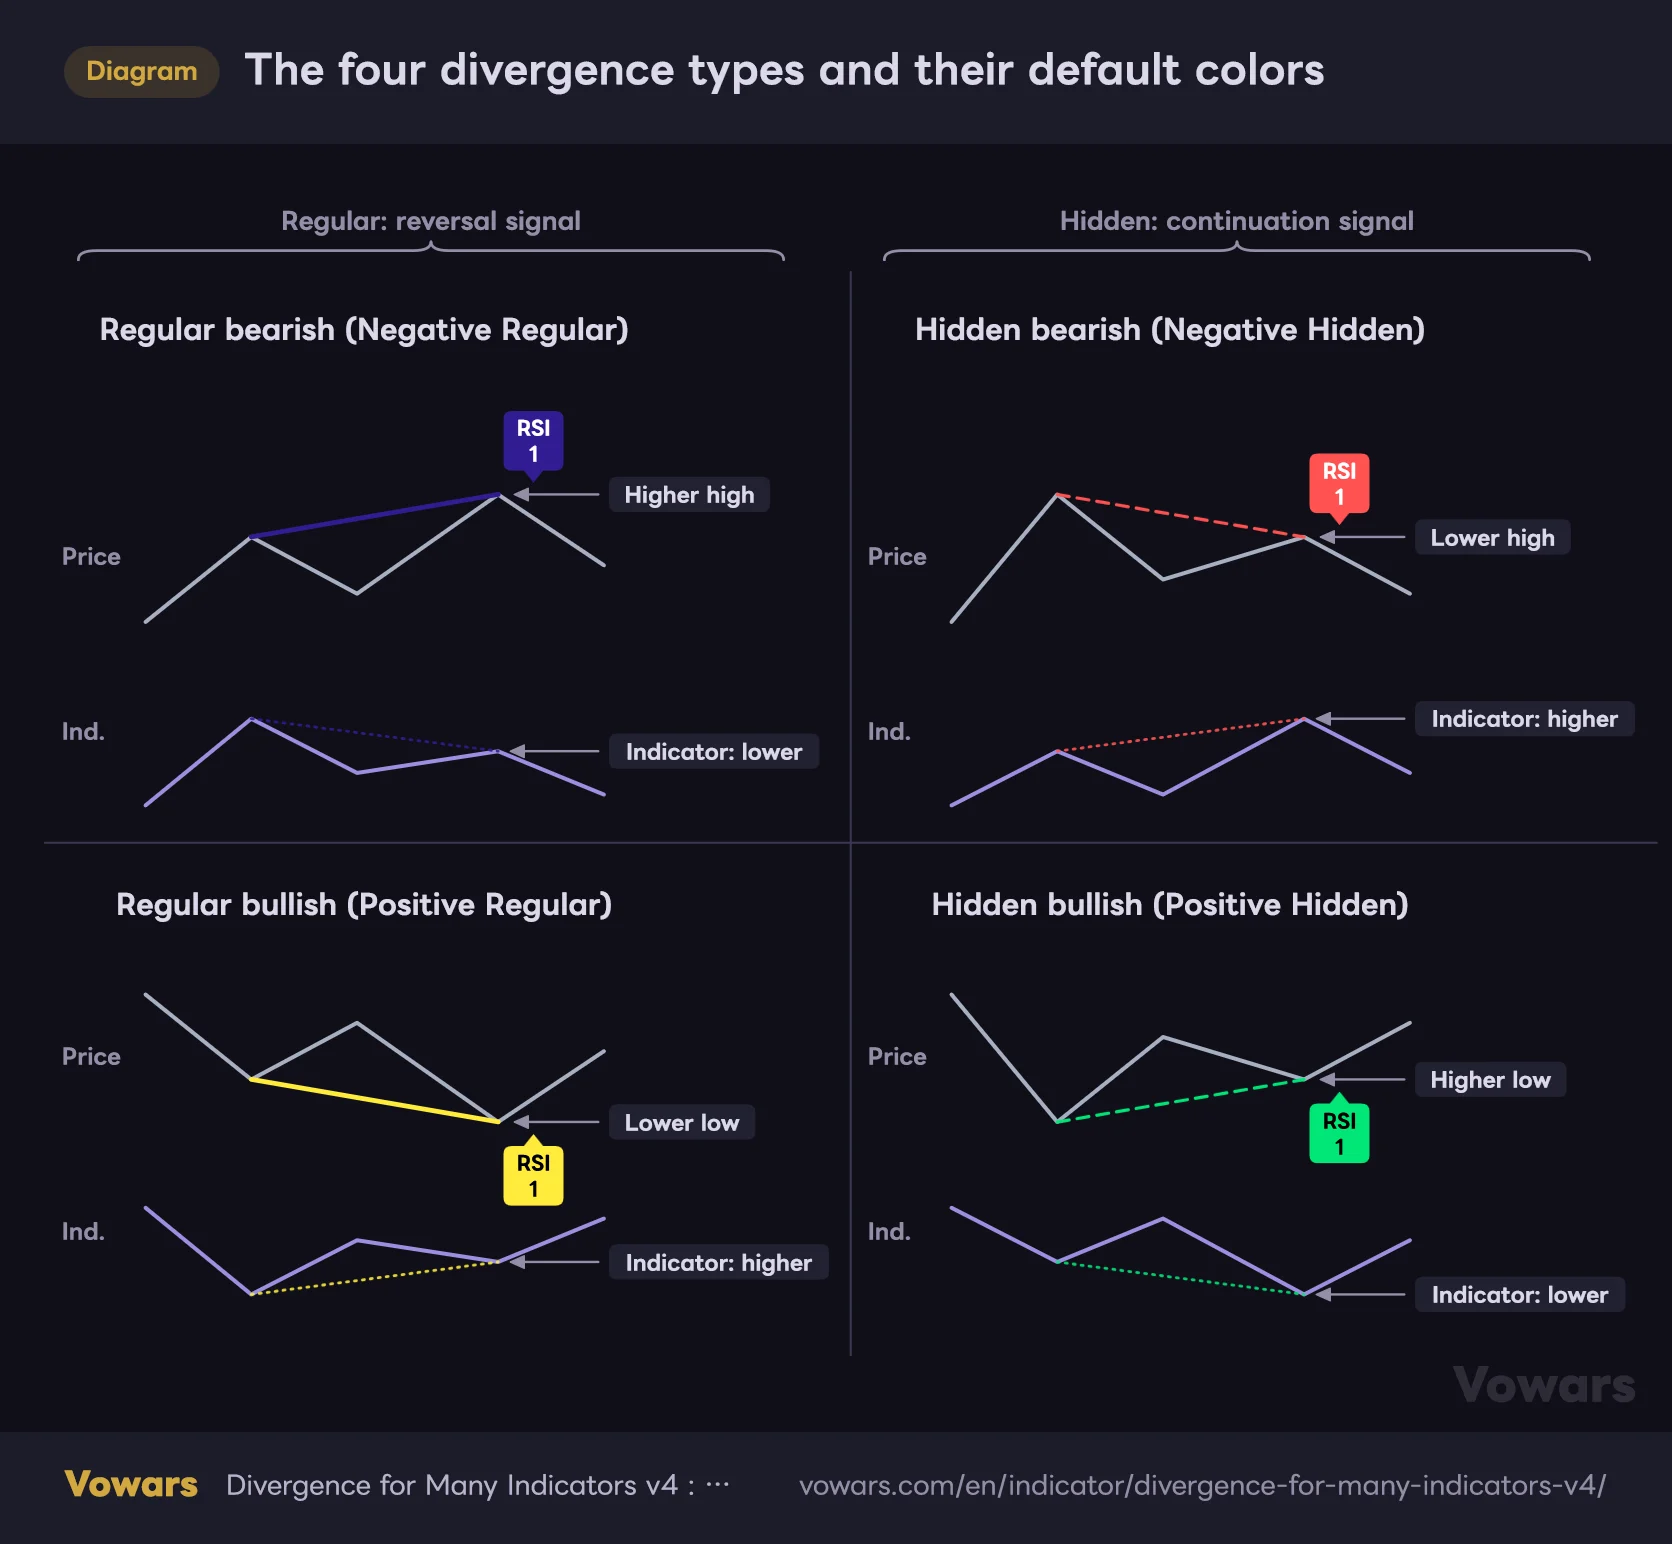
By default, Divergence Type is set to Regular, so you only get two colors: yellow (bullish) and navy (bearish). Switch it to Regular/Hidden and the green and red hidden divergences are added.
The four divergence types and their default colors
Set "Divergence Type" to Regular/Hidden and all four types are shown.
Vowars DE ver.3.5.0
Regular divergence means price pushed further but momentum didn’t follow, so it’s a hint that the trend is running out of steam or about to reverse. Hidden divergence is the opposite: price only pulled back a little, but the indicator dropped hard. A green label on a dip in an uptrend is used as a sign that the trend may still have legs.
| Type | Price | Indicator | Default color and line |
|---|---|---|---|
| Regular bullish (Positive Regular) | Lower low | Higher low | Yellow, solid (width 2), black label text |
| Regular bearish (Negative Regular) | Higher high | Lower high | Navy, solid (width 2), white label text |
| Hidden bullish (Positive Hidden) | Higher low | Lower low | Green, dashed (width 1), black label text |
| Hidden bearish (Negative Hidden) | Lower high | Higher high | Red, dashed (width 1), white label text |
Honestly, the navy labels get pretty lost on a dark background. I use a dark theme, so I changed the Negative Regular Divergence color to a lighter purple. Every color and line width can be changed in the settings, so feel free to tweak anything that’s hard to read.
Only the “Last One” Per Swing Stays on the Chart
This was the behavior that made me go “wait, what?” the most. A label I’d been watching in real time was gone a few bars later. It’s not a bug. The author built it that way on purpose.
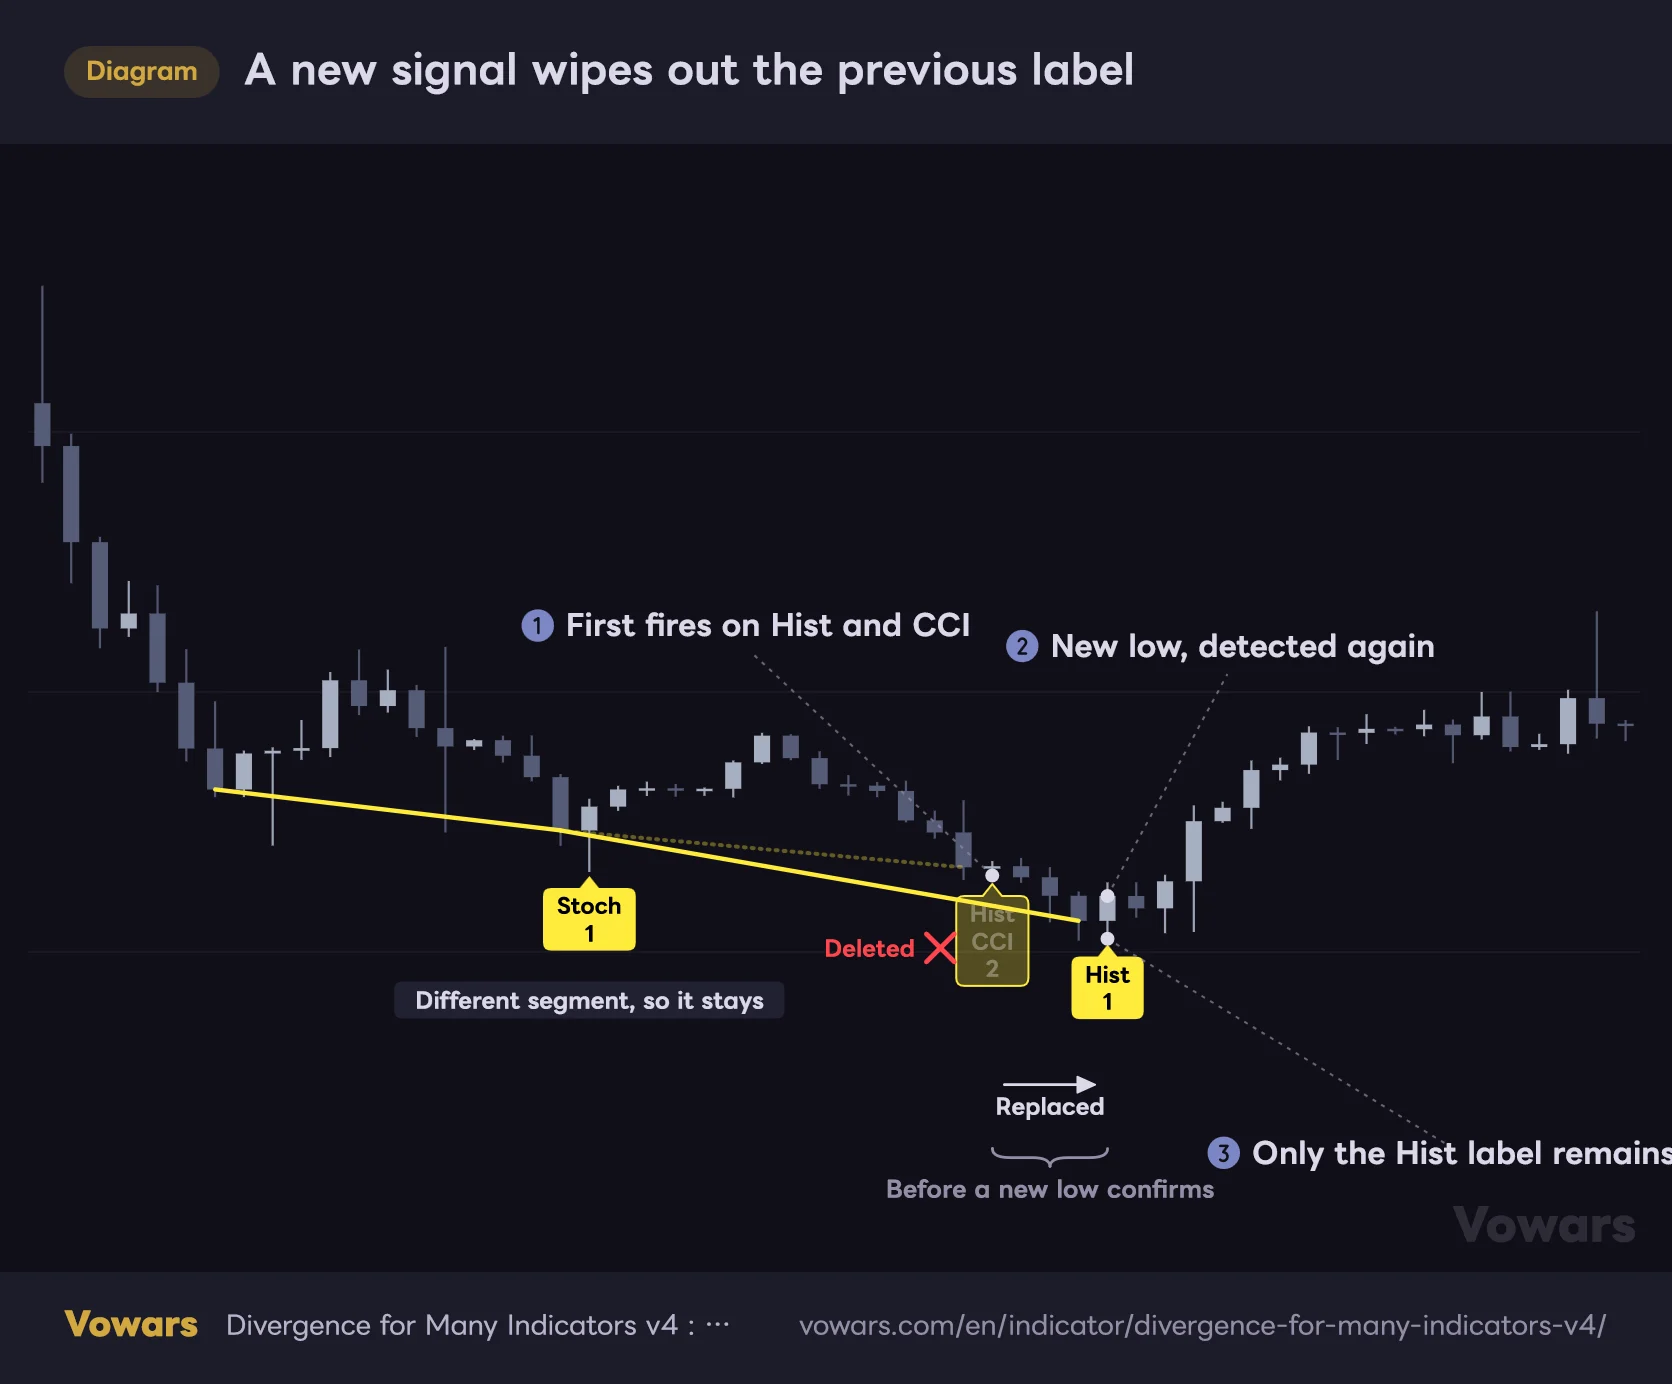
A new signal wipes out the previous label
Within the same pivot-low segment, only the last divergence found stays on the chart.
Vowars DE ver.3.5.0
Once a bullish divergence is found, if another bullish divergence shows up before a new pivot low is confirmed, the previous label and line are deleted and replaced by the new ones. The bearish side works the same way, with a newly confirmed pivot high acting as the reset point. In the release notes, the author explains this is meant to cut down on unnecessary lines and labels.
It definitely keeps the chart clean. But as in the diagram, the first label (“Hist and CCI, 2”) can disappear and leave only a later “Hist, 1” behind. When you scroll back, you can no longer see that an earlier bar actually had more indicators flashing a signal.
“Divergence for Many Indicators v4” deletes older labels when a newer signal comes in. On top of that, the check also runs on the live bar, so labels can appear and disappear before the bar closes. The labels you see on a historical chart don’t match what you would have seen in real time. If you want to know exactly what showed up and when, step through the chart bar by bar with Bar Replay and watch each label appear and disappear.
Note that this replacement is different from Show Only Last Divergence. Turn that on and everything except the latest bullish and bearish pair is removed, regardless of pivot resets. It’s meant for people who only care about the current state, and you lose any way to follow the history.
One more thing: it draws at most 400 labels and 400 lines. Once it hits the cap, the oldest ones are removed, so if you scroll far back on a timeframe with lots of bars, like the 1-minute, you may find no labels left on the left side.
How to Read the Numbers: What I Learned Using It on Bitcoin
From here on, these are my takeaways from watching it on actual Bitcoin charts. Everything is on default settings.
On the 1H, even a “7” didn’t stop the selloff
On the 1H chart in early September 2026, yellow labels with big numbers like “7” and “6” kept printing in the middle of the selloff. On one bar, seven indicators were diverging at the same time: RSI, Stochastic, CCI, OBV, VWMACD, CMF, and MFI. With that much confluence, it’s tempting to think “this has to be the bottom.” But price kept falling and put in an even lower low a few days later.
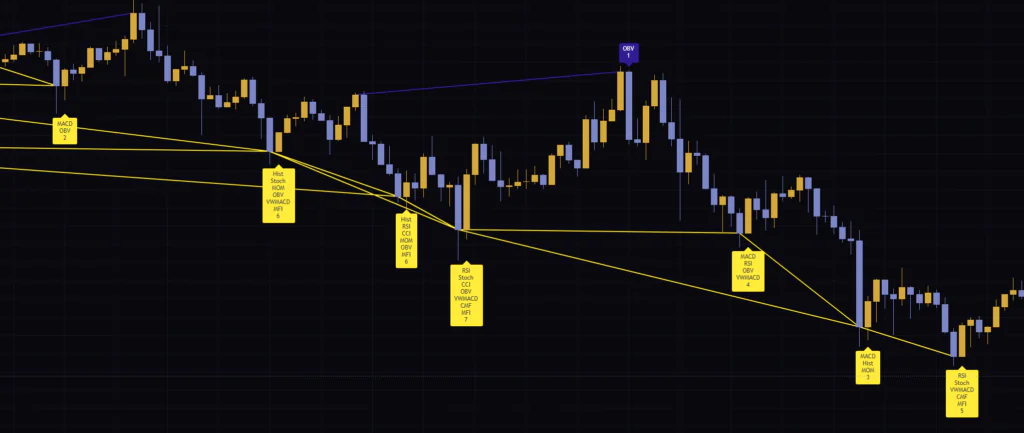
The mechanism above explains why. The newer point is always the previous bar, so as long as the decline continues, new bars keep meeting the conditions. The number on a label tells you how many indicators are diverging right now, not how likely a reversal is. Get this wrong and you’ll end up catching the falling knife over and over.
On the 4H and daily, labels spread out a lot
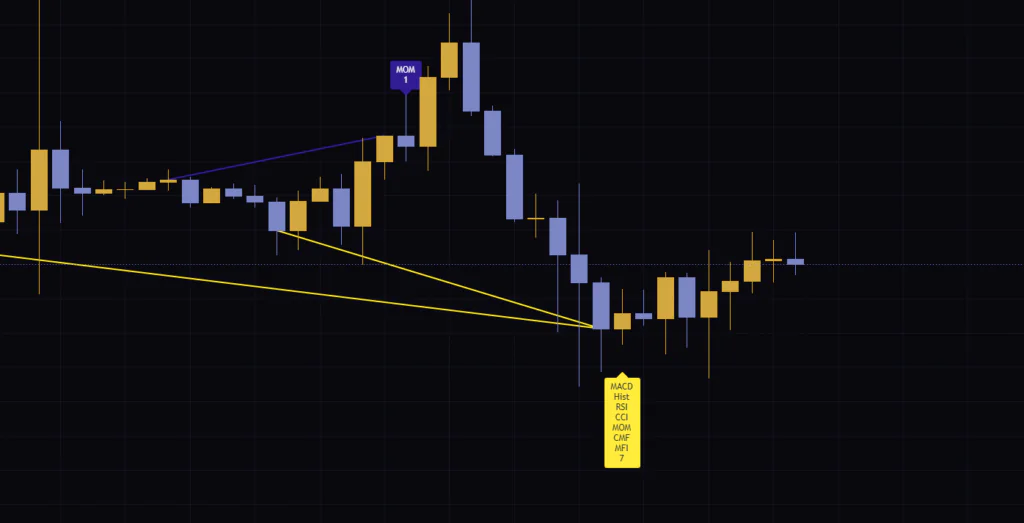
Switch to the 4H and the labels calm down considerably. At the mid-September low, there was a yellow label with seven indicators lined up (MACD, Hist, RSI, CCI, MOM, CMF, and MFI), and it was much easier than on the 1H to see which low actually mattered.
The daily thins things out even further. The four-indicator label (Hist, RSI, Stoch, MOM) near the late-June 2026 low marked the start of the rally that followed. During the February selloff, a “1” from VWMACD alone printed first, followed by a yellow label with five indicators. Higher timeframes giving more weight to signals is true of divergence in general, but with “Divergence for Many Indicators v4” you can actually see it in how the numbers change.
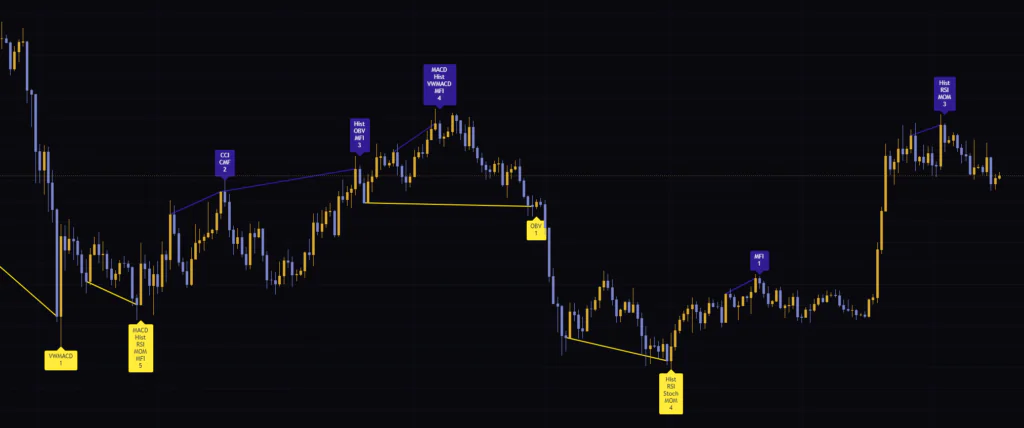
Strictly speaking, the number on a label is the count of divergences found. With Regular only, each indicator can produce at most one, so the number matches the names listed. With Regular/Hidden, the same indicator can show both a regular and a hidden divergence, so the name is listed once but the count goes up by two. Also, the label takes the color of the last divergence type found.
Pivot Period Sets “What to Compare,” Confirmation Sets “When to Fire”
There are quite a few settings, but only some of them really change how it looks and behaves. Let’s start with Pivot Period, which decides which swing highs and lows get used for comparison.
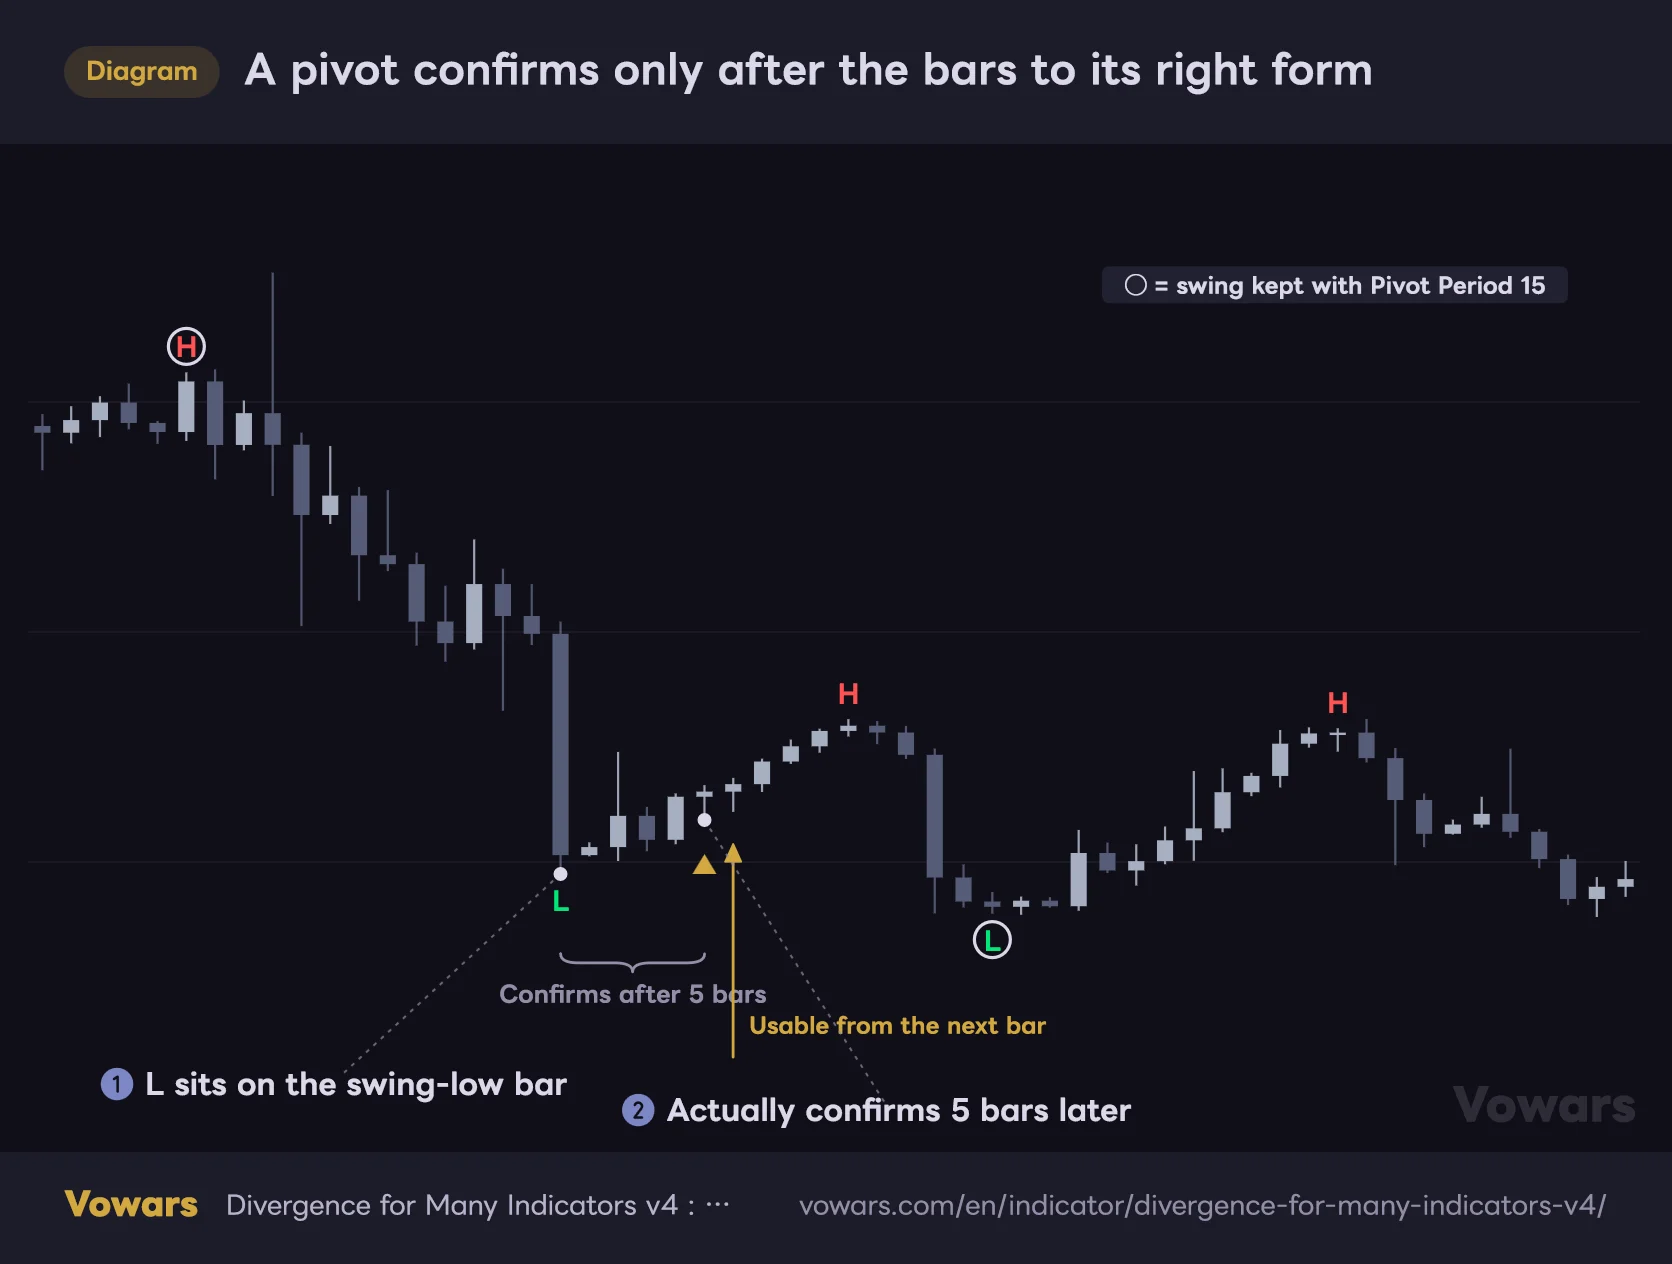
A pivot confirms only after the bars to its right form
Turn on "Show Pivot Points" to see the H and L swings that get used for comparison.
Vowars DE ver.3.5.0
With Pivot Period at 5, a close that’s higher (lower) than the 5 bars on each side becomes a swing high (low). The catch is that a swing low only confirms once 5 bars have formed to its right. Turn on Show Pivot Points and you get H and L markers, but they’re placed back on the pivot bar after confirmation, so in real time they show up 5 bars late.
Raise the value and smaller swings get ignored, leaving only the more obvious highs and lows as comparison points. You get fewer labels, but since the newer point is still the previous bar, the signal itself doesn’t get much slower. The only delay is the wait for the older swing low to confirm.
| Parameter | Default | Recommended | Effect |
|---|---|---|---|
| Pivot Period | 5 (1–50) | 5–10 | Bars on each side used to detect swing highs and lows. Higher values keep only the more obvious swings for comparison, so you get fewer labels |
| Source for Pivot Points | Close | Close | Whether swing points and line endpoints use the close or the high/low |
| Divergence Type | Regular | Regular for reversals, Regular/Hidden for buying dips | Which divergences to show. Choose Regular, Hidden, or Regular/Hidden |
| Show Indicator Names | Full | Full | How indicator names appear in labels. Full, First Letter, or Don’t Show |
| Minimum Number of Divergence | 1 (1–11) | 2–3 on lower timeframes | No labels or lines on bars below this count. Bullish and bearish divergences are counted together |
| Maximum Pivot Points to Check | 10 (1–20) | 10 | Number of past swing points to check |
| Maximum Bars to Check | 100 (30–200) | 100 | Swing points older than this are ignored |
| Show Divergence Number | On | On | Shows the count at the end of each label |
| Show Only Last Divergence | Off | Off | Keeps only the latest bullish and bearish pair |
| Don’t Wait for Confirmation | Off | Off | Skips the confirmation bar and uses the live bar for comparison |
| Show Divergence Lines | On | On | Shows divergence lines |
| Show Pivot Points | Off | On until you get used to it | Shows H and L markers on swing highs and lows |
| MACD / MACD Histogram / RSI / Stochastic / CCI / Momentum / OBV / VWmacd / Chaikin Money Flow / Money Flow Index | All on | Turn off the 4 volume-based ones on symbols without volume | Whether each indicator is used for detection |
| Check External Indicator | Off | On only when needed | Adds the indicator selected in External Indicator to detection |
| Show MAs 50 & 200 | Off (green / red) | On | Shows 50- and 200-period simple moving averages of the close |
Beyond these, you can change the colors for the four divergence types (Positive Regular Divergence and so on), the label text colors, and the line style and width for regular and hidden divergences. Heads-up: the hidden line style option shows up in the settings as “Hdden Divergence Line Style,” with a letter missing, so keep that in mind when you look for it.
First Letter is easy to misread, even once you’re used to it
Setting Show Indicator Names to First Letter makes the labels slimmer, but MACD, Momentum, and MFI all show as “M,” and CCI and CMF both show as “C.” RSI is the odd one out and shows as “E.” That makes it impossible to tell which indicator is which, so I stick with Full. If you want smaller labels, I found it cleaner to go with Don’t Show and just read the number.
Suggested settings by timeframe
| Style | Timeframe | Suggested settings | Why |
|---|---|---|---|
| Scalping | 1m to 5m | Minimum Number of Divergence at 3, Maximum Bars to Check at 150–200 | Labels print constantly, so filter by count. 100 bars only covers a few hours |
| Day trading | 15m to 1H | Pivot Period 5, Minimum Number of Divergence at 2 | Keeps the default sensitivity while filtering out weak single-indicator signals |
| Swing trading | 4H to daily | Pivot Period at 8–10, everything else at default | Ignores minor swings and focuses on the major highs and lows |
These are how I set it up after comparing the display on Bitcoin. How noisy price action is varies by market, so the safe approach is to start with the defaults and, if you’re getting too many labels, raise Minimum Number of Divergence first.
Treat Don’t Wait for Confirmation as a last resort
Turn on Don’t Wait for Confirmation and it skips the confirmation bar, using the live bar itself as the newer point. Labels show up one bar earlier, but values keep moving until the bar closes, so labels flicker on and off noticeably more often. Even the author only says that some users prefer it. I recommend leaving it off.
Set Alerts to “Once Per Bar Close”
“Divergence for Many Indicators v4” comes with six alert conditions. If you can’t sit in front of the chart all day, waiting for an alert beats hunting for labels by eye.
| Alert name | Fires when |
|---|---|
| Positive Regular Divergence Detected | A yellow (regular bullish) label prints |
| Negative Regular Divergence Detected | A navy (regular bearish) label prints |
| Positive Hidden Divergence Detected | A green (hidden bullish) label prints |
| Negative Hidden Divergence Detected | A red (hidden bearish) label prints |
| Positive Divergence Detected | Any bullish divergence, regular or hidden |
| Negative Divergence Detected | Any bearish divergence, regular or hidden |
1Lock in your display settings first
Alerts run on the settings in place when you create them. If you want to change Divergence Type or Minimum Number of Divergence, do that before creating the alert. If you leave it on Regular, hidden divergence alerts will never fire.
2Pick the indicator and alert type under Condition
In the alert dialog, choose “Divergence for Many Indicators v4” under Condition, then pick what you want to be notified about from the table above. If you only care about bullish setups, “Positive Divergence Detected” covers it in one alert.
3Set the trigger to “Once per bar close”
With “Once per bar,” you’ll get pinged even if the condition was only met for a moment on the live bar. You get the notification on your phone, open the chart, and there’s no label anywhere. To avoid that, “Once per bar close,” which only evaluates closed bars, is the better fit.
Even when an alert fires on a closed bar, the label on the chart can still be replaced if another signal comes in later. If you get an alert but can’t find the label, check whether it has moved to a more recent bar.
Best Paired With the 200 SMA to Set Direction First
On its own, “Divergence for Many Indicators v4” will print navy labels in the middle of an uptrend and yellow labels in the middle of a downtrend. What helped most was bringing in an outside rule for which ones to take and which ones to skip. What I settled on is using the 200-period simple moving average (200 SMA) to define market direction.
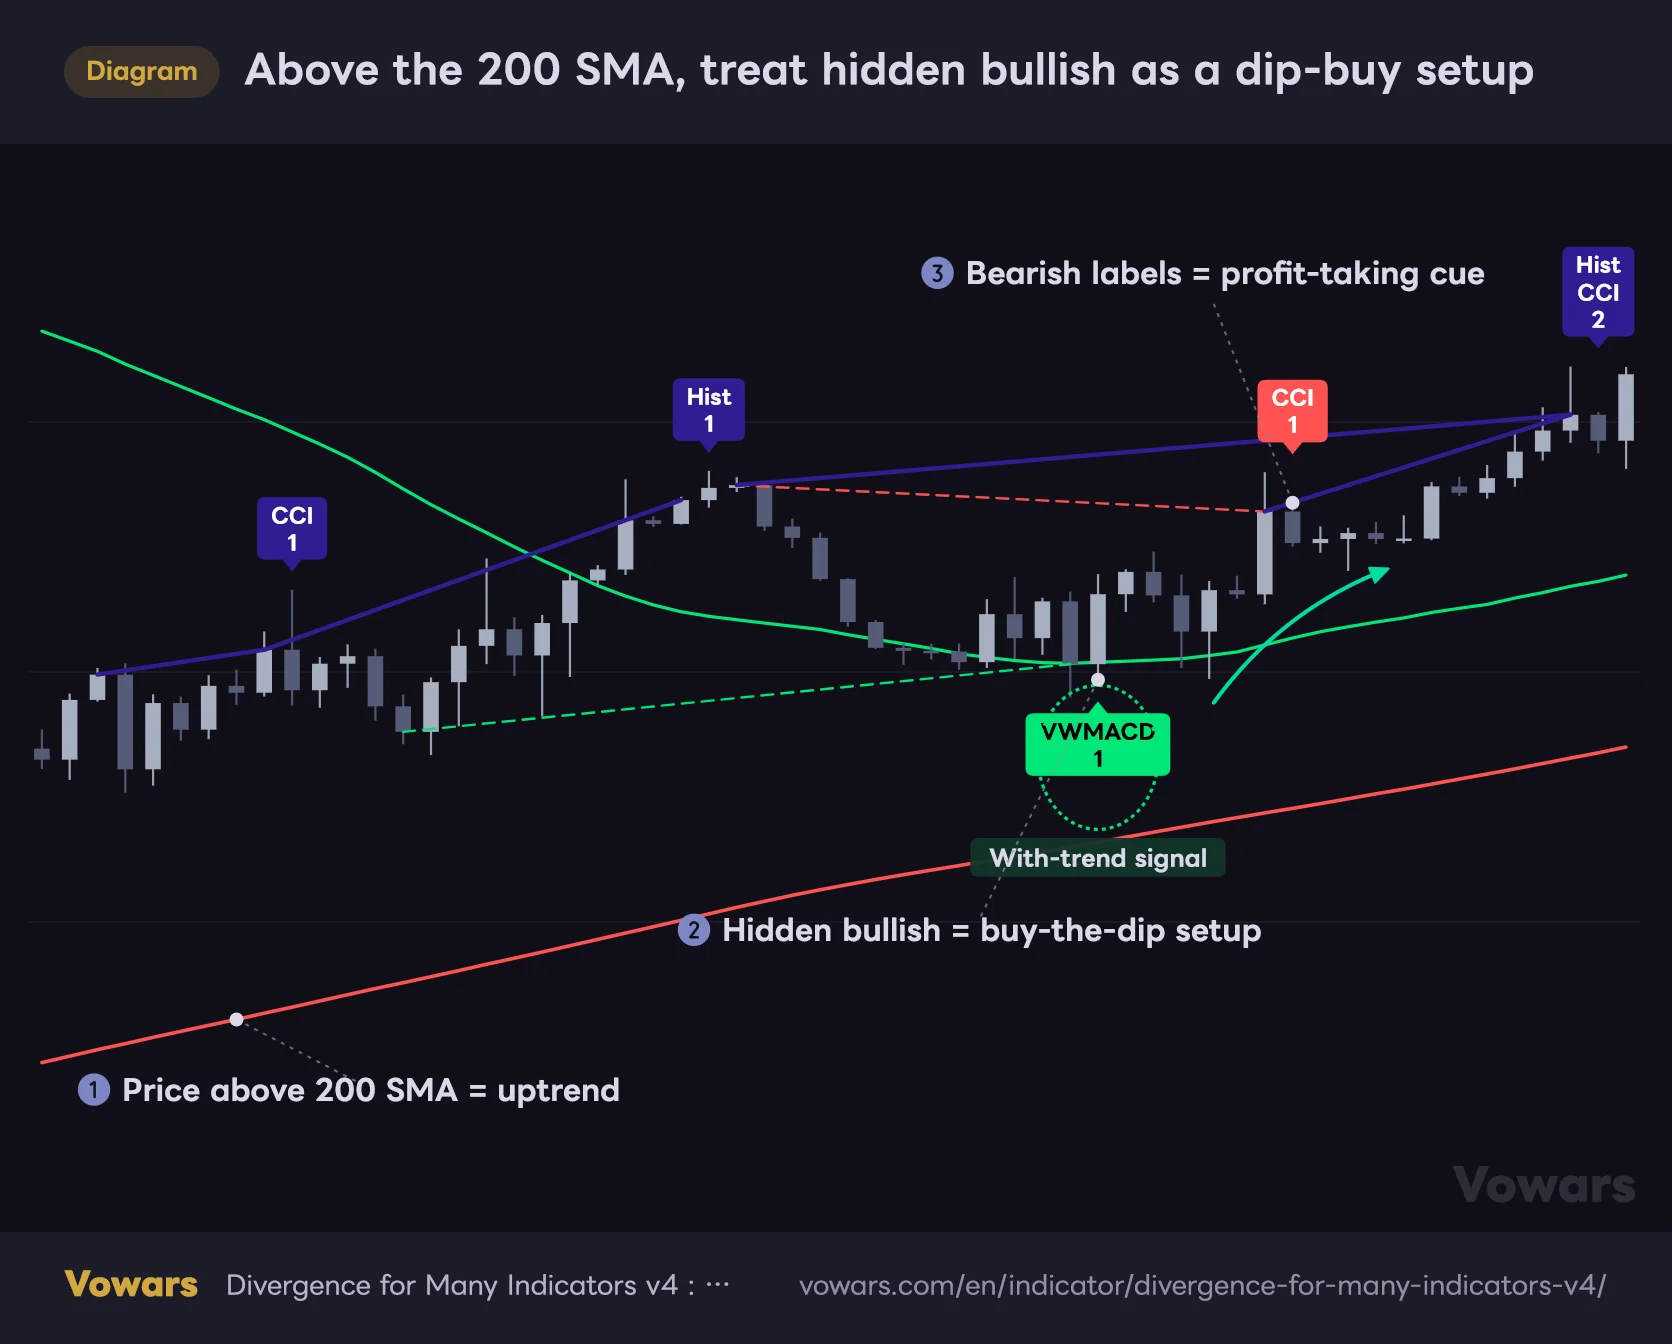
Above the 200 SMA, treat hidden bullish as a dip-buy setup
Setting direction with a long-term moving average makes it much easier to decide which labels to take.
Vowars DE ver.3.5.0
You don’t need to add the 200 SMA separately. Just turn on Show MAs 50 & 200. The rule is simple: when price is above the 200 SMA, treat hidden bullish (green) and regular bullish (yellow) divergences as buy-the-dip candidates. Don’t use the navy or red bearish labels to fade the move; use them only as a cue to think about taking profit on an open position. When price is below, flip it.
For this approach, you need Divergence Type set to Regular/Hidden. On the default Regular setting, the green labels, which are the with-trend signals, never show up. As in the diagram, green labels tend to print before the pullback gets deep, and when they line up with a dip toward the 50 SMA, I found them much easier to use as an entry reason.
Is price above the 200 SMA? Did a green or yellow label print? Did price take out the recent high on or after the bar following the label? Wait for all three before entering and you’ll cut down on buying in the middle of a selloff. Put your stop just below the swing low where the line starts, and you’re out as soon as the setup is invalidated.
Shines on Markets With Real Volume and on Higher Timeframes
Four of the 10 indicators (OBV, VWMACD, CMF, and MFI) are calculated from volume. On markets with real exchange volume like Bitcoin, gold futures, or high-volume ETFs like SPY, all 10 indicators do their job.
With forex, what “volume” means depends on your data provider. On symbols without volume data, those four can’t produce meaningful signals. Before adding it, check that TradingView’s built-in Volume indicator actually shows values. If it doesn’t, turn those four off so you don’t overestimate the label counts.
Where it shines
- Checking for fading momentum ahead of major highs and lows on the 1H and above
- Looking for hidden divergence on dips in an uptrend or rallies in a downtrend
- Getting a quick read on divergence without stacking multiple oscillators
- Crypto, futures, and major ETFs with real volume data
- Waiting on alerts and confirming on a higher timeframe when one fires
Where it can mislead you
- Strong one-way trends (divergence labels keep printing)
- Scalping on the 1m or 5m (way too many labels unless you filter by count)
- Symbols with no volume data, or unusual volume data
- Judging a strategy’s performance from labels on a historical chart alone
- Markets where a single flush or spike candle reshuffles the swing points
In terms of trading style, I found it most useful for day trading and swing trading. Divergence carries more weight on higher timeframes by nature. Spotting a signal on the 1H and confirming it on the 4H felt like the right combo.
Divergence only tells you momentum is fading. It won’t tell you when the reversal happens. In a strong trend, it’s not unusual for price to keep running while divergence stays in place. Combine it with other reasons to trade, like moving averages, support and resistance, or candlestick patterns.
A Reliable Lookout That Folds 10 Oscillators Into One Label
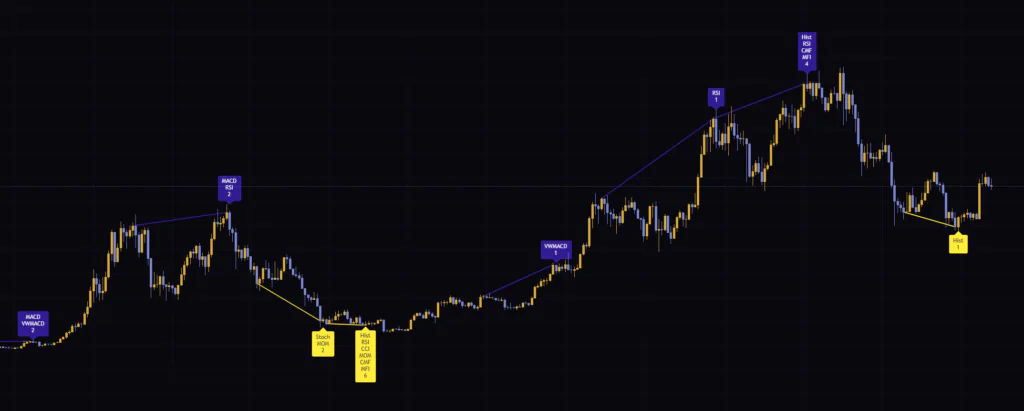
What makes “Divergence for Many Indicators v4” great is that it scans 10 indicators for divergence at once and shows you the confluence as a number. It also filters out pairs where something cuts through the line, so the lines it draws actually make sense. And because it compares against the previous bar, signals come early, which is genuinely practical.
On the other hand, only the last signal survives within the same swing, so a historical chart won’t look the way it did in real time. And the number only tells you how many indicators are diverging right now. Keep those two things in mind, set your direction with something like the 200 SMA, and it makes a lookout for dip and rally setups that you can rely on for a long time. If you’ve been stacking oscillator after oscillator, try it on the 1H and 4H with default settings first and compare how the labels show up.