
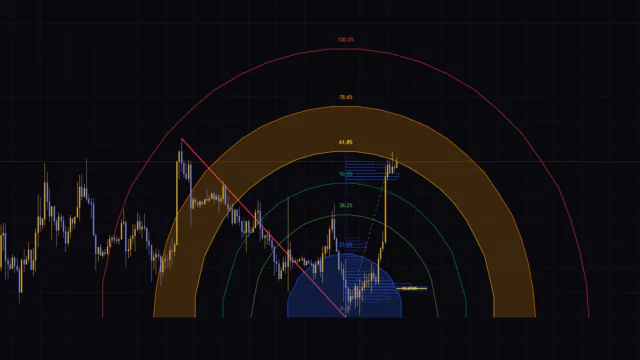
 IndicatorSwing Fibonacci Arcs & Volume Profile
FIBONACCIVOLUME
How to Read the Arcs and POC in “Swing Fibonacci Arcs & Volume Profile”
Difficulty
Intermediate
このページは日本語でもご覧いただけます。
日本語で見るIndicators that use Fibonacci ratios to automatically plot pullback levels and take-profit targets. Retracements, extensions, and Fib time zones are common types.
With Fibonacci, the levels depend entirely on which swing high and low you anchor to. For auto-drawn tools, what matters is whether that anchor logic matches how you read the market. We check how each script picks its anchors and show visually how the levels shift depending on which swing it uses.
IndicatorSwing Fibonacci Arcs & Volume Profile
FIBONACCIVOLUME
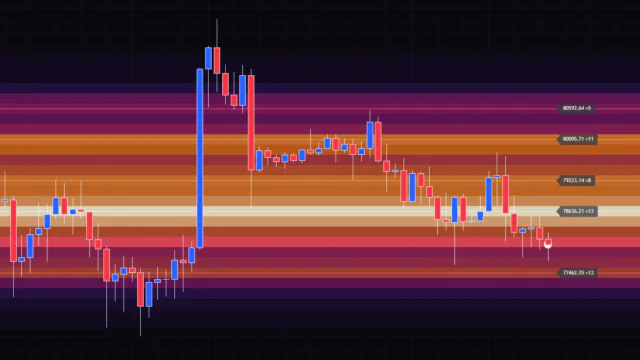 IndicatorFibonacci Gravity Clusters
SUPPORT & RESISTANCEFIBONACCI
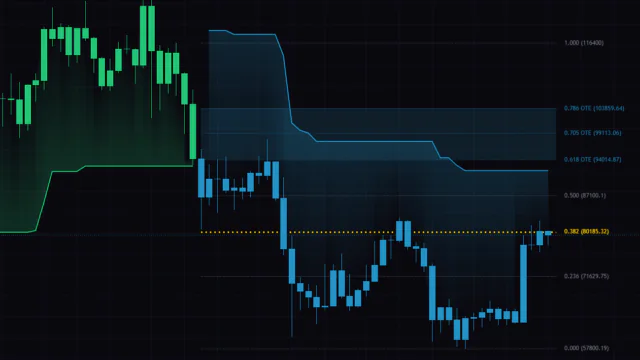 IndicatorSupertrend + Fibonacci OTE Grid & Bands
TRENDFIBONACCI
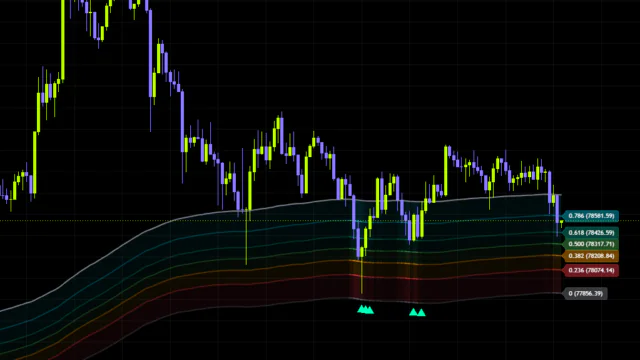 IndicatorFibonacci Trend Continuation Signals
FIBONACCI
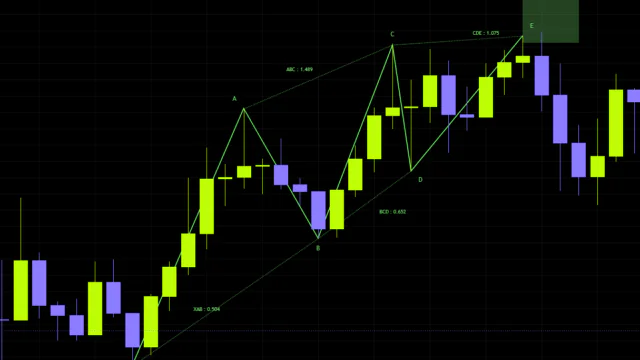 IndicatorBYO Pattern V1
Add Vowars as a preferred source
See more Vowars articles in Google's Top Stories and AI answers. Google's settings page will open. Select Vowars there.
Add on GoogleNew article notifications
Get a browser notification when we publish a new indicator review. You can turn it off at any time.