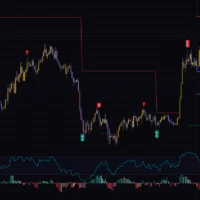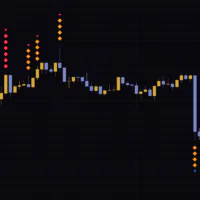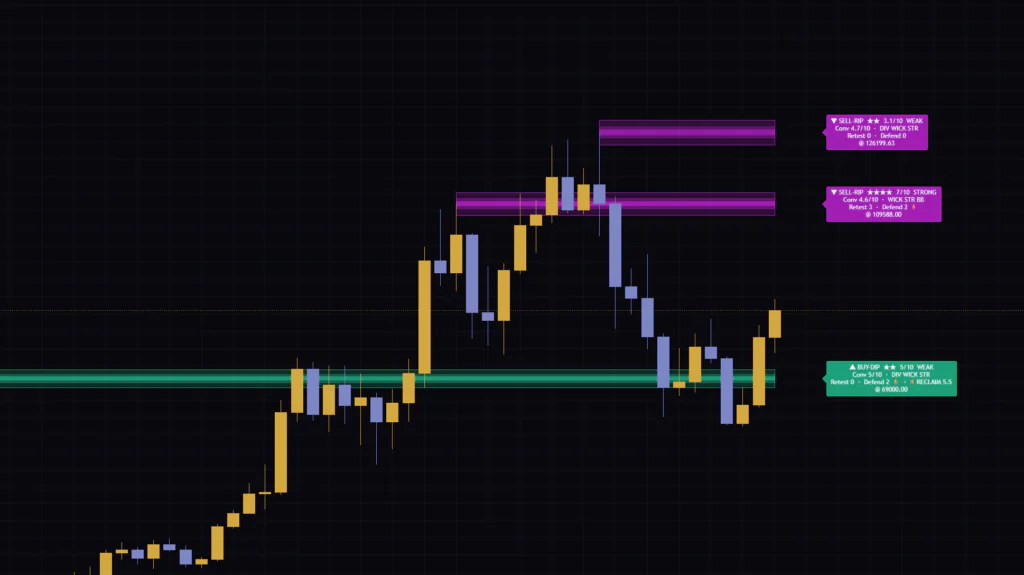


“Strong Contrarian Zones” only draws zones where buyers or sellers overextended
Throw a support and resistance indicator on a chart and you often end up with so many lines you have no idea which ones to trust. I’ve been there more times than I can count. When I first loaded “Strong Contrarian Zones”, I honestly braced myself for yet another zone indicator.
Once I actually used it, though, it felt different. “Strong Contrarian Zones” doesn’t draw a line at every swing high and low. The moment a swing forms, it scores how overextended the move was from seven angles, and only swings that clear the bar are kept as zones. Ordinary pullbacks and bounces get nothing.
There are two kinds of zones. Teal zones form at swing lows and are labeled “BUY-DIP” (buy-the-dip candidates). Magenta zones form at swing highs and are labeled “SELL-RIP” (sell-the-rip candidates). On top of that, the indicator watches for price to push out of a zone and then come back in, the classic sweep and reclaim, and treats that as the contrarian trigger.
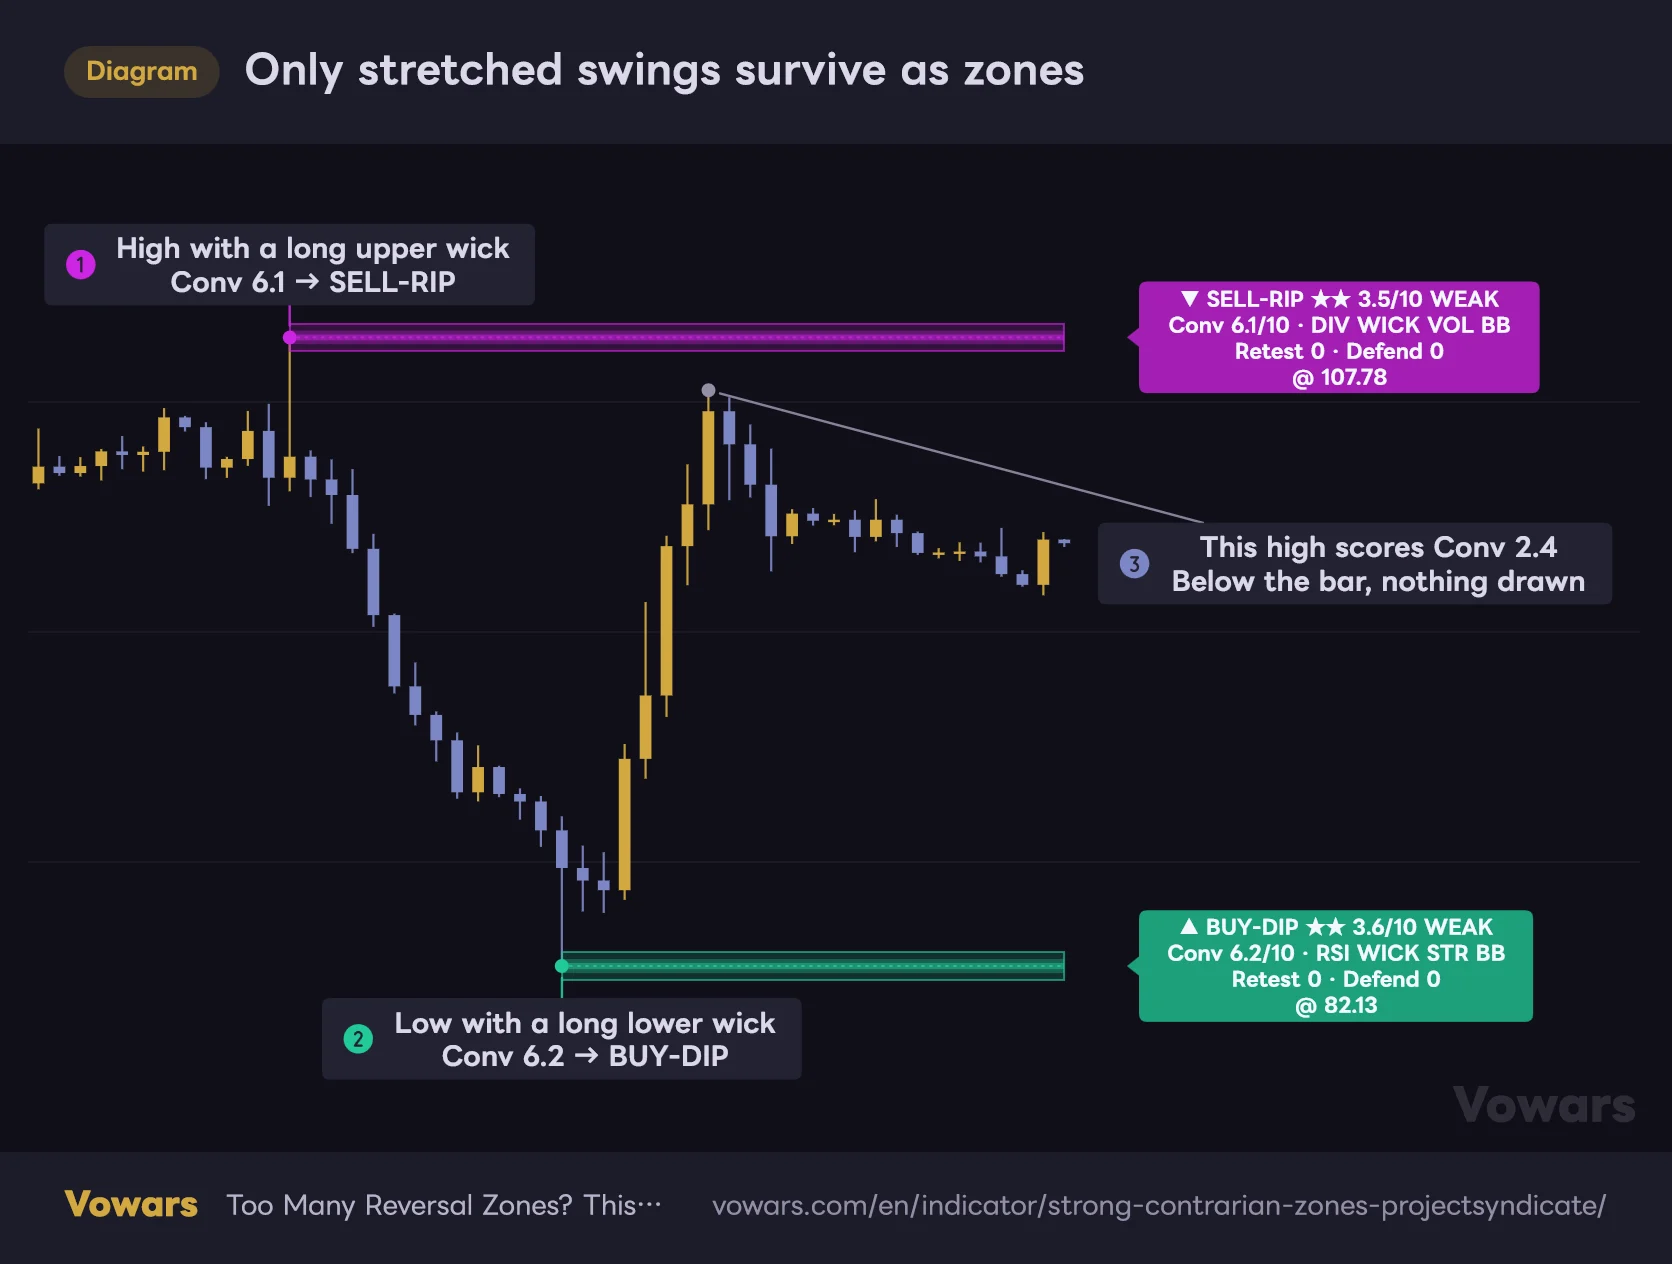
Only stretched swings survive as zones
Only the high rejected by a long upper wick and the low bought up by a long lower wick get a zone.
Vowars DE ver.3.12.4
In the figure above, zones only appear at the high with a long upper wick Figure ① and at the low bought up by a long lower wick Figure ②. The prominent high in between Figure ③ also has two factors firing, but the total score falls short, so nothing is drawn. That idea, that some swings deliberately get no zone, is the single most important thing to understand before you use “Strong Contrarian Zones”.
In this review I walk through everything I verified on TradingView, from how to read the zones and labels to entries and settings.
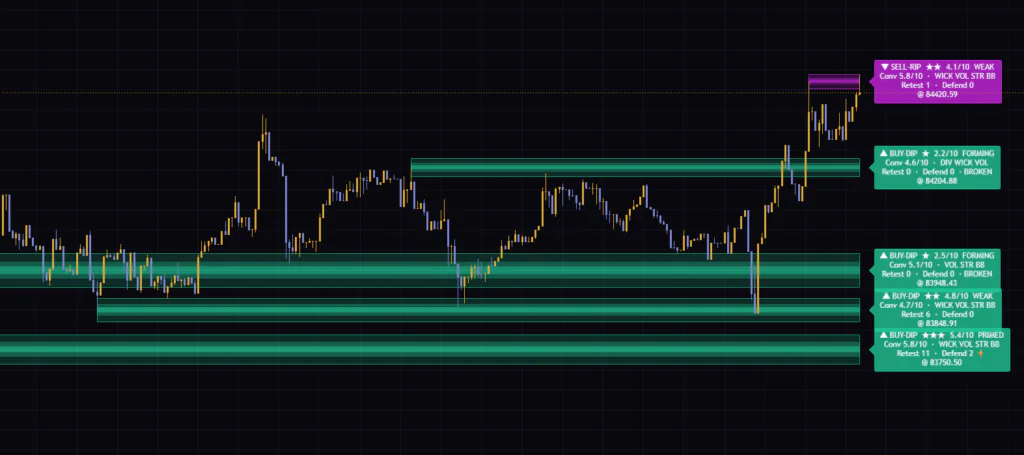
All you get on the chart is a band and a four-line label
“Strong Contrarian Zones” doesn’t use a separate pane, and it doesn’t plot moving averages or a dashboard. The only things on screen are the zone bands and the labels to their right. The trade-off is that each label packs in a lot of information.
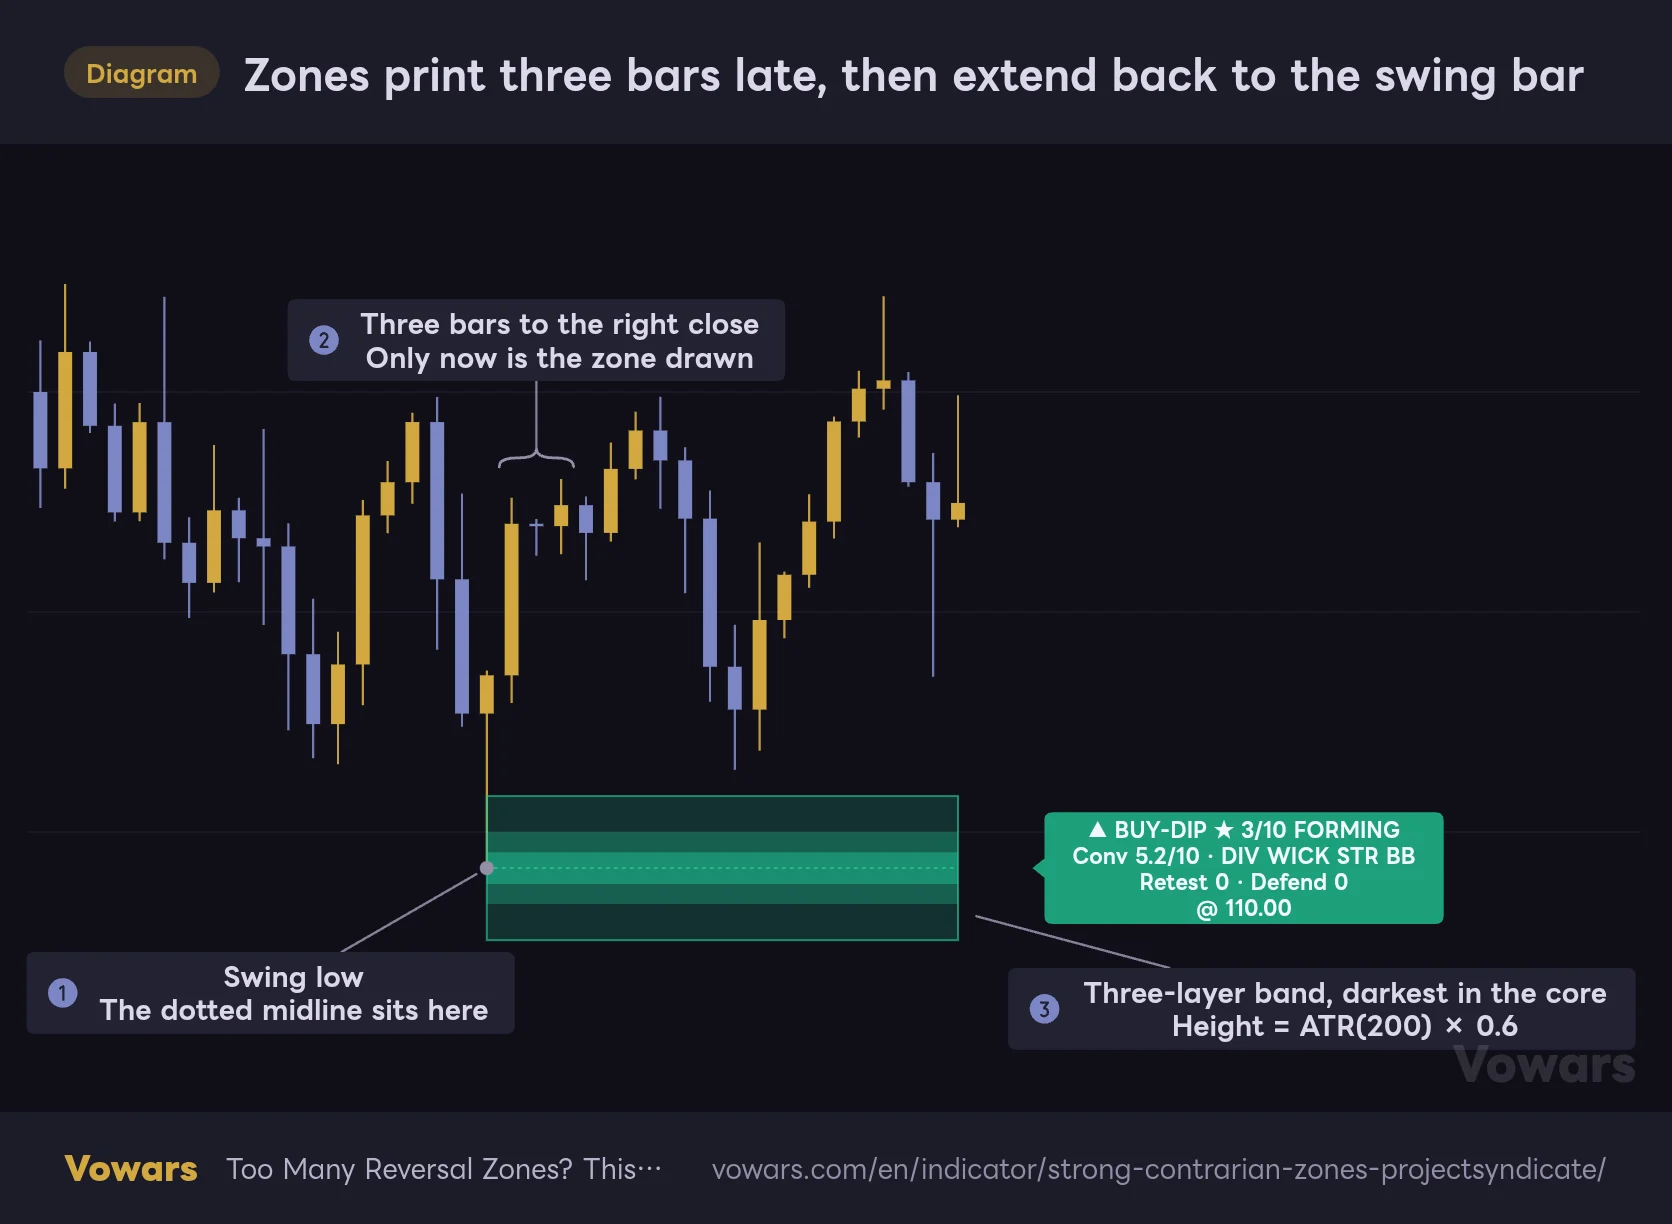
Three-layer bands, with the dotted midline at the swing price
Zones print three bars late, then extend back to the swing bar
Nothing appears on the bar that makes the low. The zone is drawn only once three bars have closed to its right.
Vowars DE ver.3.12.4
The center of each zone is the swing high or low itself. For a zone at a low, the dotted line sits exactly at the tip of the lower wick Figure ①. By default every zone is normalized to 0.6 × ATR(200), so they all have the same thickness.
Each band is built from three stacked layers: outer, middle and core. The closer to the center, the darker the color, and a higher zone score darkens it further. That said, the difference is subtle. Put a FORMING zone next to a STRONG one and you can’t really tell them apart at a glance. It’s safer to treat the number on the label as the real measure of strength.
A swing needs 10 bars on the left and 3 on the right to qualify. So nothing appears on the bar that prints the low; the zone is drawn only once three bars have closed to its right Figure ②. The left edge is then extended back to the swing bar, so on a historical chart it looks like the zone was there all along. Keep that three-bar lag in mind when you trade it live.
Reading the label top to bottom: grade, origin, history, price
With default settings the label sits outside the zone on the right, three bars past the latest candle Figure ②. Here’s what the four lines mean.
| Line | Example | Meaning |
|---|---|---|
| Line 1 | ▲ BUY-DIP ★★ 4.1/10 WEAK | Zone side, stars, current strength (0–10) and tier |
| Line 2 | Conv 5.8/10 · WICK VOL STR BB | The score at birth and the factors that fired at that moment |
| Line 3 | Retest 1 · Defend 0 · BROKEN | Retest count, defended reclaims and current state |
| Line 4 | @ 84420.59 | The zone’s anchor price (the swing high or low) |
There are three states that can appear at the end of line 3. “SWEEPING” means price has pushed outside the zone and the indicator is waiting for it to come back. “RECLAIM” means price came back and the reversal is confirmed, with a score attached. “BROKEN” means the zone gave way and flipped to the other side. Once Defend reaches 1 or more, a ⚡ icon is added.
The default for Label Placement is “Outside · Right”, so the label prints outside the zone on the right. If you’d rather keep it inside the box, pick “Inside · Right” or “Inside · Center” in the settings.
Whether a swing becomes a zone comes down to seven contrarian factors
Every time a swing confirms, “Strong Contrarian Zones” scores the swing bar from 0 to 1 on seven factors, takes a weighted average and scales it to 10. That’s the “Conv” on line 2 of the label. The default Min Conviction To Draw Zone is 4.5, so any swing with Conv below 4.5 never becomes a zone.
The abbreviations after Conv on line 2 are only the factors that scored 0.5 or more on that swing. They tell you at a glance what built the zone, so I think of it as the zone’s fingerprint. Here’s roughly where each factor shows up in the fingerprint for a swing low at default settings (swing highs are the mirror image).
| Tag | What it measures | Shows in fingerprint when (swing low) | Weight |
|---|---|---|---|
| RSI | RSI(14) oversold | RSI at or below 21 | 1.0 |
| DIV | Divergence vs the previous swing low | Price makes a lower low while RSI is at least 4 points higher | 1.3 |
| WICK | Lower wick of the swing bar | Lower wick is at least 22.5% of the bar’s range | 1.0 |
| VOL | Volume spike | Volume at least 1.6× its 20-bar average | 1.0 |
| STR | Stretch from the 50-bar mean (z-score) | −1.1σ or lower | 1.0 |
| PRS | Buying pressure over the last 20 bars | Buy share at 59% or higher | 0.9 |
| BB | Bollinger Band (20, 2σ) pierce | Low pokes below the lower band by 0.25 ATR or more | 0.9 |
DIV (divergence) carries the heaviest weight. Swings where price makes a new low but RSI refuses to follow are the ones that push Conv up fastest.
The tooltip for Oversold Reference (RSI ≤) reads as if RSI at or below 42 earns full credit. When I checked the actual behavior, full credit only happens at RSI 0, and RSI 42 scores zero. “RSI” only appears in the fingerprint when RSI is 21 or lower at a swing low, or 79 or higher at a swing high. Comparing fingerprints across my screenshots, RSI barely ever shows up, so don’t read “no RSI tag” as “not oversold.”
Volume is the other thing to watch. On symbols with no volume data, VOL and PRS always score zero. In that case Conv tops out at about 7.3 even if the other five factors are maxed. If you trade FX or index CFDs, check whether your symbol actually shows volume first. It saves you from wondering why so few zones appear.
The headline score and Conv are two different things, and mixing them up leads to misreads
This is what threw me the most when I first played with “Strong Contrarian Zones”. Conv was above 6, yet the line-1 score was in the 2s and labeled FORMING. My first thought was that I’d messed up a setting. Most of the zones on my 5-minute screenshot look exactly like that.
The reason is that the line-1 score is driven mainly by what happened afterwards, not by how good the zone looked at birth. Here’s the breakdown.
| Component | Weight | Maxes out at |
|---|---|---|
| Conv (score at birth) | 35% | Conv 10 |
| Retest | 25% | 4 retests |
| Defend (defended reclaims) | 25% | 2 defends |
| Wick / penetration depth | 7.5% | Average of the birth wick and retest penetrations reaches 1 ATR |
| Volume | 7.5% | Average volume over the zone’s life reaches the current 20-bar average |
With that weighting, a zone that has never been touched caps out at 5.0 even with Conv 10. A fresh zone with Conv 5–6 typically sits somewhere in the 2s or 3s. On the flip side, the “★★★★ 7.4/10 STRONG” zone I saw on the 30-minute chart had a Conv of just 5, but it built up its score through 4 retests and 3 defends.
The line-1 score and stars grow each time price tests the zone and it holds. A new zone showing FORMING or WEAK simply means it has no track record yet. Read line 2 (Conv and the fingerprint) to judge where a zone came from, and line 1 to judge how much it has earned since. Keeping those separate clears up most of the confusion.
| Score | Stars | Tier |
|---|---|---|
| 8.0+ | ★★★★★ | ELITE |
| 6.5+ | ★★★★ | STRONG |
| 5.0+ | ★★★ | PRIMED |
| 3.0+ | ★★ | WEAK |
| 1.5+ | ★ | FORMING |
| Below 1.5 | · | FORMING |
Those are the only five tiers.
The retest count has a quirk too. For a zone at a low, every bar whose low dips into the zone and closes above the lower edge counts as one retest. Three bars of chop inside the zone is Retest 3 on its own. The “Retest 11” in my screenshot means eleven bars touched the zone. It isn’t the number of separate bounces.
Zones that get ignored slowly lose score. By default the score decays over 300 bars from the last touch down to 0.65×, then stops there. Only the score drops; the band itself stays on the chart.
The entry trigger is the sweep and reclaim: pierce the zone, then take it back
The contrarian trigger in “Strong Contrarian Zones” isn’t a simple touch of the zone. It’s price pushing through, running the stops sitting just beyond it, and then coming back. Following a zone at a low, the sequence plays out in three steps.
1Price approaches and touches the zone
When the close comes within 0.10% of price from the zone’s midline, the Proximity alert condition is met. When the low dips into the zone and the bar closes above the lower edge, Retest goes up by one.
2Price pierces the lower edge (SWEEPING)
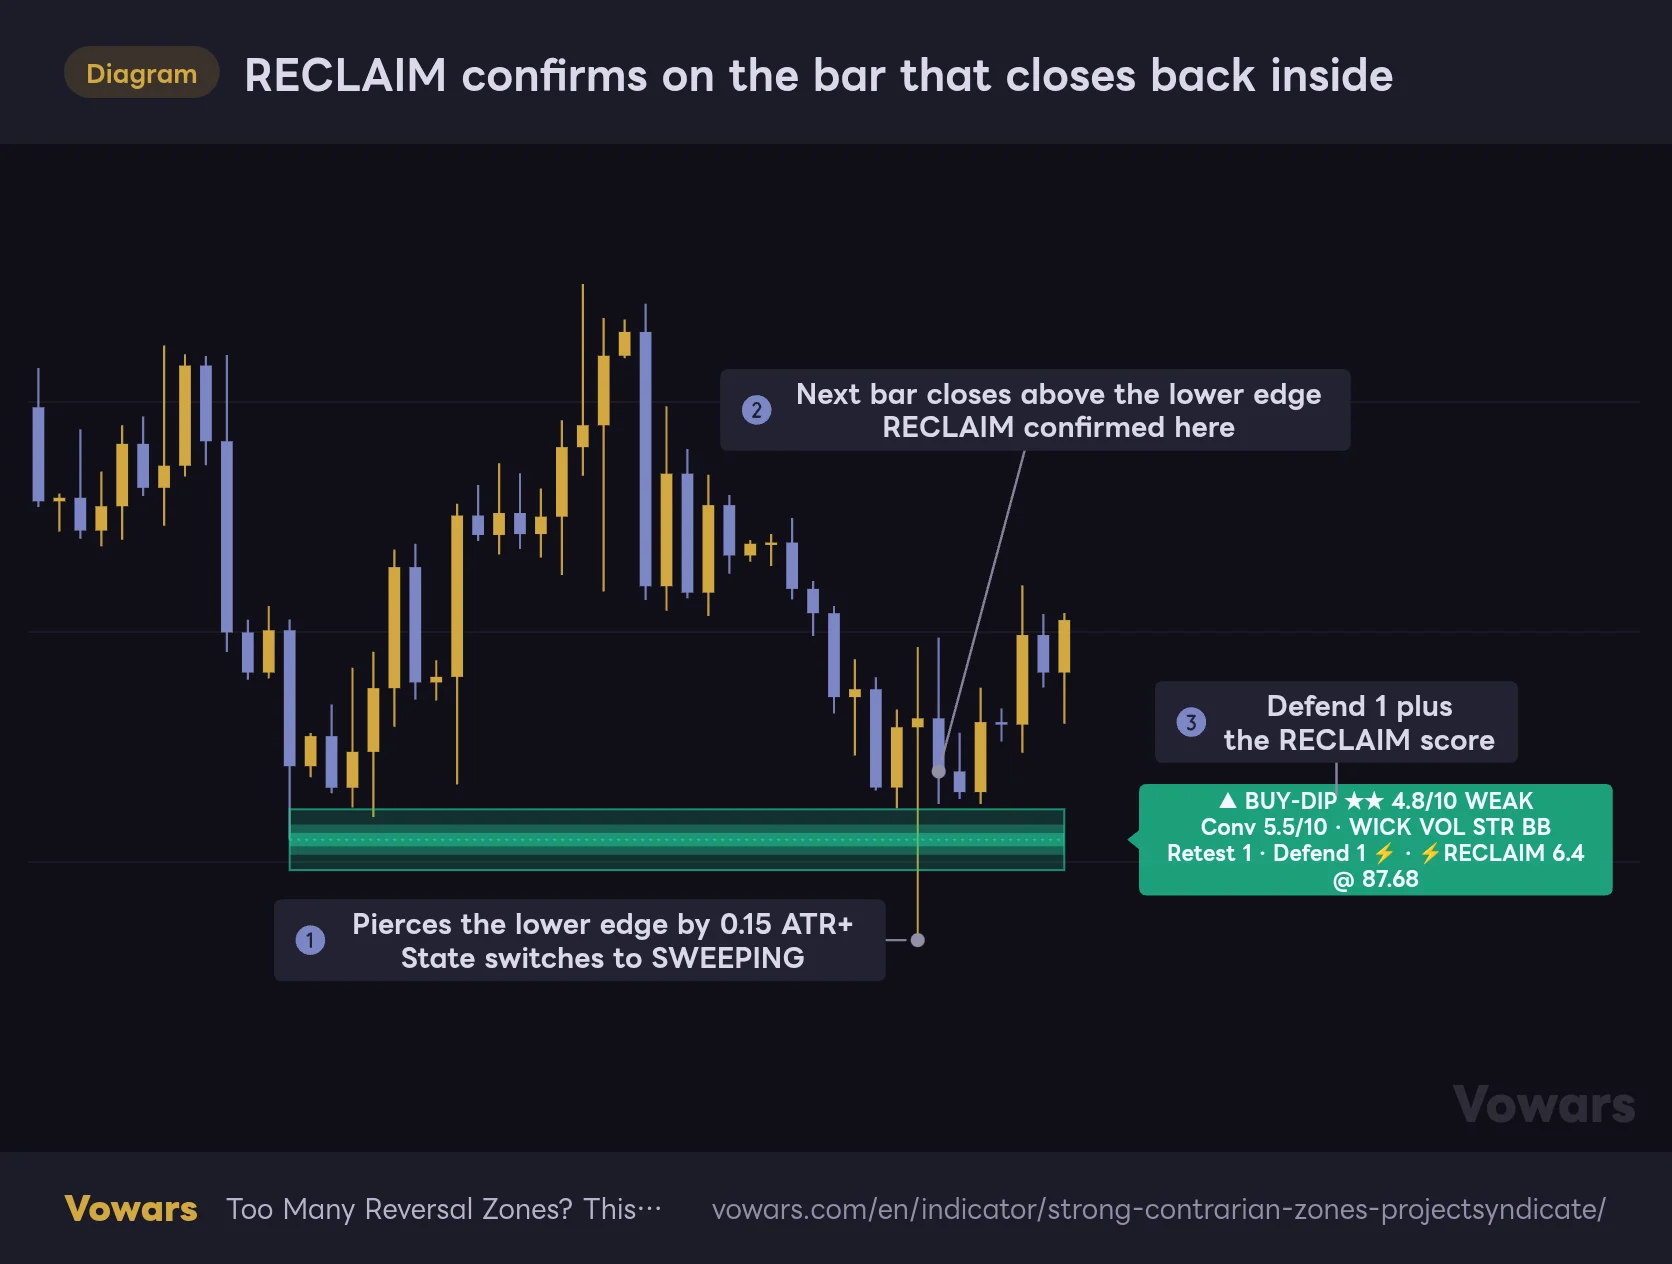
RECLAIM confirms on the bar that closes back inside
RECLAIM doesn't confirm on the bar that wicks through the lower edge. It confirms on the close of the next bar.
Vowars DE ver.3.12.4
When the low trades 0.15 ATR or more below the zone’s lower edge, the state switches to SWEEPING Figure ①. Nothing is confirmed at this point. This is where you wait.
3Close back inside for the RECLAIM
RECLAIM confirms when a bar after the sweep bar closes back above the lower edge Figure ②. This part is easy to miss. The bar that wicks through with a long lower shadow never gets the RECLAIM itself. Checking only starts on the next bar, so even a one-candle wick-and-recover confirms one bar later at the earliest.
On confirmation, Defend goes up by one and line 3 shows a score such as “⚡RECLAIM 6.4” Figure ③. That score is built from the six items below. It’s a different number from the zone score, so don’t mix the two up when reading them side by side.
- How deep price pushed beyond the zone (full credit at 1 ATR)
- How fast it came back (full credit if it reclaims on the bar right after the sweep)
- The lower-wick share of the reclaim bar
- How much volume expanded versus average
- The zone’s Conv (the heaviest weight of the six)
- How far the close pushed back above the lower edge (full credit at 0.6 ATR)
The label only shows the current state. The next time price touches the zone, the RECLAIM tag disappears and there’s no way to tell from the chart when the reversal was confirmed. Turning on Show Reclaim Triggers puts a small triangle on the bar where each RECLAIM confirmed. It’s off by default, so I recommend switching it on if you want to review past reversals.
Zones that fail to reclaim flip to the other side
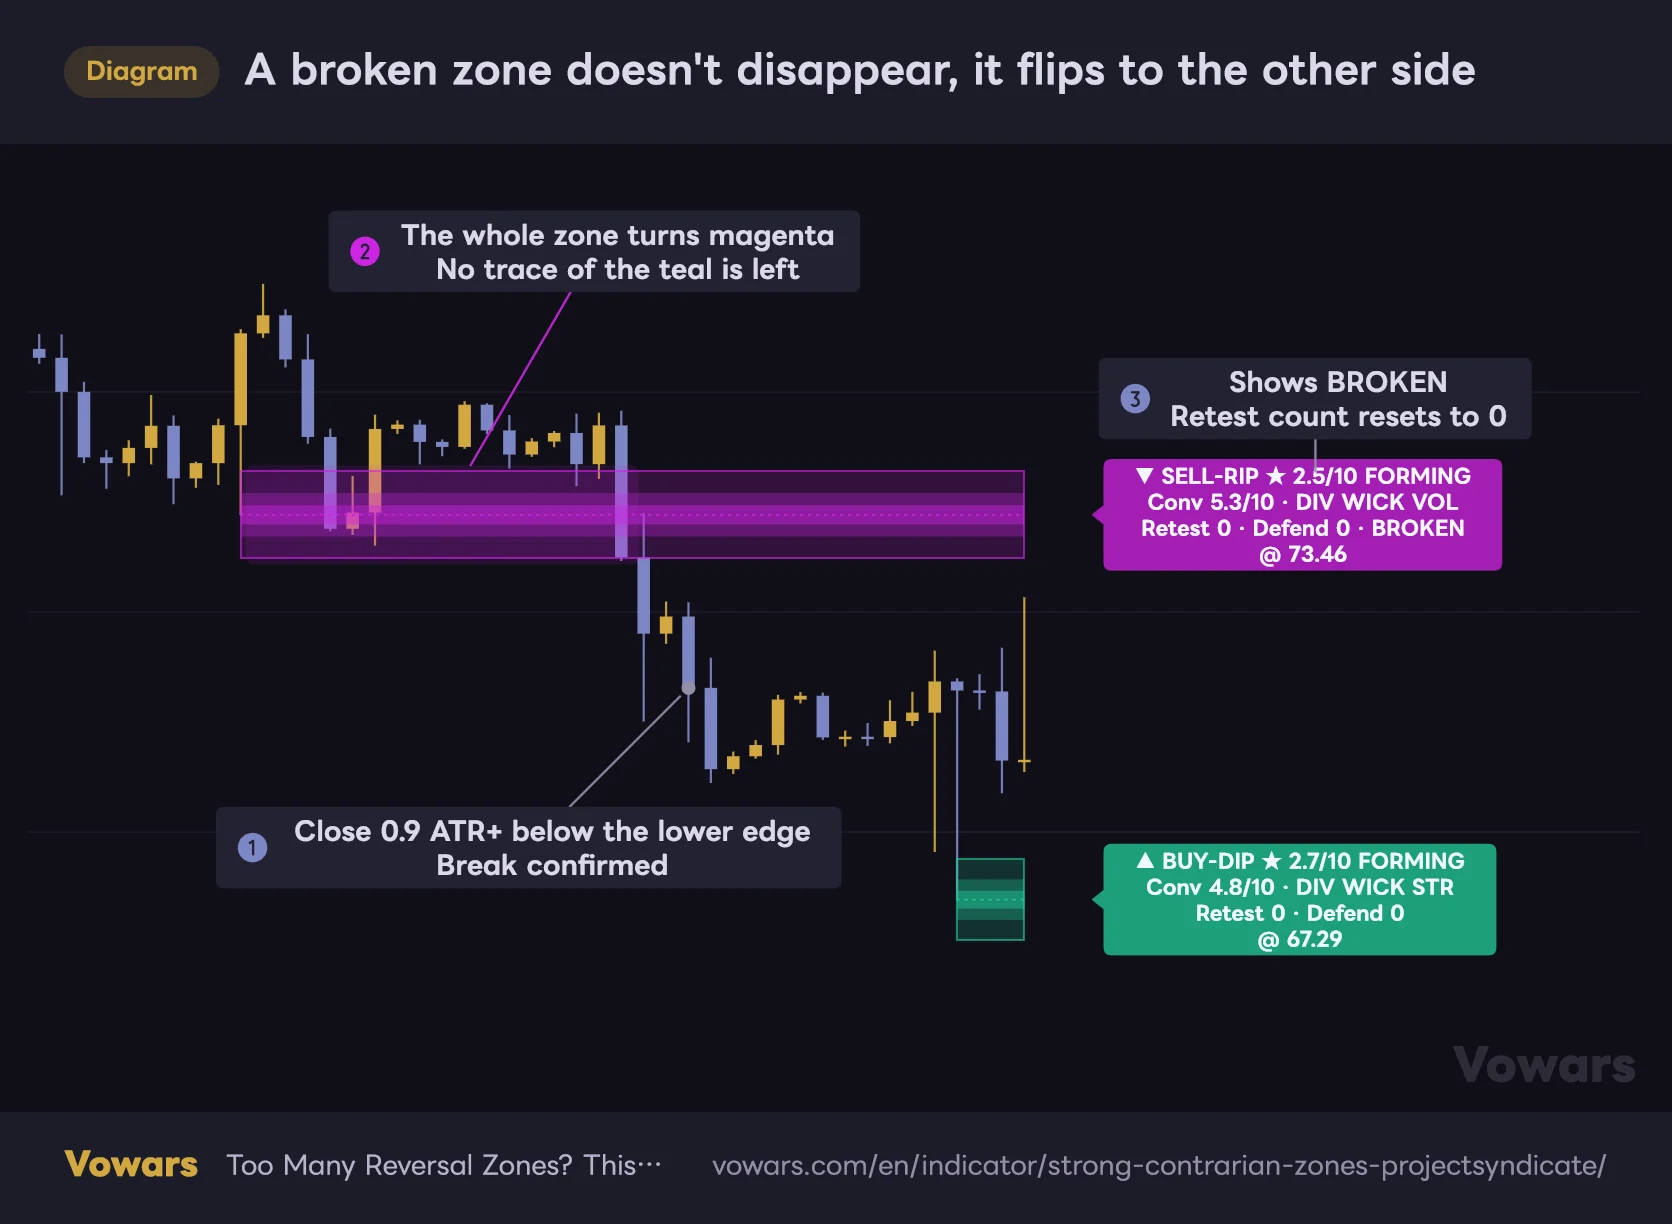
A broken zone doesn't disappear, it flips to the other side
The teal zone that kept holding the lows flips to a magenta SELL-RIP once the break is confirmed.
Vowars DE ver.3.12.4
If price can’t take the zone back after a sweep, it counts as a break. That happens either when a bar closes 0.9 ATR or more below the lower edge Figure ①, or when price is still closing below the lower edge six bars after the sweep.
With Flip Broken Zones (breakers) on (the default), the broken zone doesn’t disappear; it flips to a magenta SELL-RIP. The whole zone is repainted magenta, so no trace of the original teal is left Figure ②. The only clue is “BROKEN” on the label, which is easy to overlook Figure ③.
A flipped zone starts counting Retest and Defend from zero again, and its score drops back into the 2s. Conv and the fingerprint, however, keep the values from when it was born as a teal zone. That’s why you’ll see a magenta zone whose fingerprint lists swing-low reasons like “WICK VOL STR BB.” The BROKEN tag also disappears the next time price touches the zone.
Enter on the reclaim, or fade the first touch?
There are two broad ways to trade these zones: wait for the reclaim, or fade the first touch. Both make sense on paper. Once you line them up against how the scores actually behave, though, they play out very differently.
Trading the reclaim works as-is
Buy when price sweeps below a BUY-DIP zone and reclaims it; sell when price sweeps above a SELL-RIP zone and falls back in. The playbook looks like this.
- Entry on the close of the reclaim bar
- Stop beyond the low (or high) set by the sweep
- Target at the mean, the other side of the range, or the next zone
The big plus is that the stop goes beyond a breakout that has already failed, so there’s no guesswork on placement. The catch is that “Strong Contrarian Zones” doesn’t plot the “mean” you’d use as a target. The 50 SMA covered later in this article fills that gap.
Fading the first touch needs a different read
If you’re going to fade a first touch, the natural move is to look for untested zones graded ELITE or STRONG. But as the breakdown above shows, an untested zone tops out at 5.0 with default settings, short of both ELITE (8.0) and STRONG (6.5). Even after the first touch bumps Retest to 1, the ceiling is only around 5.6.
With default settings, an untested zone will almost never reach ELITE or STRONG. If you want to fade a first touch, check whether line 2 shows a high Conv with DIV or WICK in the fingerprint rather than relying on the line-1 tier. You can change the weights so tiers show up differently, but that dilutes the whole “earn it through the track record” design.
When to sit on your hands is pretty clear
- FORMING or WEAK zones with neither DIV nor WICK in the fingerprint
- Zones still SWEEPING with no close back inside yet (wait for confirmation)
- Price stuck mid-range between zones with nothing nearby
- Zones that have gone untouched for a long time and decayed
I use these myself as my “when in doubt, stay out” rules.
Strong in back-and-forth markets, broken again and again in one-way trends
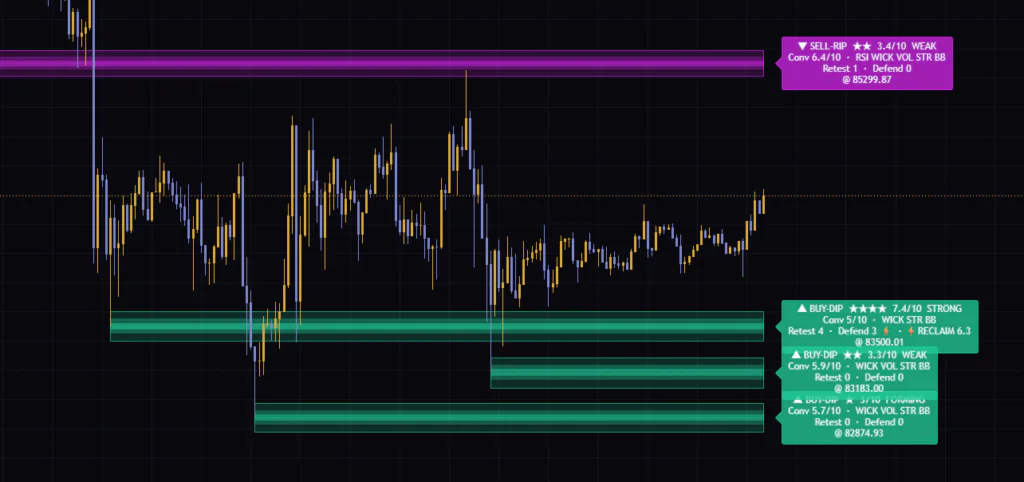
Because “Strong Contrarian Zones” is built on contrarian logic, its fit with market conditions is very clear-cut. In ranges, or when an uptrend keeps printing pullbacks, the “stretch then snap back” behavior repeats. Zones get tested, their scores grow, and reclaims tend to work.
Where it struggles is a market that just keeps going one way.
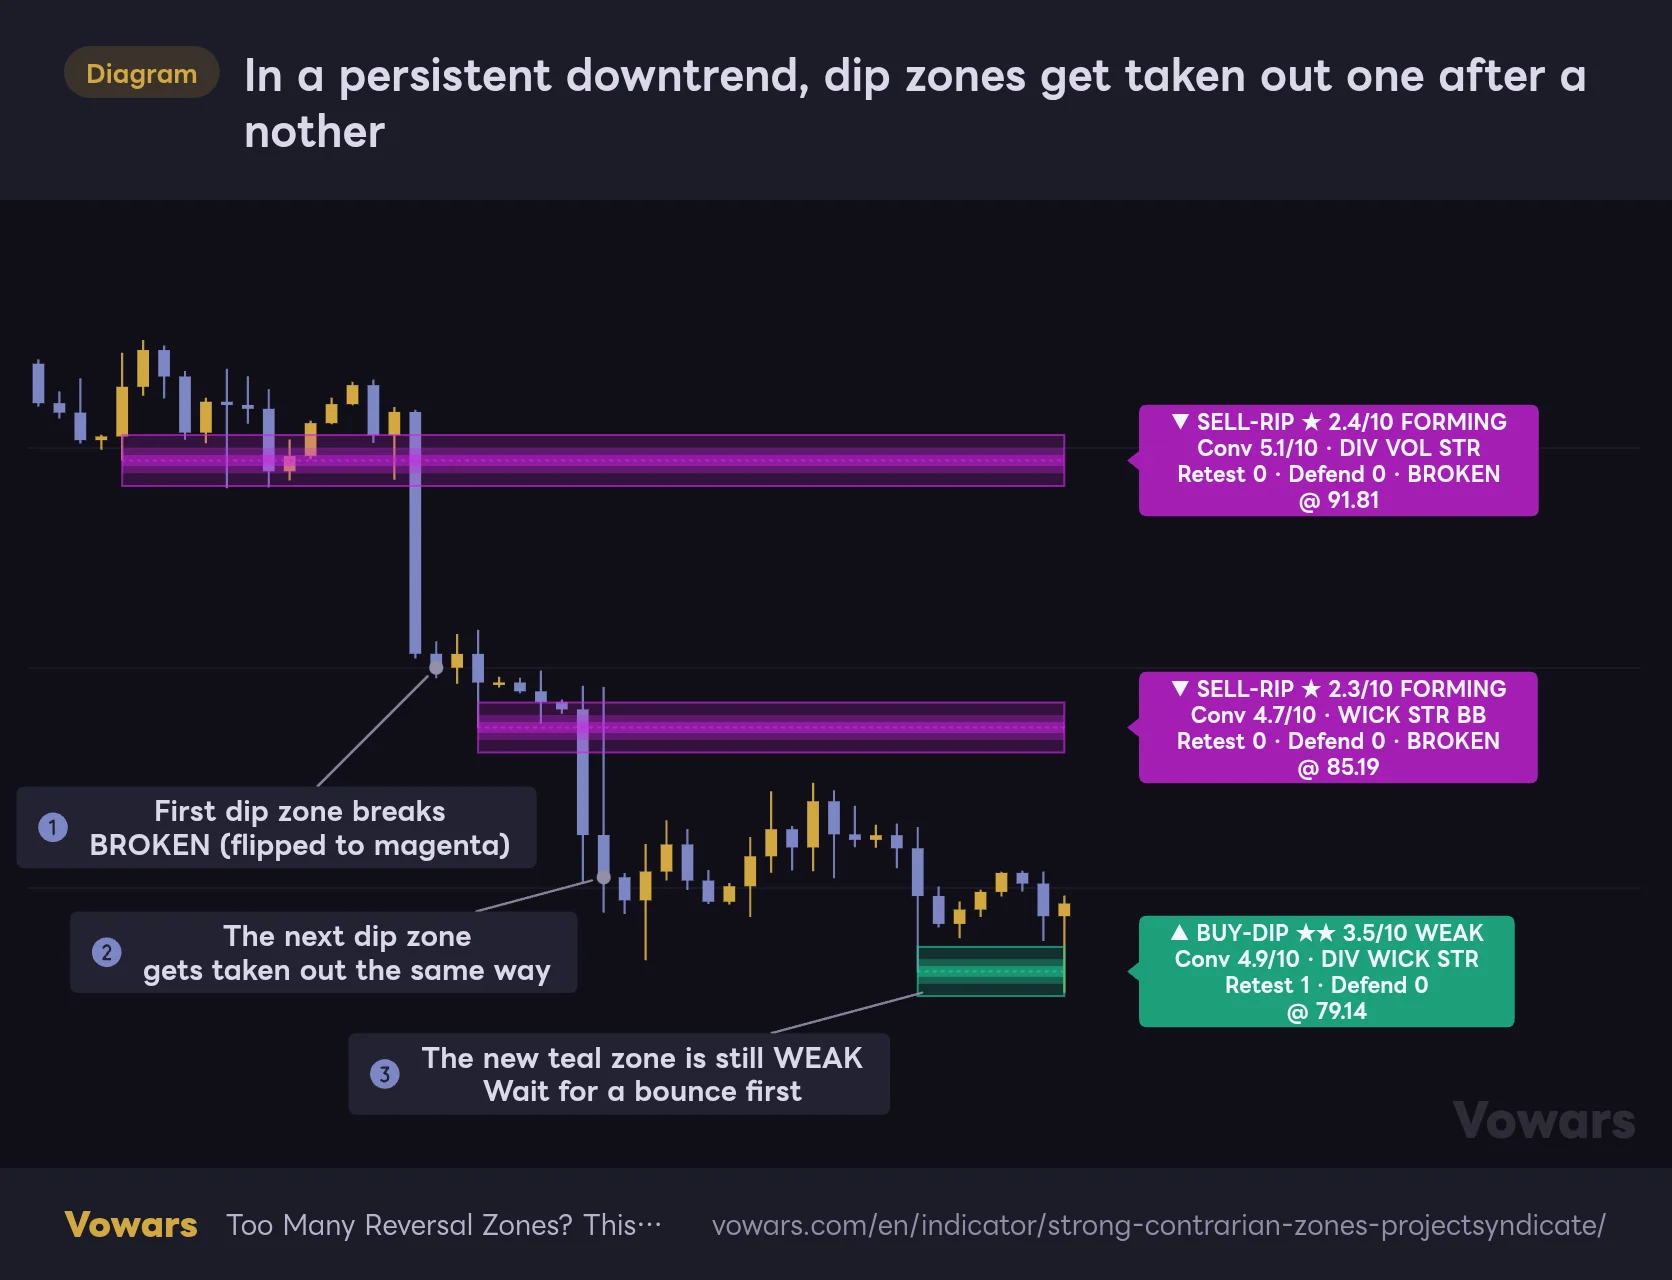
In a persistent downtrend, dip zones get taken out one after another
The top two zones started out as teal BUY-DIP zones. Neither could reclaim after the sweep, so both were confirmed as breaks and flipped to magenta.
Vowars DE ver.3.12.4
In a stair-step selloff, teal zones at the lows get swept one after another and flip to breaks without ever reclaiming Figure ①. The next zone goes the same way Figure ②, and before long there’s a stack of magenta BROKEN zones overhead. The newest zone at the bottom is still only WEAK, so I’d want to see a bounce before acting on it Figure ③.
In conditions like this, using the flipped magenta zones as sell-the-rally levels fits the flow much better. A zone that failed as a reversal now works as a break-and-retest level.
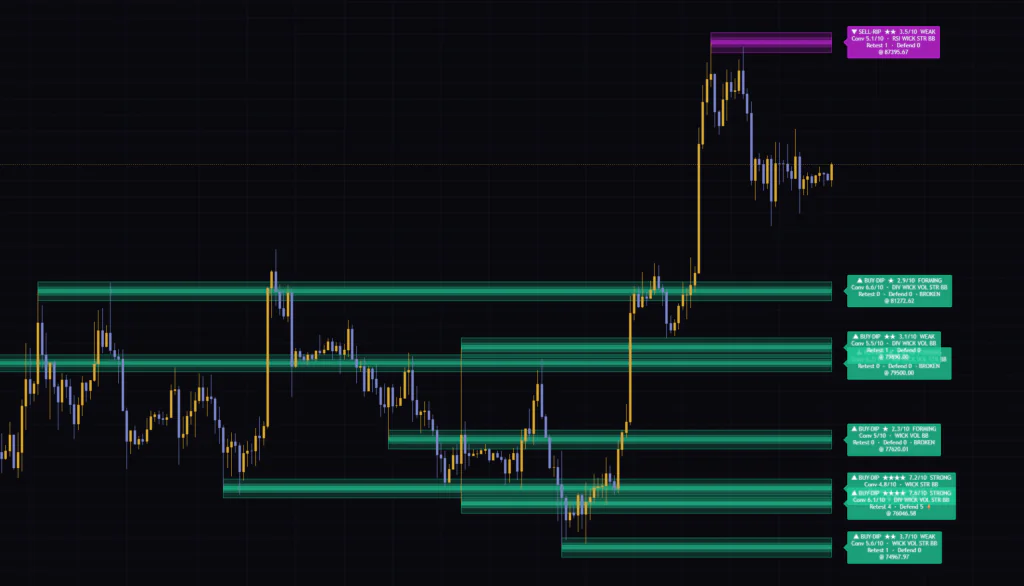
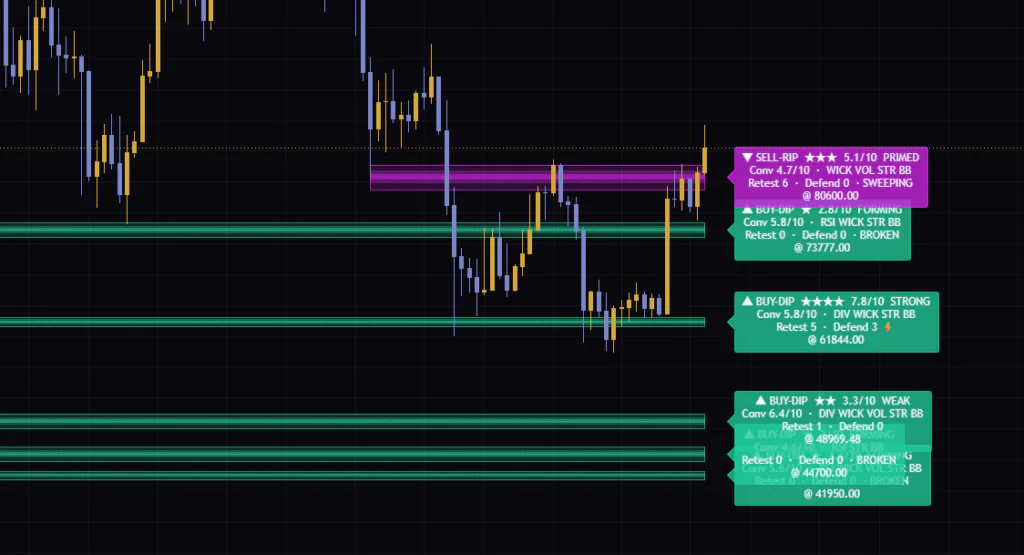
Timeframe-wise, I found it easiest to read somewhere between the 1-hour and the daily. It works on the 5-minute too, but zones and labels pile up and overlap, and the three-bar confirmation lag matters more. On the weekly, STRONG and PRIMED zones remained at major past lows, which makes it handy for checking long-term levels as well.
Where it shines
- Only overextended swings survive, so the number of zones stays manageable
- The fingerprint tells you why each zone exists, so you can check divergence or a long wick instantly
- The sweep and reclaim gives you a clear “confirmed” signal and an obvious place for the stop
- Broken zones flip sides and double as trend-following levels
- Everything is ATR-based, so the defaults hold up well when you switch symbols
Watch out for
- The four-line label is packed with abbreviations and takes time to learn
- New zones score low, so reading line 1 alone makes them easy to underrate
- In a one-way trend, contrarian zones get broken back to back
- Zones appear three bars late but look earlier on historical charts
- On symbols without volume, two of the seven factors never fire
Add the 50 SMA and you can see how far price stretched and where it’s likely to snap back
If I had to pair it with one thing, I’d pick the 50-period simple moving average (SMA). Two reasons.
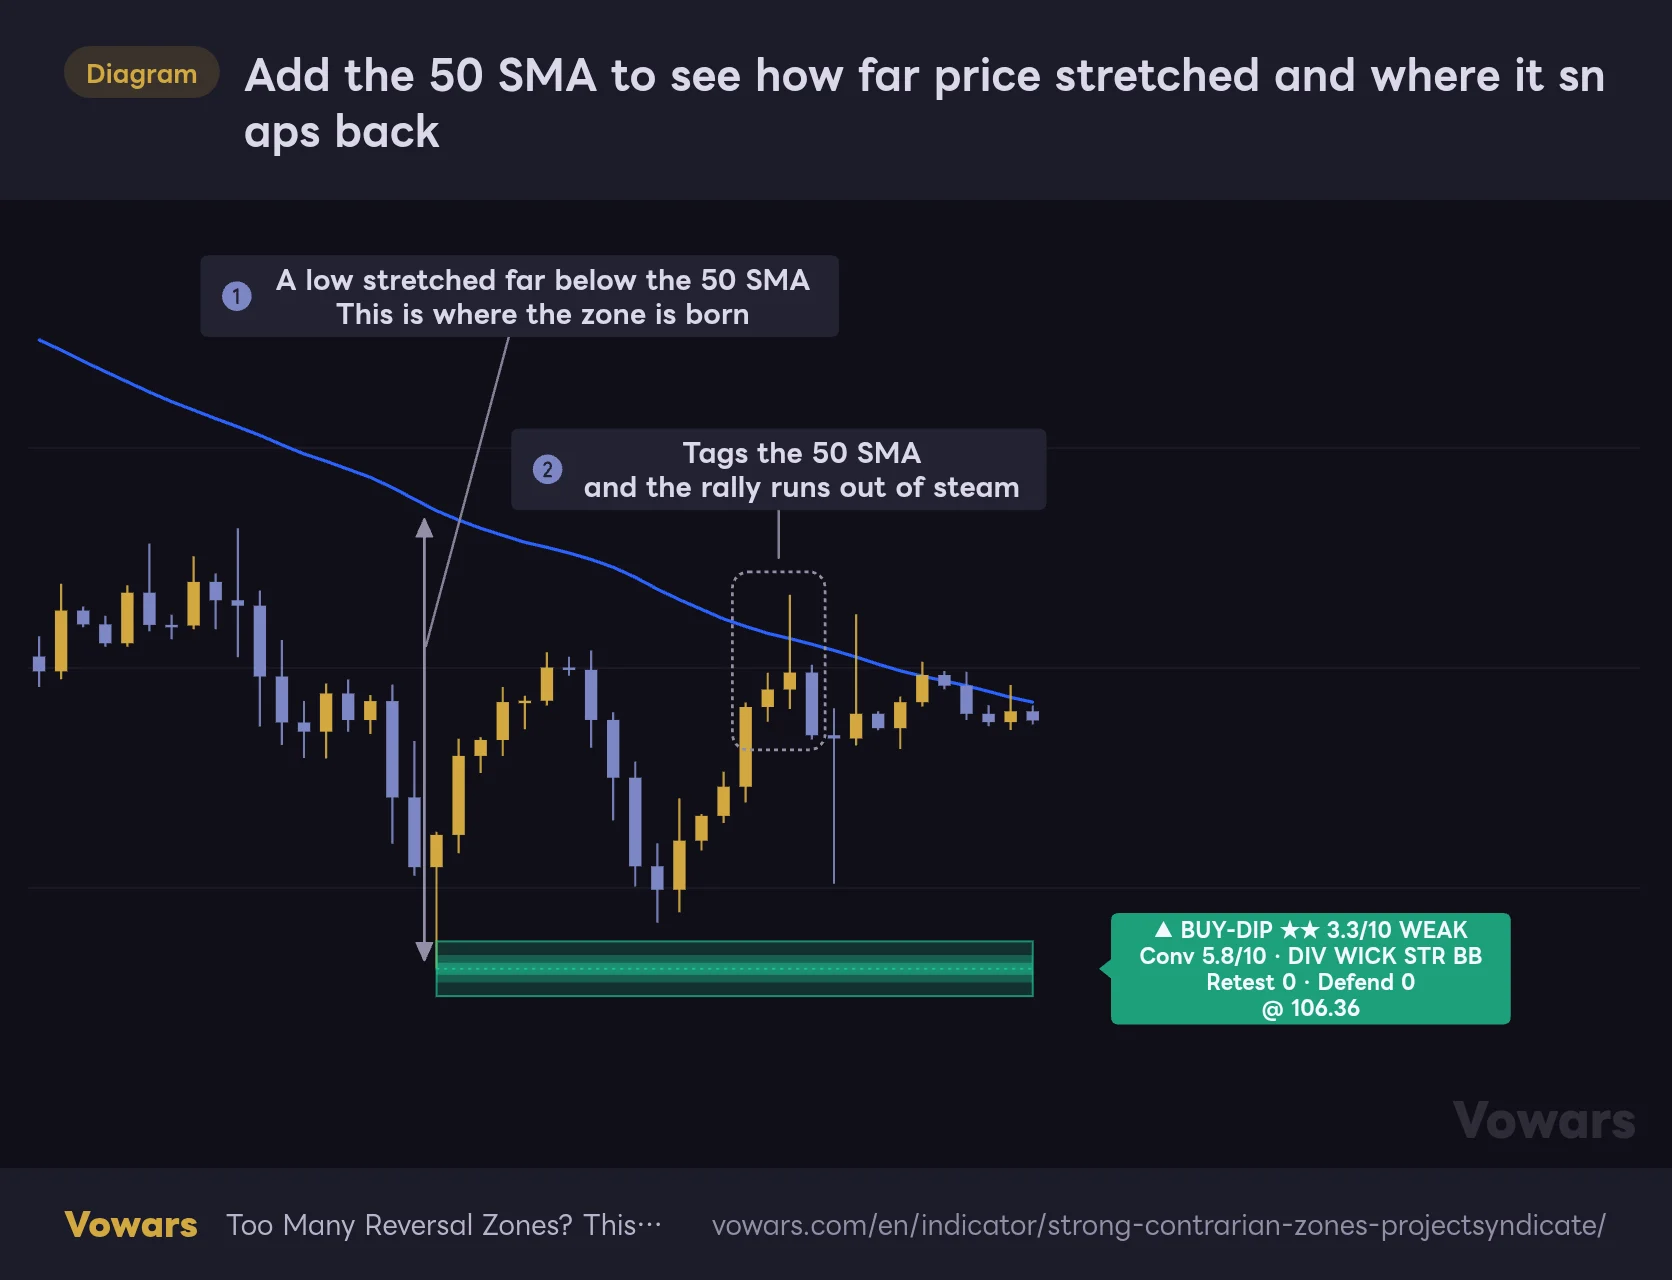
First, the STR factor in “Strong Contrarian Zones” measures exactly how far the close is from its 50-bar mean. With the 50 SMA on the chart, you can see for yourself how stretched price was when a zone with STR in its fingerprint was born. Second, it gives you the “mean” you’d use as a post-reclaim target as an actual line on the chart.
Add the 50 SMA to see how far price stretched and where it snaps back
A simple moving average (50 SMA) is overlaid. The length matches the default Mean-Reversion Length (z-score), the period used to measure distance from the mean.
- SMA 50
- Strong Contrarian Zones
Vowars DE ver.3.12.4
In this figure, the zone forms at a low stretched far below a falling 50 SMA Figure ①. The bounce from there runs out of steam once it tags the 50 SMA Figure ②.
The slope of the 50 SMA also tells you how aggressive to be with the contrarian trade. If the 50 SMA is rising, a teal zone is a pullback in an uptrend, so there’s room to hold for a move beyond the 50 SMA. If it’s falling, bank some profit at the 50 SMA and give the magenta zones more weight. Making that switch keeps you from stacking dip buys in the relentless selloffs described earlier.
Plenty of settings, but only a handful really matter
“Strong Contrarian Zones” has close to 70 settings. You don’t need to learn them all. Below I focus on the ones that affect the display and the ones that meaningfully change the results. For finer items like the scoring weights, I recommend starting with the defaults and only adjusting what bothers you.
Display and swing detection
| Setting | Default | Suggested | Effect |
|---|---|---|---|
| Zone Side | Both | Both | Which zones to show. Bullish Only shows teal only, Bearish Only shows magenta only |
| Show In-Zone Labels | On | On | Shows the labels. Turn off for bands only |
| Label Size | Normal | Small on busy charts | Label text size |
| Lookback (bars, 0 = all loaded) | 2500 | 2500 | How many bars back from the latest bar zones are built |
| Max Live Zones | 30 | 15–30 | Maximum zones kept at once. Oldest ones drop off first |
| Hide Overlapping Zones | On | On | Skips new zones that overlap an existing one |
| Overlap Threshold (%) | 25 | 25 | How much of the thinner zone must overlap to count as a duplicate |
| Pivot Left | 10 | 10 | Bars on the left used to detect a swing |
| Pivot Right | 3 | 3 (5 for more reliability) | Bars on the right needed to confirm a swing. Higher is more reliable but lags more |
| Max Zone Life (bars) | 700 | Adjust to your timeframe | How many bars after birth a zone is removed |
The 700 bars of Max Zone Life (bars) is about 58 hours on a 5-minute chart and over 10 years on the weekly. On lower timeframes zones vanish after two and a half days, so raise it if you want to keep last week’s levels around. Setting Pivot Right to 5 delays confirmation by two bars, but cuts down on cases where price makes a new low right after the swing confirms.
Zone height
| Setting | Default | Suggested | Effect |
|---|---|---|---|
| Normalize All Zone Heights | On | On | Gives every zone the same height, centered on the swing price |
| Height Method | ATR Based | ATR Based | Basis for height. Fixed Percentage uses a percent of price |
| Zone Height (ATR Mult) | 0.6 | 0.6 | Height as a multiple of ATR |
| Zone Height (% of Price) | 0.30 | — | Height when using Fixed Percentage |
| ATR Length | 200 | 200 | ATR period used for height and sweep detection |
With Normalize All Zone Heights off, zones at lows extend upward from the low and zones at highs extend downward from the high. The ATR is used not just for height but also for the sweep and break thresholds, so shortening ATR Length makes zones thinner and sweep detection more sensitive.
What it takes to form a zone (Contrarian Conviction)
| Setting | Default | Suggested | Effect |
|---|---|---|---|
| Min Conviction To Draw Zone | 4.5 | 4.5 (5.5 to be pickier) | Only swings at or above this score become zones |
| RSI Length | 14 | 14 | RSI period |
| Oversold Reference (RSI ≤) | 42 | 42 | Reference for the RSI factor at swing lows |
| Overbought Reference (RSI ≥) | 58 | 58 | Reference for the RSI factor at swing highs |
| Mean-Reversion Length (z-score) | 50 | 50 | Period used to measure distance from the mean |
| Stretch Reference (z σ) | 2.2 | 2.2 | How many σ away earns full credit |
| Bollinger Length | 20 | 20 | Bollinger Band period |
| Bollinger StdDev | 2.0 | 2.0 | Bollinger Band width |
| Band-Pierce Reference (ATR) | 0.5 | 0.5 | How many ATR beyond the band earns full credit |
| Volume Baseline Length | 20 | 20 | Period for the volume average |
| Volume Climax Reference (x) | 2.2 | 2.2 | Volume multiple of the average that earns full credit |
| Rejection Wick Reference | 0.45 | 0.45 | Wick share of the bar’s range that earns full credit |
| Order-Flow Pressure Lookback | 20 | 20 | Period for measuring buying pressure |
| Pressure Reference (% past 50) | 18.0 | 18.0 | How many points away from 50% earns full credit |
| Divergence Reference (RSI pts) | 8.0 | 8.0 | RSI improvement vs the prior swing low (high) that earns full credit |
Min Conviction To Draw Zone has the biggest impact on how many zones you see. If you’re getting too many candidates on something like a 5-minute chart, raising it in 0.5 steps is the easiest way to dial it in. On lower timeframes I run it around 5.5 so that zones with DIV or WICK make up most of what’s left. Keep in mind the ceiling drops to about 7.3 on symbols without volume, so push it too high and hardly any zones will print.
Factor weights (Conviction Weights)
| Setting | Default | Suggested | Effect |
|---|---|---|---|
| Weight · RSI Extreme | 1.0 | 1.0 | Weight of the RSI factor |
| Weight · Momentum Divergence | 1.3 | 1.3–1.6 | Weight of the divergence factor |
| Weight · Rejection Wick | 1.0 | 1.0 | Weight of the wick factor |
| Weight · Volume Climax | 1.0 | 0 on symbols without volume | Weight of the volume factor |
| Weight · Mean-Reversion Stretch | 1.0 | 1.0 | Weight of the stretch factor |
| Weight · Order-Flow Pressure | 0.9 | 0 on symbols without volume | Weight of the buying-pressure factor |
| Weight · Bollinger Pierce | 0.9 | 0.9 | Weight of the band-pierce factor |
On symbols without volume, setting Weight · Volume Climax and Weight · Order-Flow Pressure to 0 means the average is taken over the remaining five factors only. That lets Conv reach 10 again. If you want divergence to count for more, raise Weight · Momentum Divergence.
Sweep and reclaim detection
| Setting | Default | Suggested | Effect |
|---|---|---|---|
| Fire Reclaim Alerts | On | On | Enables the reclaim alert conditions. Turning it off also hides the RECLAIM triangles |
| Min Sweep Depth (ATR) | 0.15 | 0.15 | How many ATR beyond the lower (upper) edge counts as a sweep |
| Max Reclaim Window (bars) | 6 | 6 | How many bars after the sweep a reclaim is allowed |
| Reclaim Confirmation | Border | Border (Midline to be stricter) | How far back the close must get to confirm. Midline is the center line, Far Border is the opposite edge |
| Decisive Break Acceptance (ATR) | 0.9 | 0.9 | How many ATR beyond the edge on a close triggers an immediate break |
| Flip Broken Zones (breakers) | On | On | Keeps broken zones and flips them to the other side. Off deletes them |
| Only Alert Strong Reclaims | Off | On once you’re comfortable | Only alerts when the reclaim score clears the threshold |
| Strong Reclaim Threshold | 6.5 | 6.5 | Reclaim score threshold used by the setting above |
| Show Reclaim Triggers | Off | On | Plots a triangle on the bar where a reclaim confirms |
Setting Reclaim Confirmation to Midline or Far Border means the close has to get deeper back into the zone to confirm. In that case a zone can stay in SWEEPING even after six bars if price hasn’t reclaimed enough but also isn’t closing below the lower edge. With Only Alert Strong Reclaims on, reclaims below the threshold won’t get a triangle either.
There are also nine settings that change how the reclaim score is built (Grab Depth Ref (ATR), Weight · Zone Conviction and so on). The defaults worked fine for me, so I haven’t touched them.
Zone strength (Live Zone Strength)
| Setting | Default | Suggested | Effect |
|---|---|---|---|
| Show Only Strong Zones | Off | Off | Hides zones below the threshold |
| Strong Threshold (score) | 5.0 | 5.0 | Score threshold used by the setting above |
| Retests For Full Score | 4.0 | 4.0 | Retests needed for full credit |
| Defended Reclaims For Full Score | 2.0 | 2.0 | Defended reclaims needed for full credit |
| Weight: Birth Conviction | 0.35 | 0.35 | Weight of Conv |
| Weight: Retests | 0.25 | 0.25 | Weight of retests |
| Weight: Sweep Defense | 0.25 | 0.25 | Weight of defended reclaims |
| Weight: Rejection Wick | 0.075 | 0.075 | Weight of wicks |
| Weight: Volume | 0.075 | 0.075 | Weight of volume |
| Decay Strength While Ignored | On | On | Lowers the score of zones that go untouched |
| Full Decay Over (idle bars) | 300 | 300 | Bars it takes to decay down to the floor |
| Decay Floor | 0.65 | 0.65 | Lowest multiple the score can decay to |
Untested zones top out at 5.0, so with Show Only Strong Zones on, almost every new zone gets hidden. What’s left are zones whose scores grew through retests or reclaims, plus zones that are currently SWEEPING or just reclaimed. Hidden zones still exist under the hood and still count toward the overlap check and Max Live Zones. What you see on screen is not the full picture.
Appearance and alerts
| Setting | Default | Suggested | Effect |
|---|---|---|---|
| Bullish Zone Tone | #21c997 | Your choice | Color of BUY-DIP zones |
| Bearish Zone Tone | #cc24e2 | Your choice | Color of SELL-RIP zones |
| Gradient (double-shaded) Fill | On | On | Fills with three shaded layers |
| Zone Transparency | 84 | 84 | Band transparency |
| Show Zone Borders | On | On | Band border |
| Border Transparency | 35 | 35 | Border transparency |
| Show Zone Midline | On | On | Dotted center line |
| Label Placement | Outside · Right | Outside · Right | Label position |
| Label Gap From Zone (bars) | 3 | 3 | Bars between the zone’s right edge and the label |
| Label Background Transparency | 22 | 22 | Label background transparency |
| Label Text Colour | #F2F7FF | #F2F7FF | Label text color |
| Proximity (% of price) | 0.10 | 0.10 | Proximity alert condition is met when the close is within this range of the midline |
| Strong / Institutional Score | 7.0 | 7.0 | Zone score used for the Strong proximity alerts |
If your candle colors are close to the zone colors, candles inside the bands get hard to read. My down candles are purple-ish, and I found changing the candle color worked better than making the zones more transparent.
Ten alert conditions, so you don’t have to stare at the chart
Since nothing but zones and labels goes on the chart, the alerts do a lot of the heavy lifting. Here are the ten alert conditions available.
| Alert name | Fires when |
|---|---|
| Bullish Zone Proximity / Bearish Zone Proximity | The close gets near the midline of a teal / magenta zone |
| Strong Bullish Zone Proximity / Strong Bearish Zone Proximity | Same as above, for zones scoring 7.0 or higher |
| Zone Touch / Retest | A retest is counted on any zone |
| Zone Sweep (liquidity grab) | Any zone gets swept |
| Zone Break (accepted) | Any zone is confirmed as broken |
| Bullish Reclaim / Bearish Reclaim | A reclaim confirms on a teal / magenta zone |
| Any Reclaim | Either kind of reclaim confirms |
To set one up, open TradingView’s Create Alert dialog, choose “Strong Contrarian Zones” as the condition, then pick the one you want from the list above.
Reclaims and sweeps can change until the bar closes. Setting the alert frequency to “Once Per Bar Close” keeps you from getting whipsawed by conditions that were only true for a moment mid-bar. Also, as TradingView’s help center notes, if you change the indicator’s settings after creating an alert, the alert keeps running on the old settings. Recreate your alerts whenever you change settings.
The Strong proximity alerts require a zone score of 7.0 or more, so they won’t fire on fresh zones. Think of them as alerts that only ping you for zones that have earned their score through retests and reclaims.
Repainting and when things appear
I saw no sign of “Strong Contrarian Zones” using future data to draw zones. A swing confirms once three bars have closed to its right, and the price of a confirmed zone never moves afterwards. That said, there are three behaviors worth knowing about.
- Back-anchored left edge. Zones confirm three bars late, but they’re drawn starting from the swing bar. On a historical chart, it looks like the zone existed three bars earlier than it really did.
- Real-time bar evaluation. Sweeps, reclaims and retests can change before the bar closes. Once the bar is closed, they don’t move.
- Scores and zones get reshuffled. Scores move up and down with retests and time, and once Max Live Zones is exceeded the oldest zones drop off. Lookback (bars, 0 = all loaded) is also counted from the latest bar, so if you reload the chart a few days later, some older zones may be gone.
The three-bar confirmation delay, the fact that a real-time reclaim can change until the close, and the reshuffling of scores and shading are all stated as intended behavior on the script’s public page.
Since the label only shows the current state, scrolling back won’t tell you where a zone went SWEEPING or where a RECLAIM confirmed. TradingView’s Bar Replay lets you step forward one bar at a time and watch the label change. As of 2026/9/27, though, Bar Replay on the free plan is limited to daily and higher, and intraday replay requires a paid plan. How far back you can go also depends on your plan and timeframe.
Also, “Strong Contrarian Zones” is built as an indicator, so it has no way to tally results in the Strategy Tester. Verification mostly comes down to eyeballing it in Bar Replay.
A contrarian map for traders willing to wait for zones to earn their score
 Image
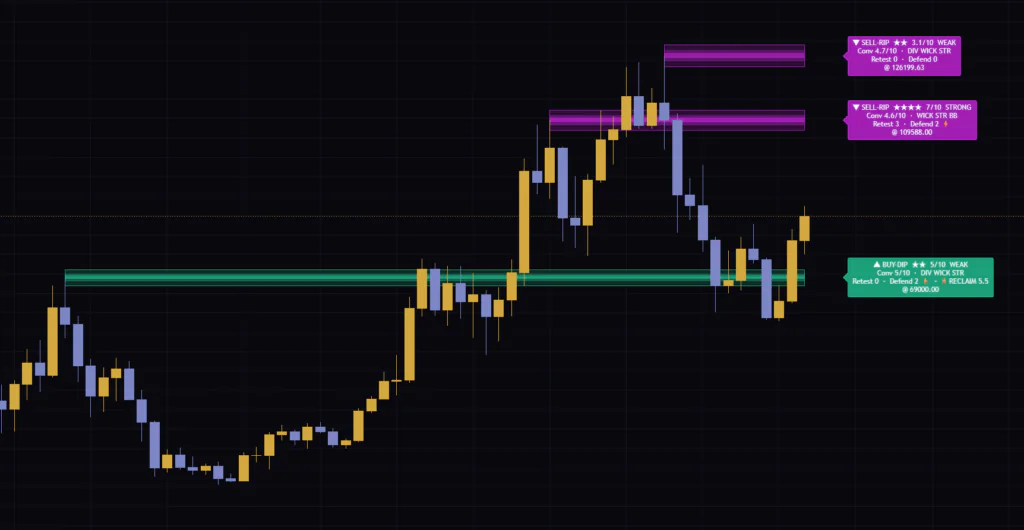
ImageAfter spending real time with “Strong Contrarian Zones”, I don’t see these as zones you jump on the moment they’re drawn. They’re zones you follow as they get tested, hold, and build up their score. Newborn zones score low and look understated. Pick the ones with a high Conv and DIV or WICK in the fingerprint, then wait for the sweep and reclaim to confirm. Get into that rhythm and the hardest part of fading moves, deciding where and when to get in, becomes a lot easier.
On the downside, reading the labels takes practice, and in one-way markets teal zones get taken out one after another. Pair it with a trend gauge like the 50 SMA, and switch broken zones over to sell-the-rally or buy-the-dip levels. With that in place, it becomes a solid decision aid for anything from day trading to swing trading ranges and trend pullbacks.
Start with the defaults, turn on just Show Reclaim Triggers, and look at where past RECLAIMs landed on a 1-hour or 4-hour chart. Once the scores start making sense, you’ll see the zones differently.