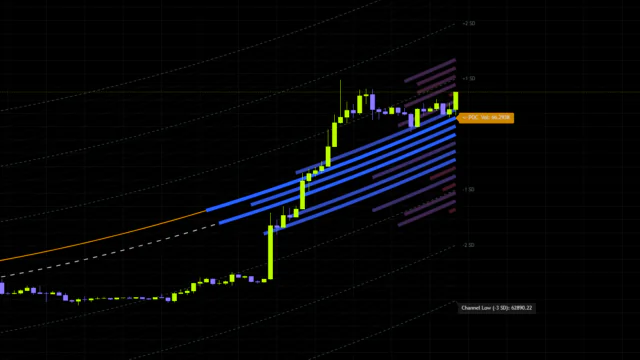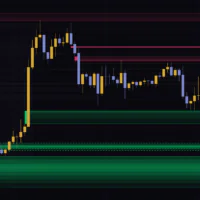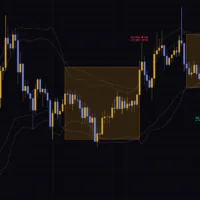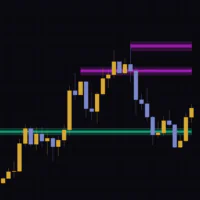


“Z-Score Range Boxes Breakout” boxes up the consolidation that follows an overextended move
“Z-Score Range Boxes Breakout”, published by BigBeluga, uses the moment price stretches far from its average as a trigger, records the range that forms right after as a box, and leaves that box’s top and bottom on the chart as breakout levels. The oscillator spots the overextension, and the price chart shows where price has to break for the next move to start. Two jobs, one indicator. It’s a genuinely practical idea.
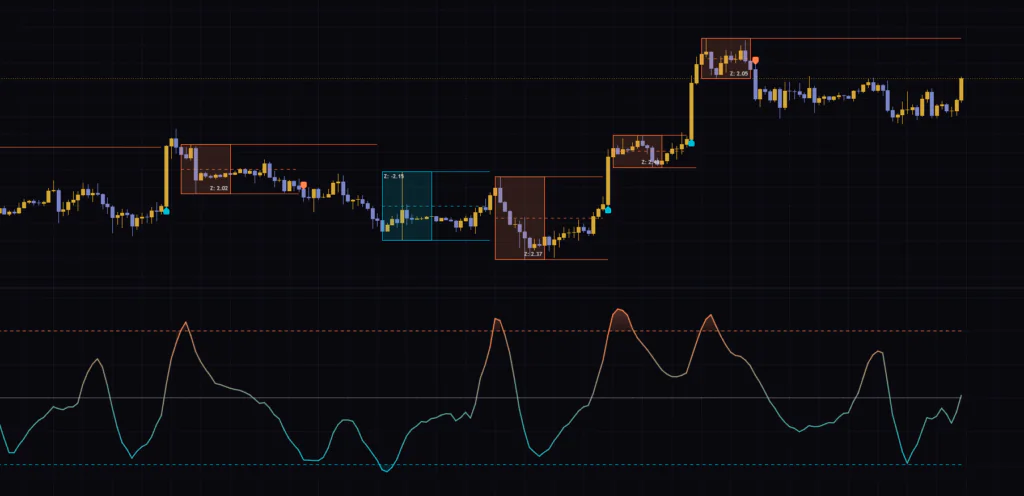
What first caught my eye was that it automatically draws the “this is where the real move starts” levels right after a pump or a dump. Price usually chops around for a while after a sharp move, and redrawing that range by hand every time is more tedious than it sounds. “Z-Score Range Boxes Breakout” does it for you, mechanically.
The more I used it, though, the clearer it became that a few small rules drive every decision: how many bars define a box, when each line stops, and what the marker colors actually mean. In this review I walk through the behavior I verified on Bitcoin charts, step by step, with diagrams.
The big picture first
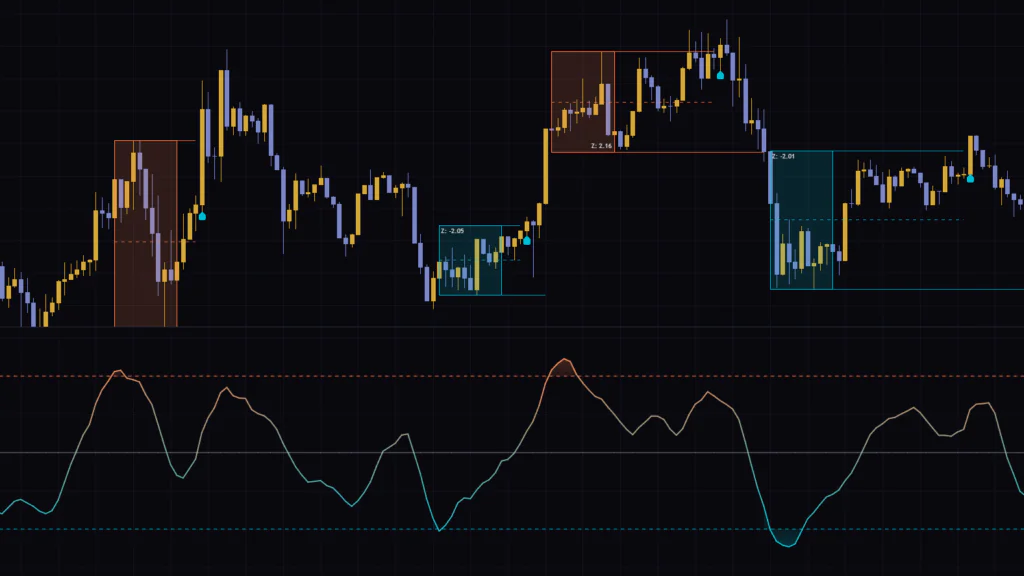
In a nutshell: the Z-Score in the lower pane pushes outside ±2 → a box starts on the price chart on that same bar → once the box locks in, three lines extend to the right → when a candle closes beyond a line, a marker prints. Follow the whole sequence in the figure.
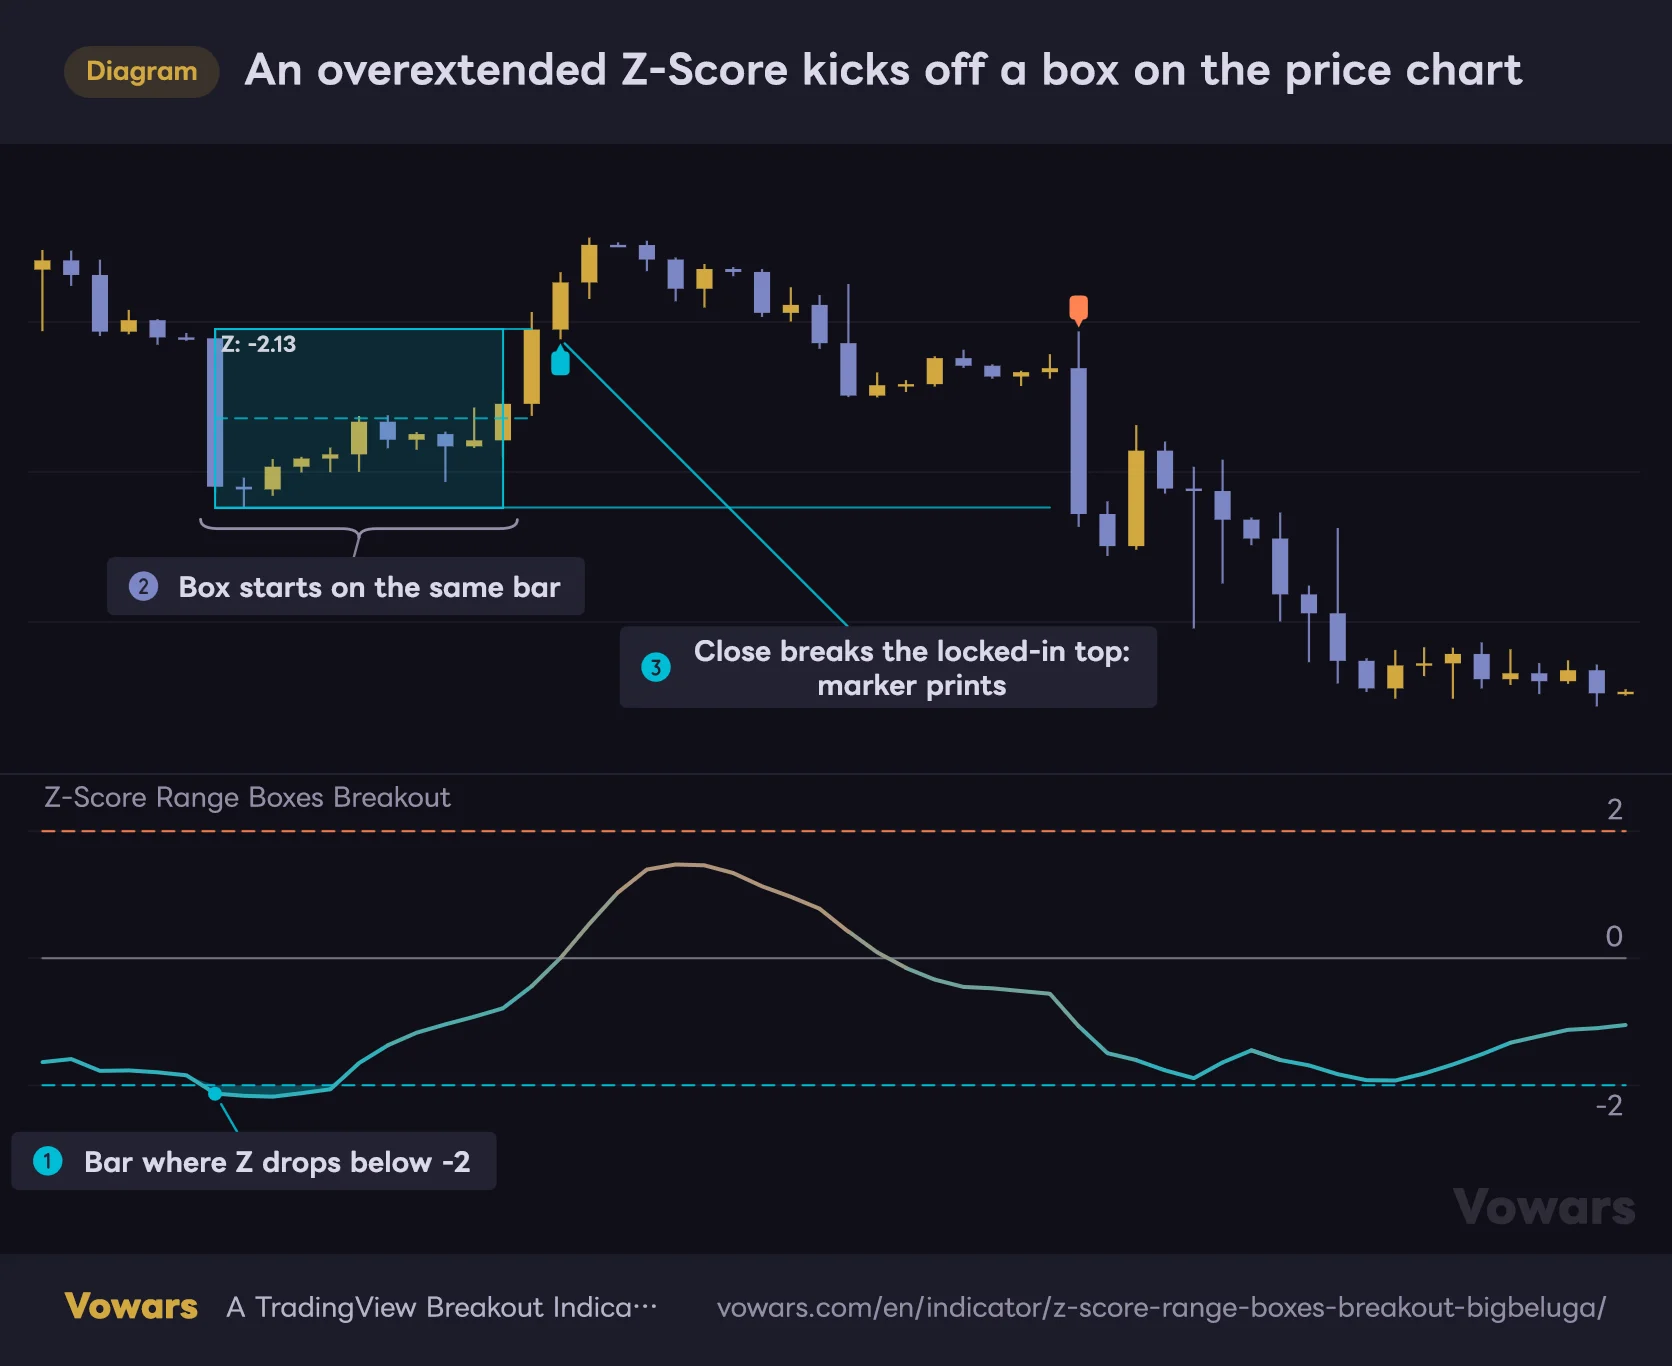
An overextended Z-Score kicks off a box on the price chart
Box building starts on the price chart on the same bar where the Z-Score in the lower pane drops below -2.
Vowars DE ver.3.12.11
The key detail is that the bar where the Z-Score drops below -2 Figure ① and the bar where the box starts Figure ② are the same bar. The oscillator and the price chart line up vertically, so if you ever wonder why a box is sitting somewhere, one glance at the lower pane answers it.
| Where it shows up | Element | How to read it |
|---|---|---|
| Lower pane | Gradient line (Z-Score) | The closer to aqua, the further below the average; the closer to orange, the further above it |
| Lower pane | ±2 dashed lines and fill | Color fills only the part of the line that pushes past the dashed levels |
| Price chart | Box and “Z: value” label | The range over a fixed number of bars starting at the overextended bar. The value is the Z-Score on the trigger bar |
| Price chart | Top, mid and bottom lines | Breakout levels that extend to the right once the box locks in |
| Price chart | Small markers | Aqua = upside breakout, orange = downside breakout |
The lower pane is basically “where price sits inside the Bollinger Bands,” flattened out
The math itself is simple. A Z-Score measures how far the close is from its recent average, expressed in standard deviations (a measure of how spread out price has been). By default, “Z-Score Range Boxes Breakout” uses a 20-bar simple moving average and standard deviation, then smooths the result with a 5-bar moving average.
That’s essentially the same yardstick as 20-period, 2-standard-deviation Bollinger Bands. A Z-Score of +2 means the close is sitting on the upper band, and -2 means it’s on the lower band. In other words, the lower pane is best thought of as price’s position inside the Bollinger Bands, redrawn on a flat horizontal scale.
Boxes are triggered by the 5-bar smoothed Z-Score. This is easy to miss. A single close poking outside the +2σ band won’t push the smoothed value past 2 very easily. The condition only fires once price has hugged the outside of the band for several bars, so the indicator is built to ignore one-off spikes.
The Z-Score line uses a gradient that goes from aqua at -3 to orange at +3. Beyond ±3 the color stops changing, so if you’re reading “how stretched is it?” from the color, ±3 is the useful limit. The fill that appears past the dashed levels gets darker the further the line moves away from them.
How a box forms and turns into three lines
The box is the heart of “Z-Score Range Boxes Breakout.” It looks simple, but it’s built in a very specific order. Walk through it step by step in the figure.
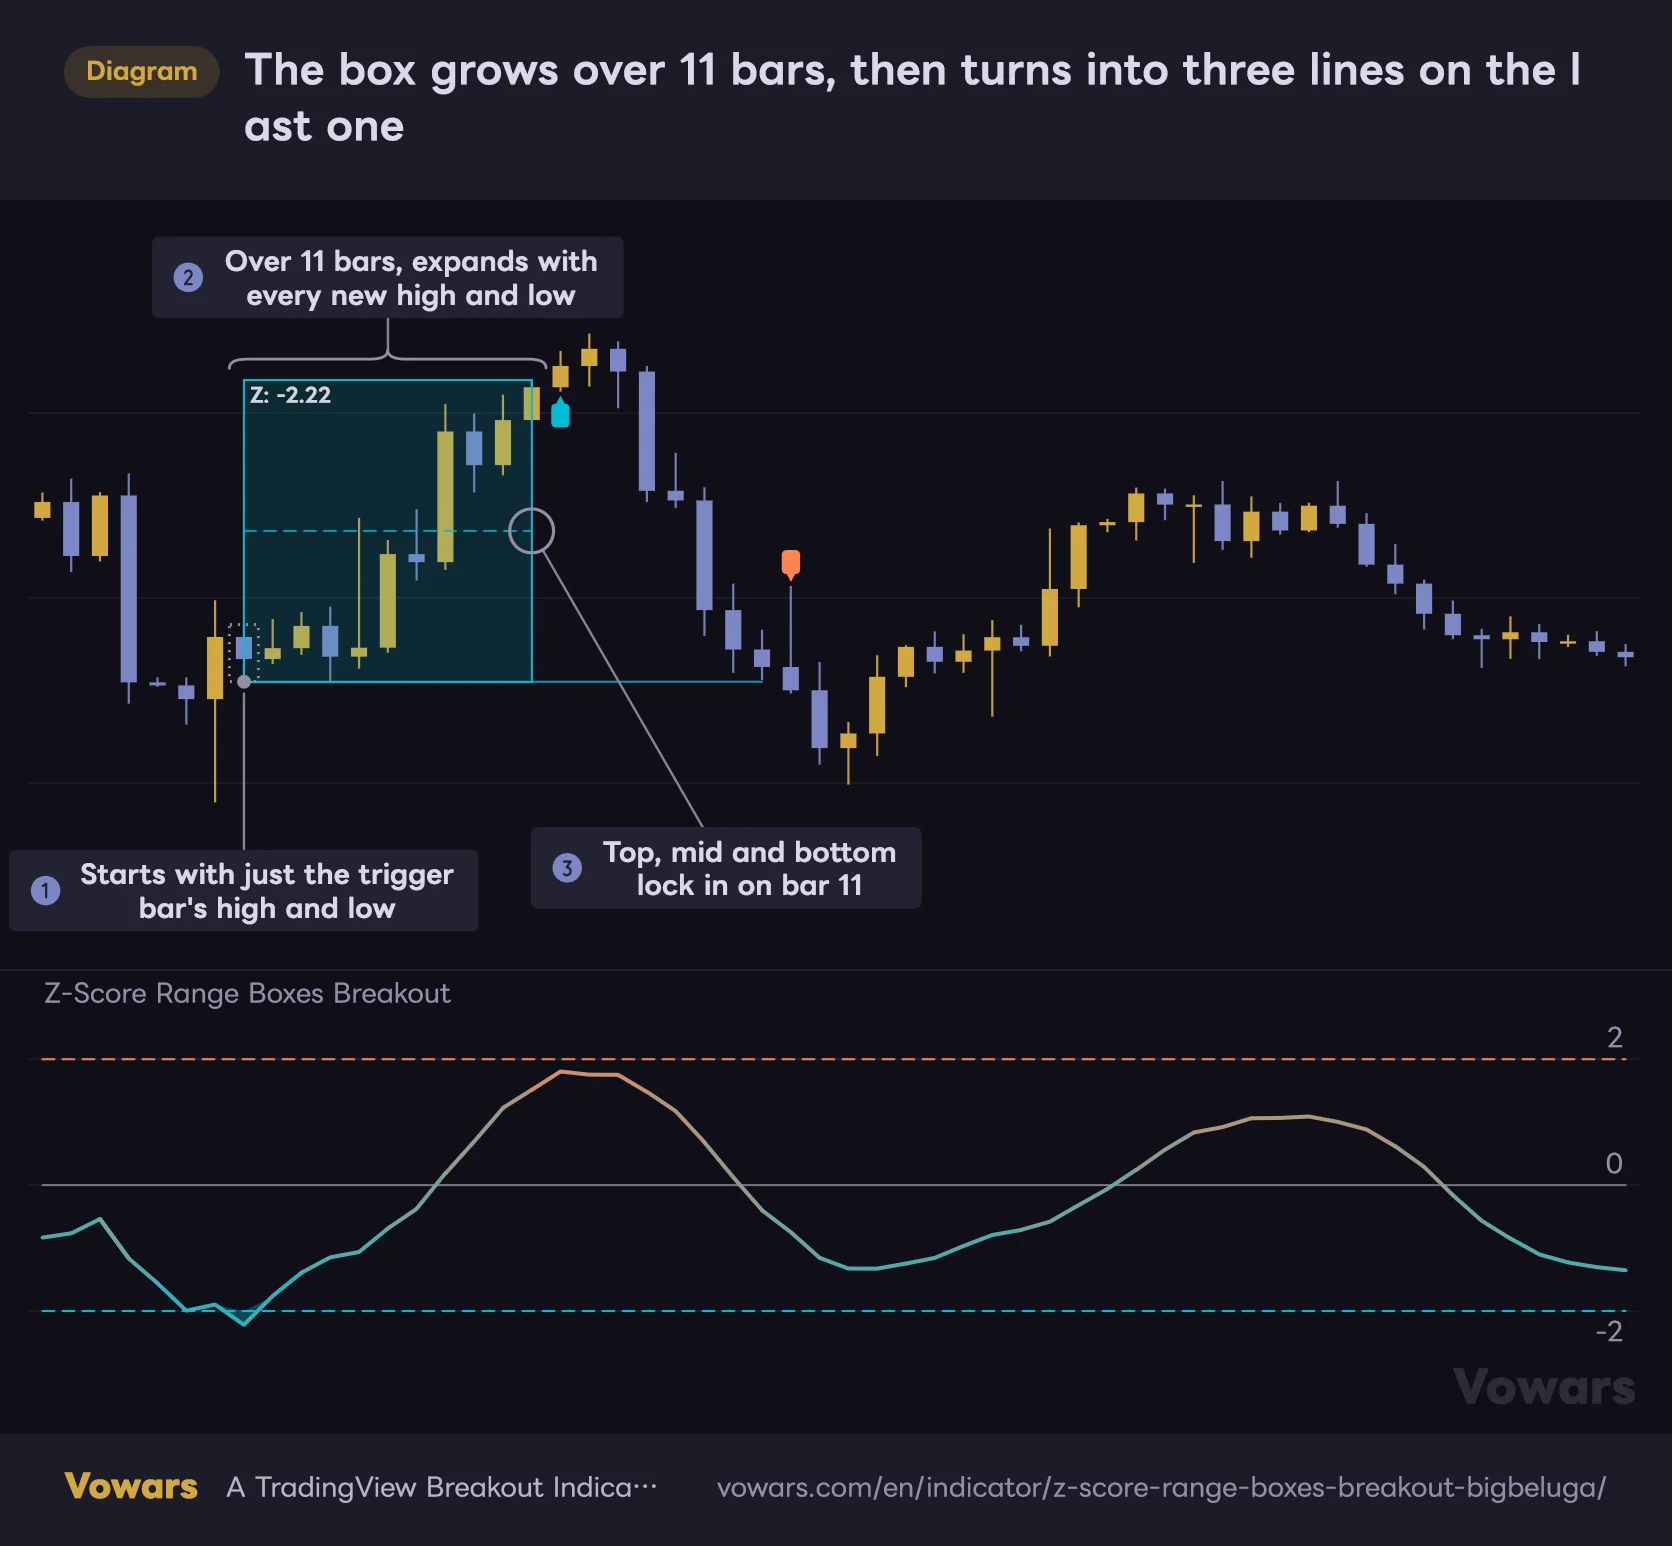
The box grows over 11 bars, then turns into three lines on the last one
From the bar where Z crosses below -2, the box grows by picking up the highs and lows of 11 bars at default settings.
Vowars DE ver.3.12.11
1The trigger is the bar where the Z-Score crosses ±2
When the smoothed Z-Score crosses below Oversold Trigger Level (-3 or -4) you get an aqua box, and when it crosses above Overbought Trigger Level (3 or 4) you get an orange box. At first, the box only covers the high and low of that single trigger bar Figure ①. The number inside the box, like “Z: -2.22,” is the Z-Score calculated on that trigger bar.
2For 11 bars, the box stretches to fit the highs and lows
From there, every new bar that makes a higher high or a lower low stretches the box up or down Figure ②. Box Period Length (Bars) defaults to 10, but the trigger bar counts too, so the box actually spans 11 bars. I assumed it was 10 at first and only caught it after recounting the candles.
3Top, mid and bottom lock in on the last bar
The box locks in on the 11th bar. At that moment, three lines are drawn: the top (solid), the midline (dashed) and the bottom (solid) Figure ③. The dashed midline sits exactly halfway between the top and bottom. From the next bar on, all three lines extend to the right one bar at a time.
In the settings, the aqua box color is called Oversold / Bullish Color and the orange one Overbought / Bearish Color, but the box color does not tell you whether to buy or sell. Aqua just means price got stretched below its average, and orange means it got stretched above. Which way it breaks afterward is a separate question.
Breakout markers, and which lines stop or keep going
Once the box locks in, you’re waiting for a candle to close beyond the top or the bottom. There are a few rules here that are easy to misread.
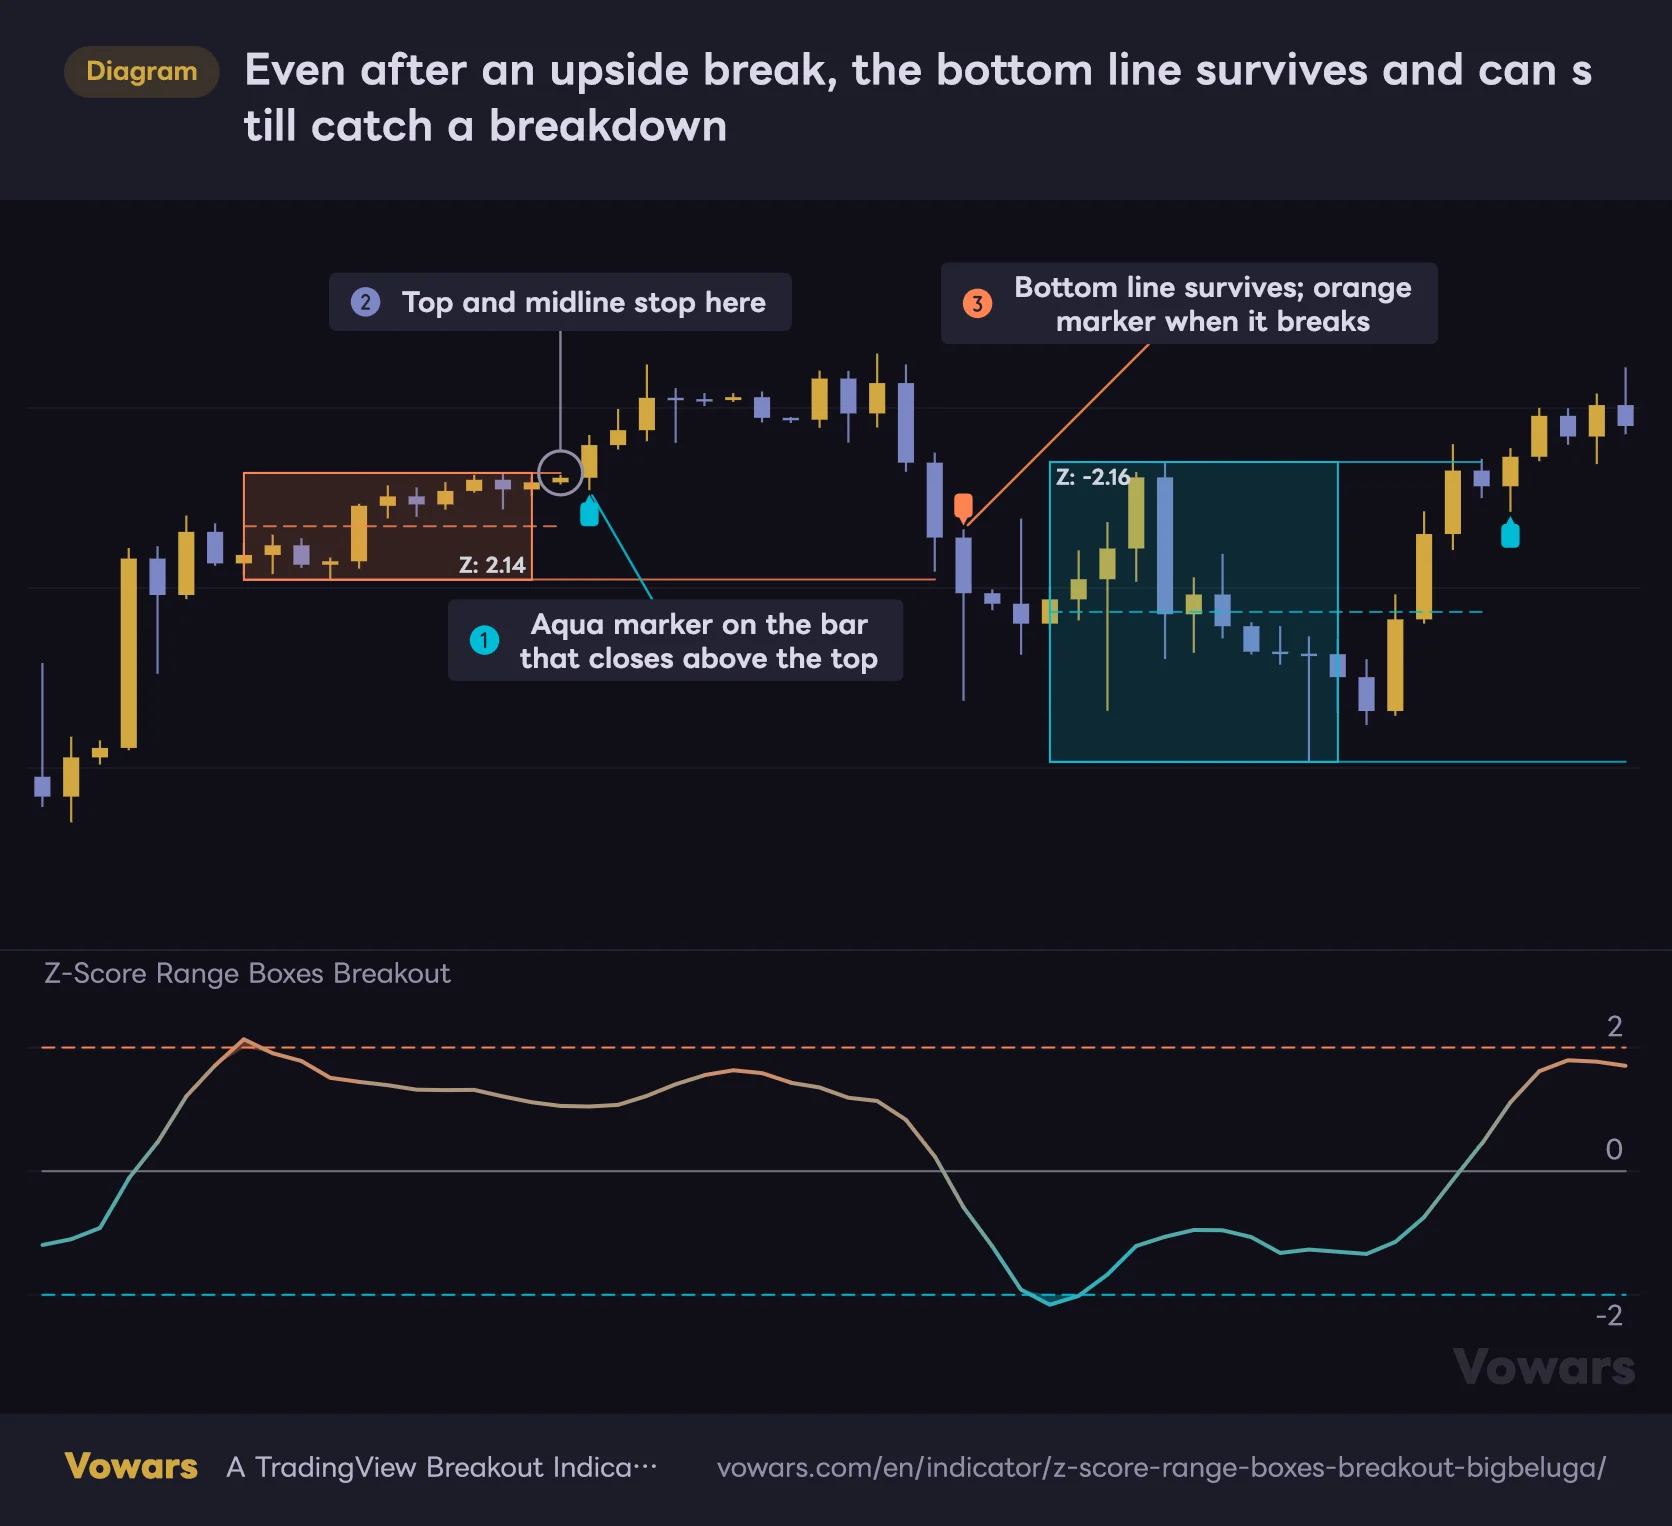
Even after an upside break, the bottom line survives and can still catch a breakdown
Only the broken side's lines stop; the opposite line keeps extending until the next box forms.
Vowars DE ver.3.12.11
Marker color follows the breakout direction, not the box color
When a candle closes above the top, an aqua marker prints below that candle Figure ①. When a candle closes below the bottom, an orange marker prints above it. The box on the left side of the figure is orange, but it broke to the upside, so the marker is aqua.
Only the close counts. A wick poking through a line won’t print a marker. Also, the bar where the box locks in can never print a marker; the earliest possible signal is the next bar. That one-bar delay is by design.
Only the broken side stops; the other side keeps running
On an upside breakout, the top line and the midline stop just before the breakout bar Figure ②. The bottom line, however, keeps extending, and if a candle later closes below it, an orange marker prints Figure ③.
That’s why a single box can produce both an upside and a downside marker. The script’s description says the lines get cleared on a breakout to reset for the next signal, but in practice the lines don’t disappear. They simply stop extending and stay right where they are.
| Event | Top line | Midline | Bottom line | Marker |
|---|---|---|---|---|
| Close breaks above the top | Stops here | Stops here | Keeps extending | Aqua, below the candle |
| Close breaks below the bottom | Keeps extending | Stops here | Stops here | Orange, above the candle |
| Next box is triggered | Stops | Stops | Stops | None |
No new box while one is still forming
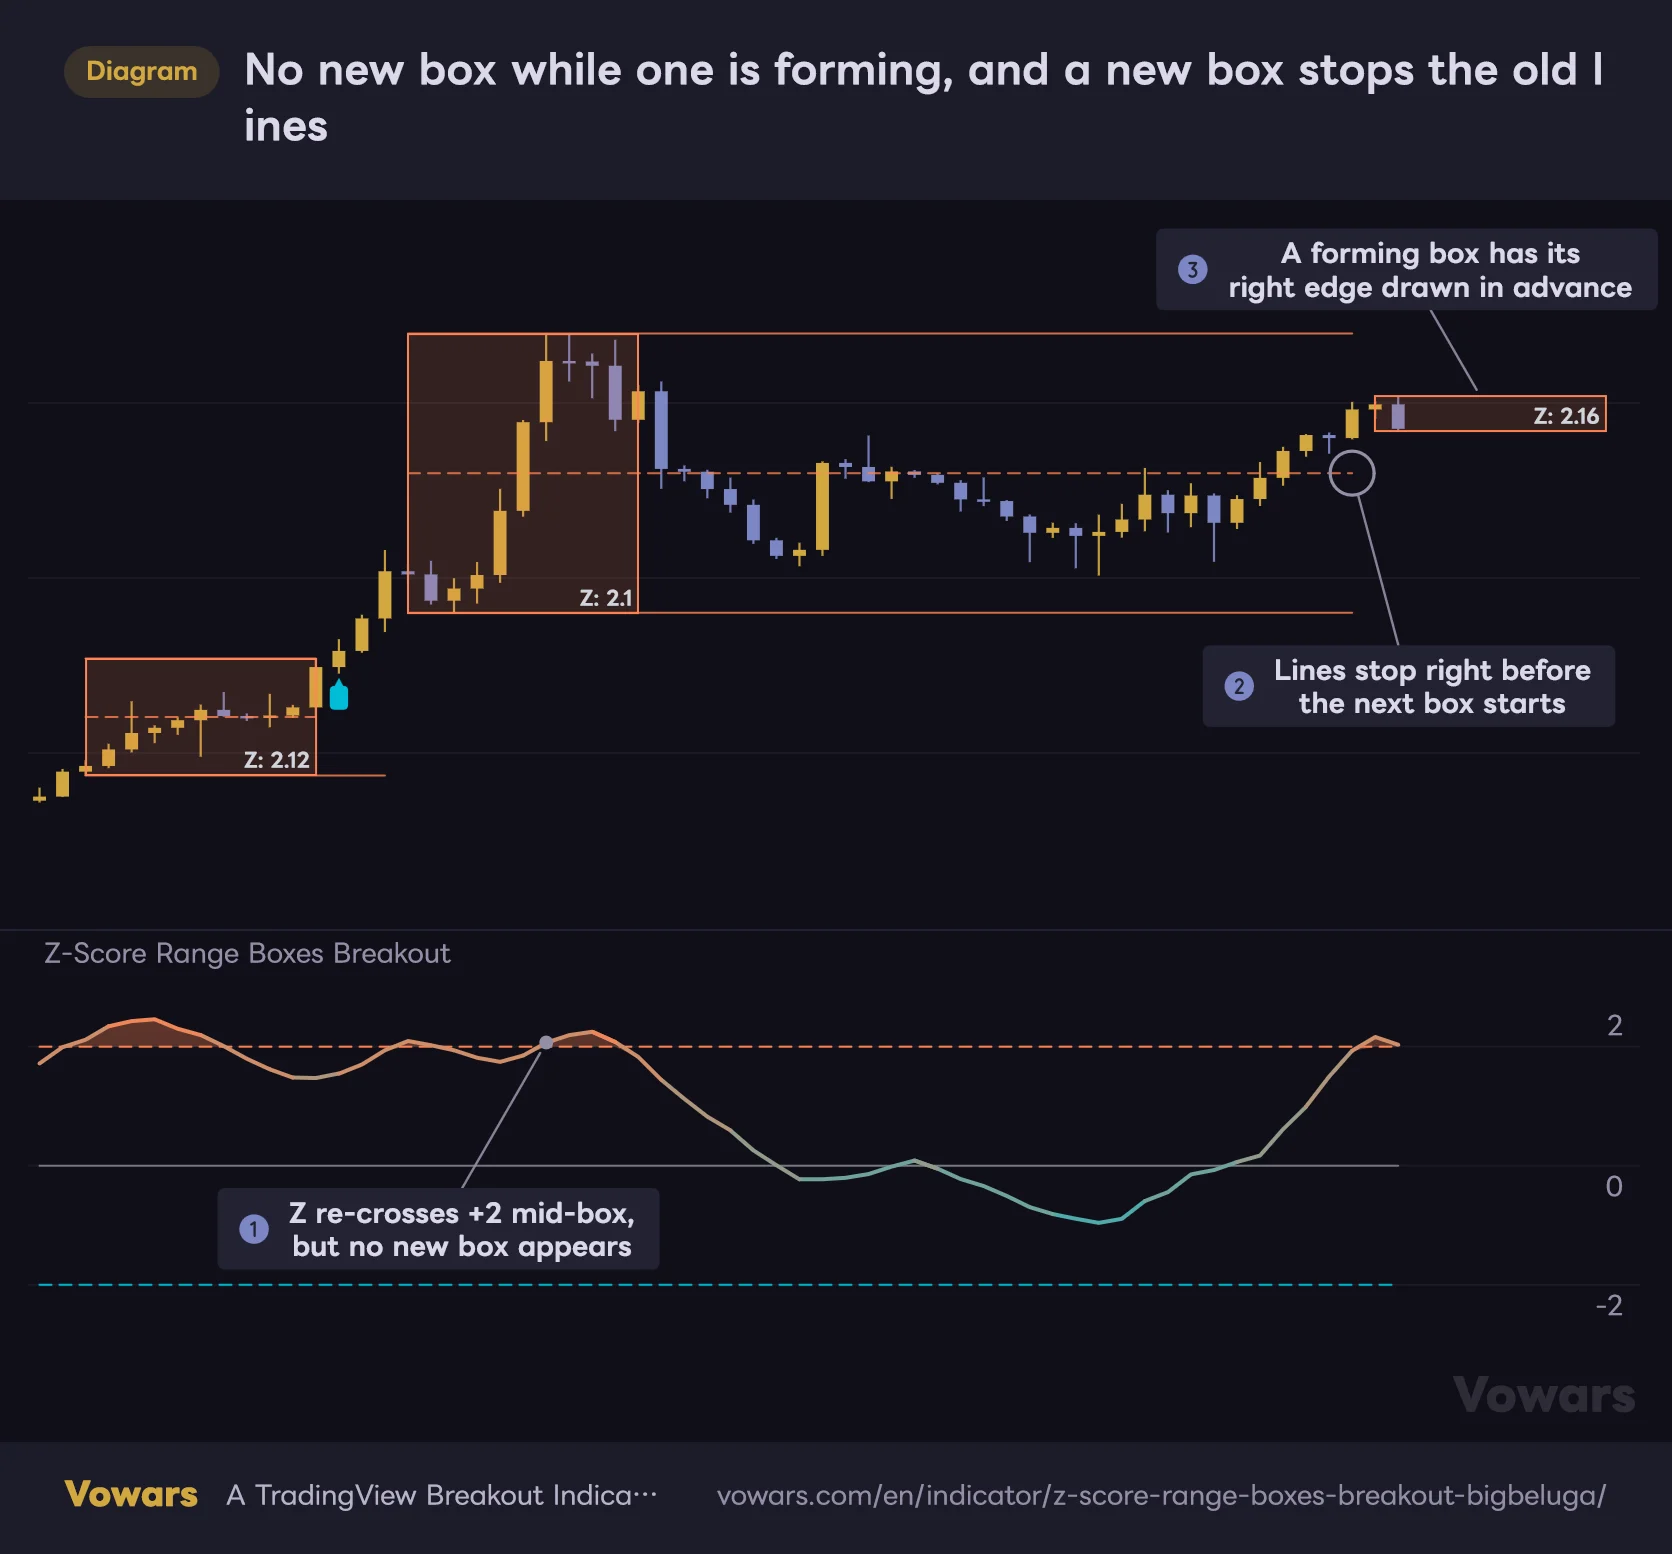
Another important rule: only one box can be under construction at a time. If the Z-Score crosses ±2 again while a box is still forming, no new box is created Figure ①.
No new box while one is forming, and a new box stops the old lines
Only one box can be built at a time. Overextensions that happen while a box is forming are ignored.
Vowars DE ver.3.12.11
On the other hand, when a new trigger fires after a box has locked in, every line that was still extending stops right before it Figure ②. That applies even to lines that were never broken. If you see a line that just ends mid-chart, it’s usually where the next box started.
To be precise, the lockout covers the 11 bars of the box plus the one bar right after it locks in. If the Z-Score crosses ±2 again on that very next bar, it’s skipped.
A box that’s still forming, like the one on the far right, has its frame drawn 10 bars ahead of the trigger bar right away Figure ③. Its height isn’t final yet, so it’s way too early to use that top or bottom for limit orders. When the frame appears, count how many bars are left until the lines get drawn and wait for the box to lock in. That’s the calmer way to use it.
What I saw running it on Bitcoin
Here’s what I noticed after loading “Z-Score Range Boxes Breakout” on Bitcoin’s 4H, daily and 1H charts and following it by eye.
On the 4H, orange boxes stack up along the uptrend
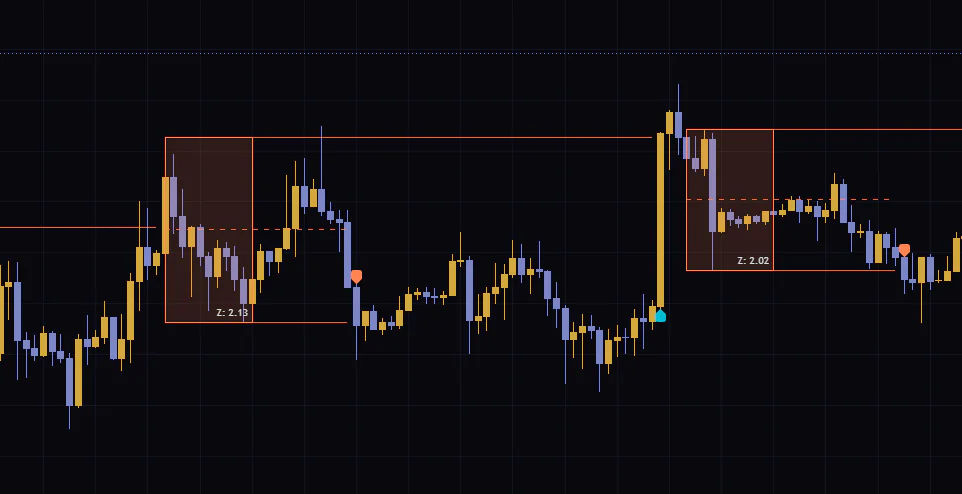
On the 4H chart from mid-August to late September 2026, most of the boxes were orange. Several times, a box formed each time the Z-Score pushed above +2 during the rally, price broke its top and moved up to the next step, like a staircase. It’s an easy pattern to read.
The box from late August was the interesting one. Price first closed below the bottom and printed an orange marker, then in early September a close broke above the top line that had kept extending, and this time an aqua marker printed. One box ended up acting as the breakout level for a move more than a week later. If you don’t know that the opposite line stays alive, you’ll probably be confused about which box that aqua marker came from.
On the daily, one box can frame the range for months
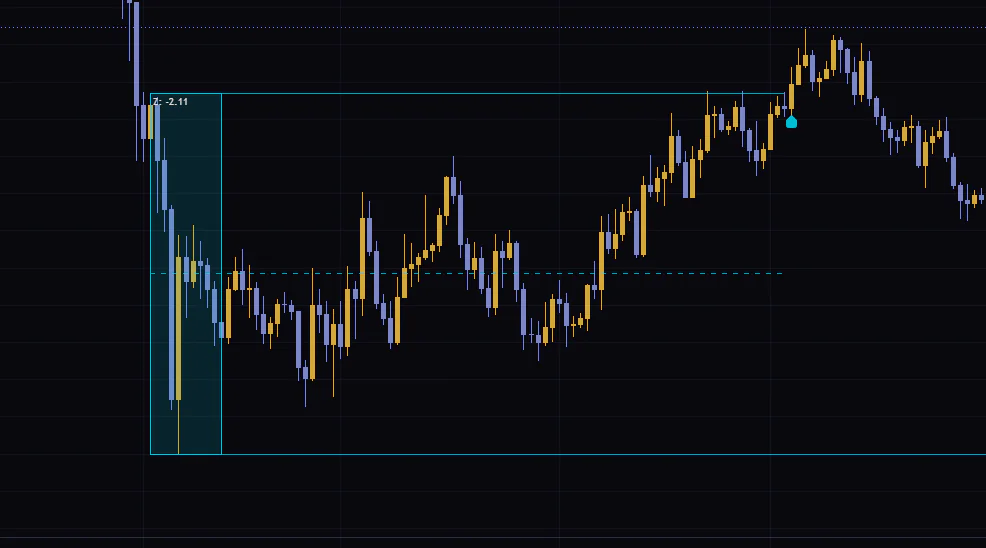
The daily chart was even more extreme. The aqua box that formed when the Z-Score dropped below -2 during the February 2026 sell-off acted as a frame for roughly three months, with price chopping around between its top and bottom most of that time. After an aqua marker printed on a break above the top in early May, price pushed one leg higher, but the rally didn’t last and rolled over within about 10 days. Breaking the top of a box doesn’t guarantee a big trend.
The aqua box from June, on the other hand, printed an orange marker on a break below its bottom and then quickly reversed and rallied. That downside marker turned out to be a shakeout near the lows. A classic trap. The next upside marker came in mid-August, which means the top of the June box stayed alive as a breakout level for more than two months.
On the 1H, boxes get tighter and markers get more frequent
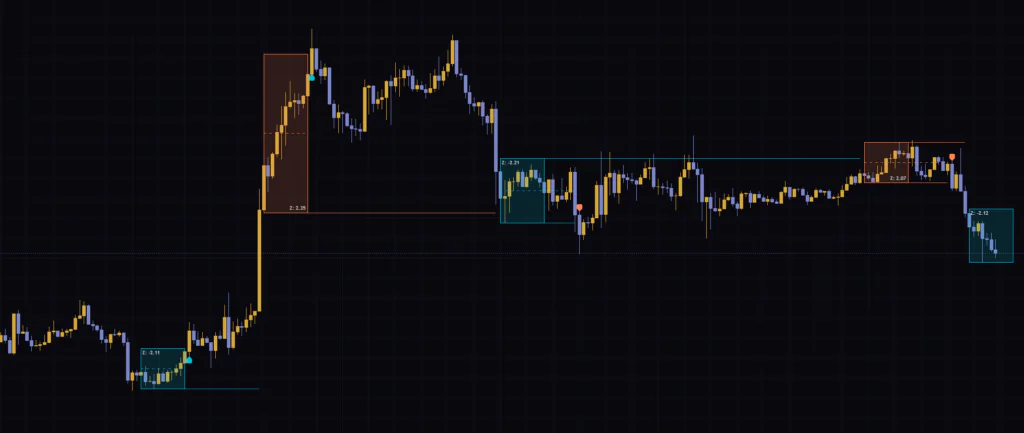
Drop down to the 1H and you get noticeably more boxes and more markers. The chart gets busy. The aqua box that formed around midnight on September 24 printed a marker when price broke its bottom that same evening, but price then chopped around near the box, and only the top line kept extending sideways for about three days. The lower the timeframe, the tighter the boxes, so markers print more easily, but each one carries less weight.
Fakeouts love tight boxes
The thing I’d watch out for most is markers from tight boxes. They stand out more on lower timeframes. When a trigger fires in the middle of a consolidation, the box locks in while the 11 bars’ highs and lows are still close together, so the top and bottom end up very close to each other.
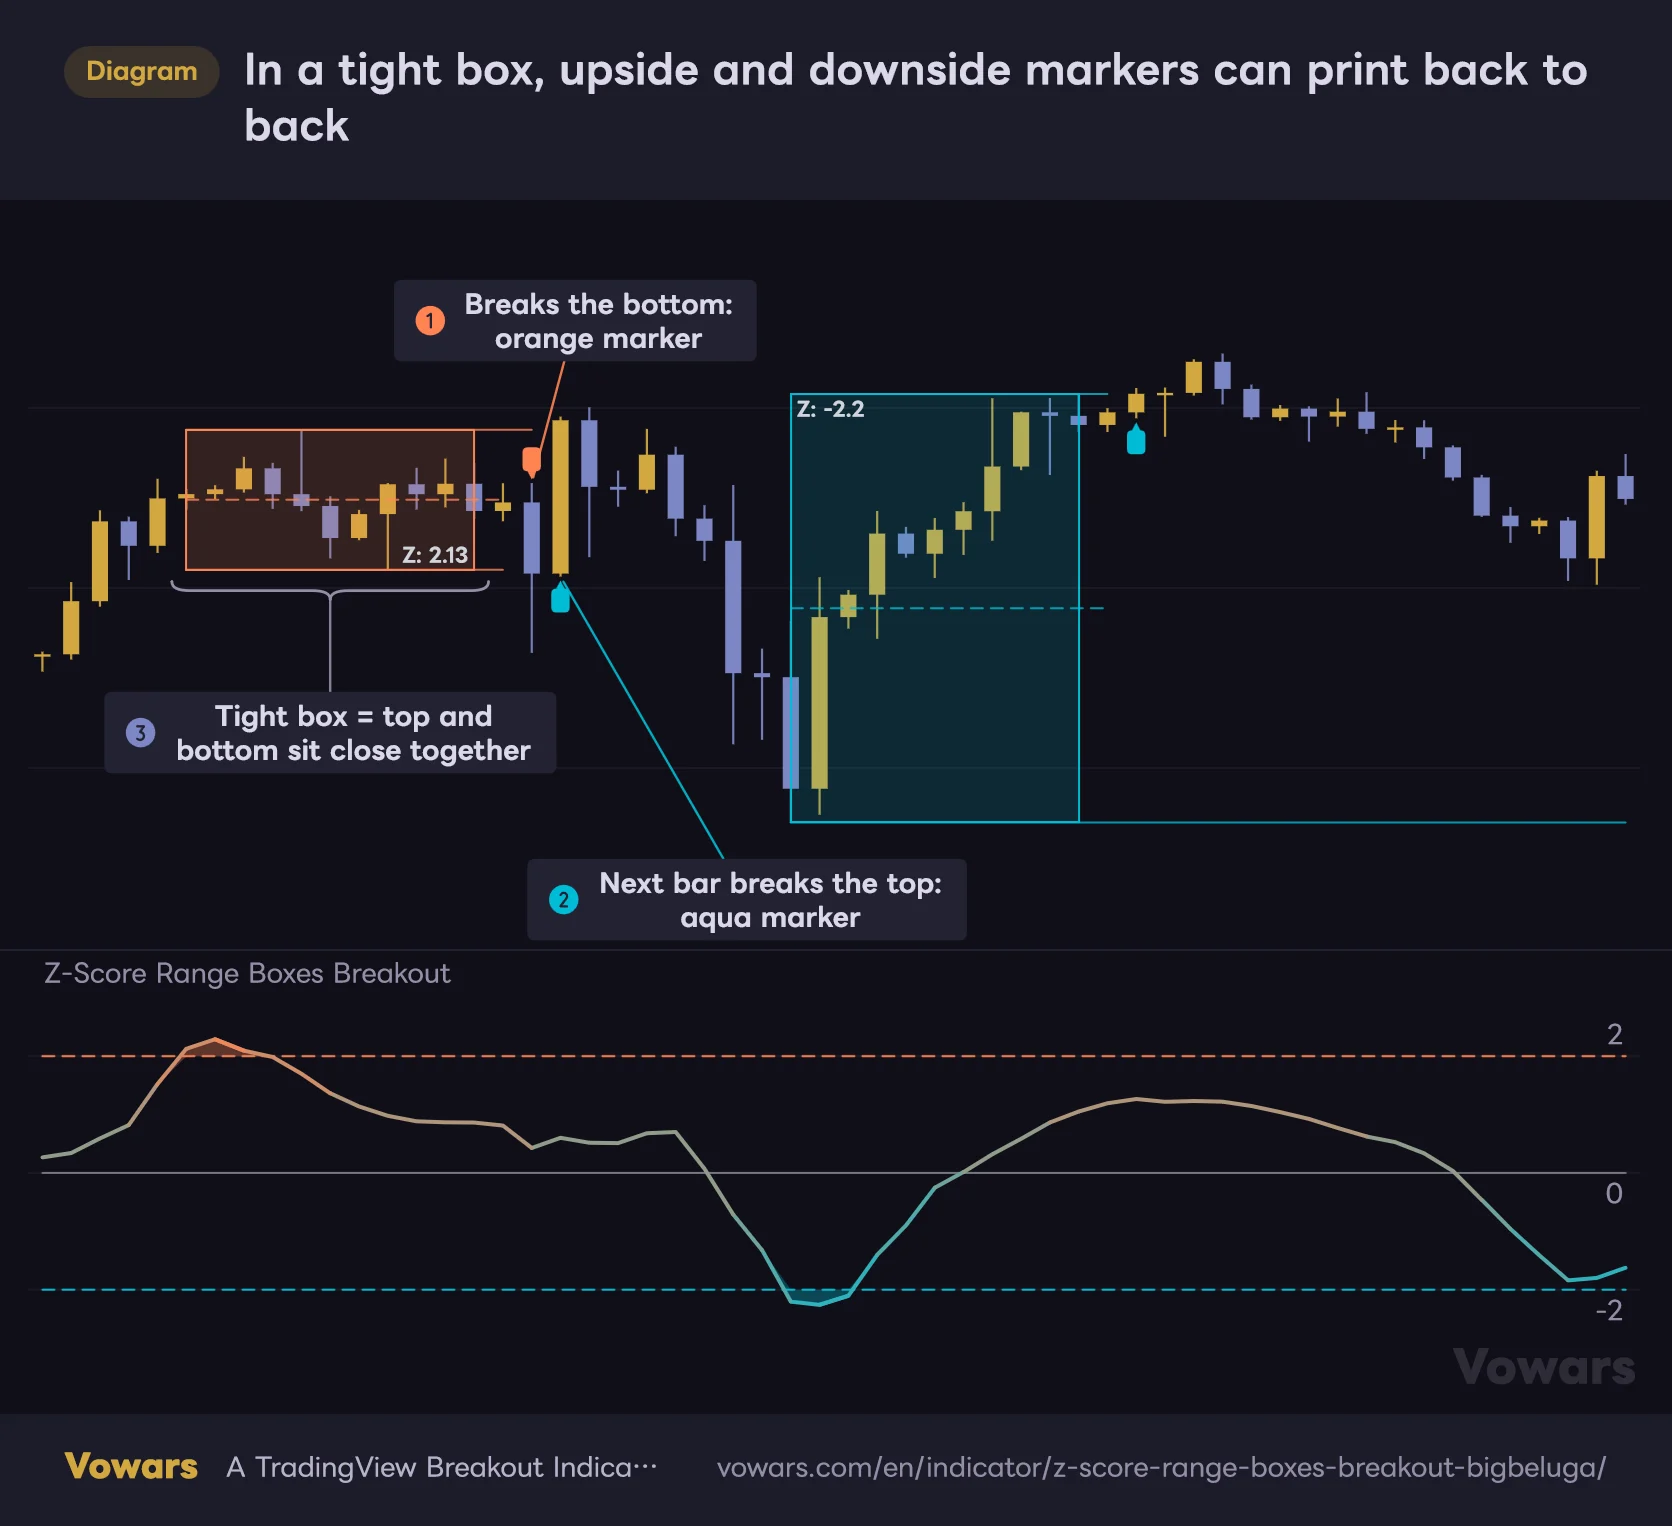
In a tight box, upside and downside markers can print back to back
When the box is narrow, even a small move can break both the top and the bottom.
Vowars DE ver.3.12.11
In the figure, price breaks below the bottom and prints an orange marker Figure ①, and on the very next bar it closes above the top and prints an aqua marker Figure ②. Both markers are based on confirmed closes, so neither disappears, but anyone who jumped on the first signal would have been whipsawed the other way. That one hurts.
When the box is only one or two average candles tall for that timeframe, it’s safer to hold off on acting right away and check whether the next bar stays outside the line. Both sides break easily in that situation, and your stop ends up far too close.
Boxes that stretched wide after a big pump or dump are a different story. There’s plenty of distance between the top and bottom, so a break actually means something. I think that range difference is a big part of why the markers on the 4H and daily felt more meaningful.
The other trouble spot is the middle of a strong trend. In an uptrend the Z-Score pushes above +2 over and over, so orange boxes keep printing. An orange marker on a break below one of those boxes can turn out to be nothing more than a pullback rather than the end of the trend. Having a separate yardstick for which markers to take makes the call much easier (more on that below).
Settings, and how to tune them for your goal
The parameter names below are exactly as they appear in the settings panel.
| Setting | Default | Suggested | Effect |
|---|---|---|---|
| Z-Score Length | 20 | 20 (standard) / 30–50 (longer) | Number of bars used for the average and standard deviation. Raising it measures distance from a longer-term average, so during trends the Z-Score stays outside ±2 for longer |
| Z-Score Source | close | close | Price source for the Z-Score. Switching to high or low brings wick extensions into the calculation. Breakouts are always judged on the close regardless of this setting |
| Smoothing Line Length | 5 | 3–8 | Number of bars used to smooth the Z-Score. Lower reacts faster and creates more boxes; higher lags more and produces fewer triggers |
| Oversold Trigger Level (-3 or -4) | -2.0 | -2.0 to -2.3 | An aqua box forms when the Z-Score crosses below this level. Adjustable in 0.1 steps |
| Overbought Trigger Level (3 or 4) | 2.0 | 2.0 to 2.3 | An orange box forms when the Z-Score crosses above this level. Adjustable in 0.1 steps |
| Box Period Length (Bars) | 10 | 10 (standard) / 15–20 (less noise) | Number of bars the box tracks highs and lows for. Including the trigger bar, the box locks in after this number + 1 bars |
| Oversold / Bullish Color | Aqua | Your preference | Color of aqua boxes, lines and upside breakout markers |
| Overbought / Bearish Color | Orange | Your preference | Color of orange boxes, lines and downside breakout markers |
Box Period Length (Bars) sets box size and how early markers print
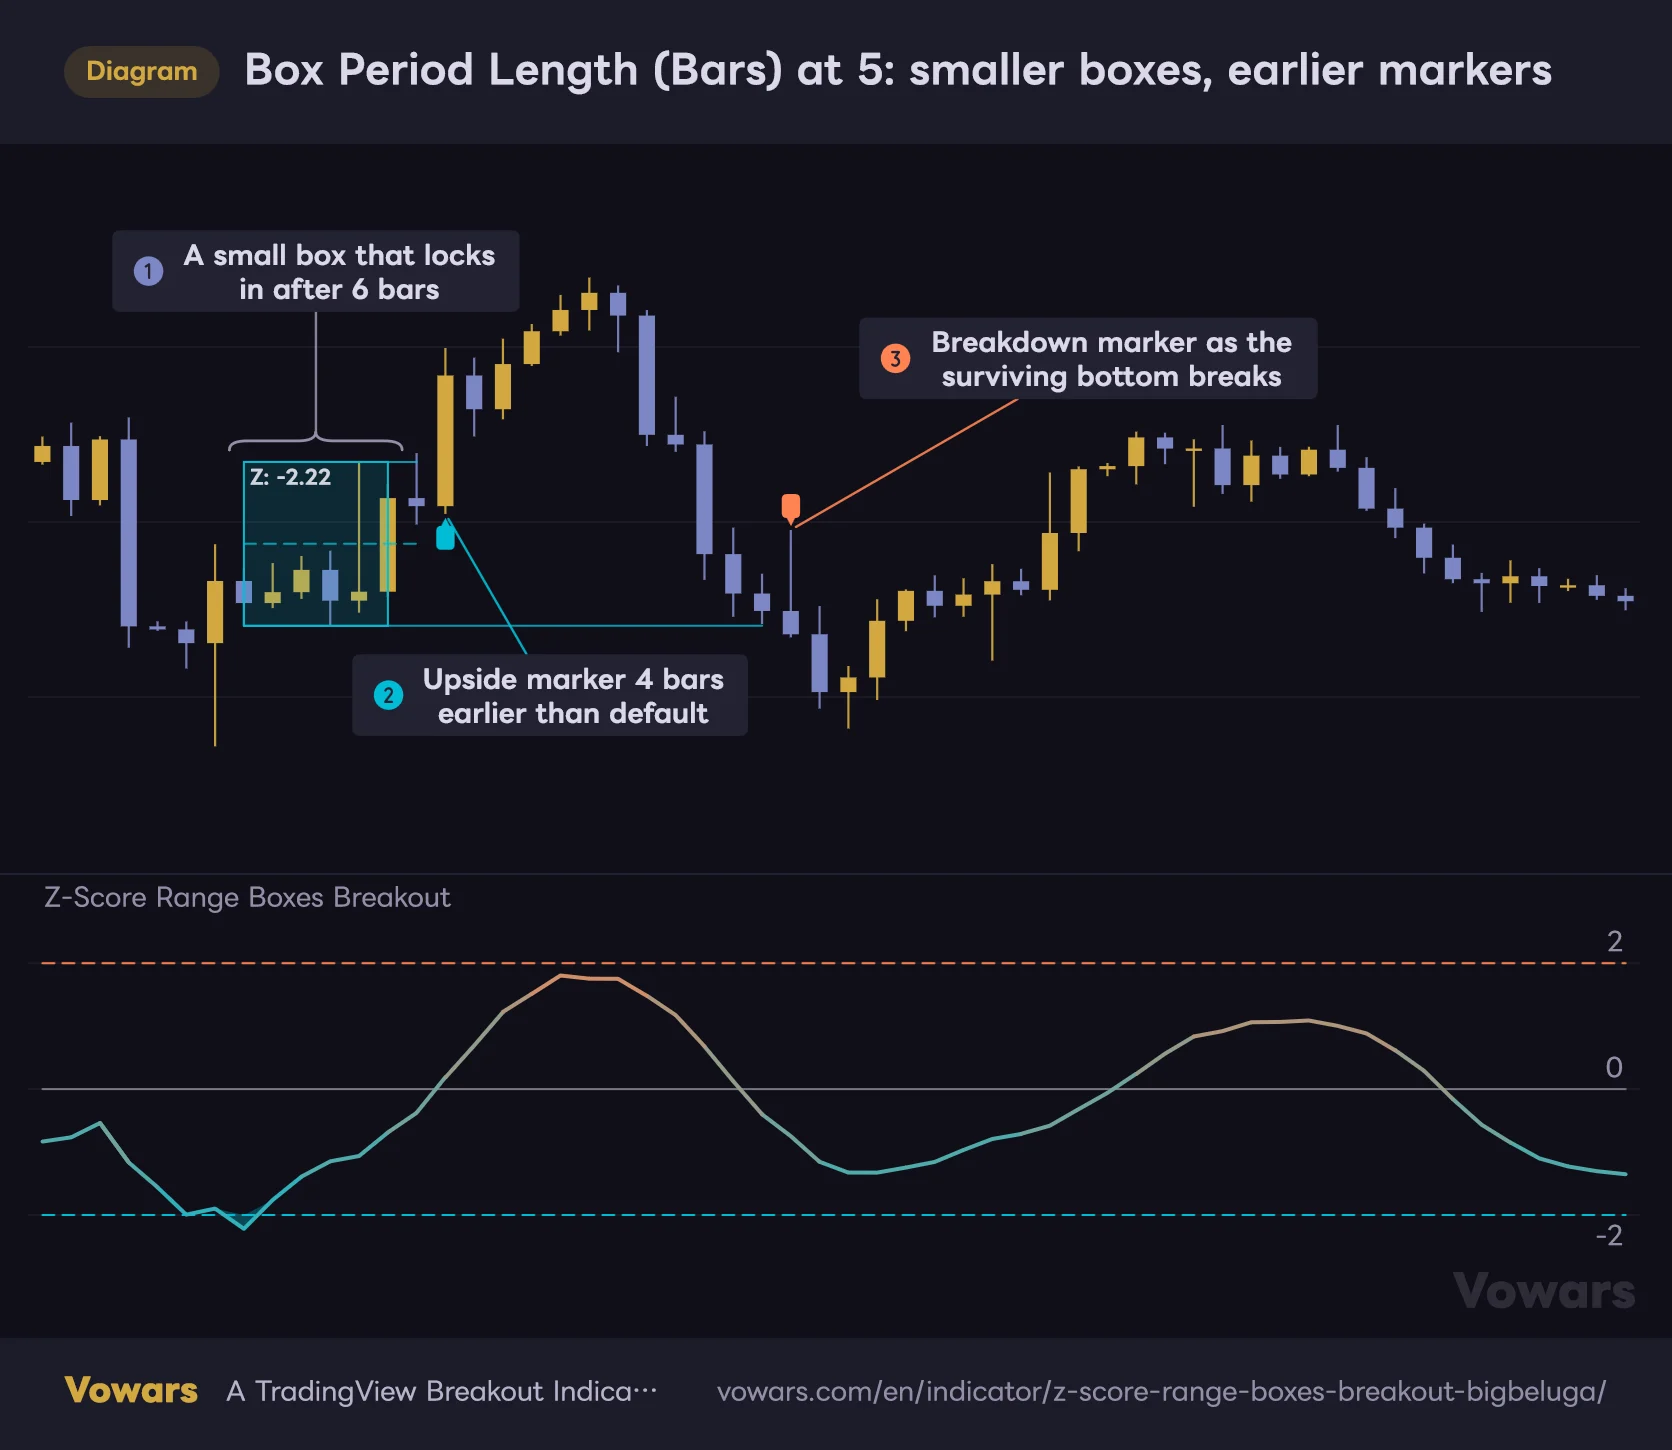
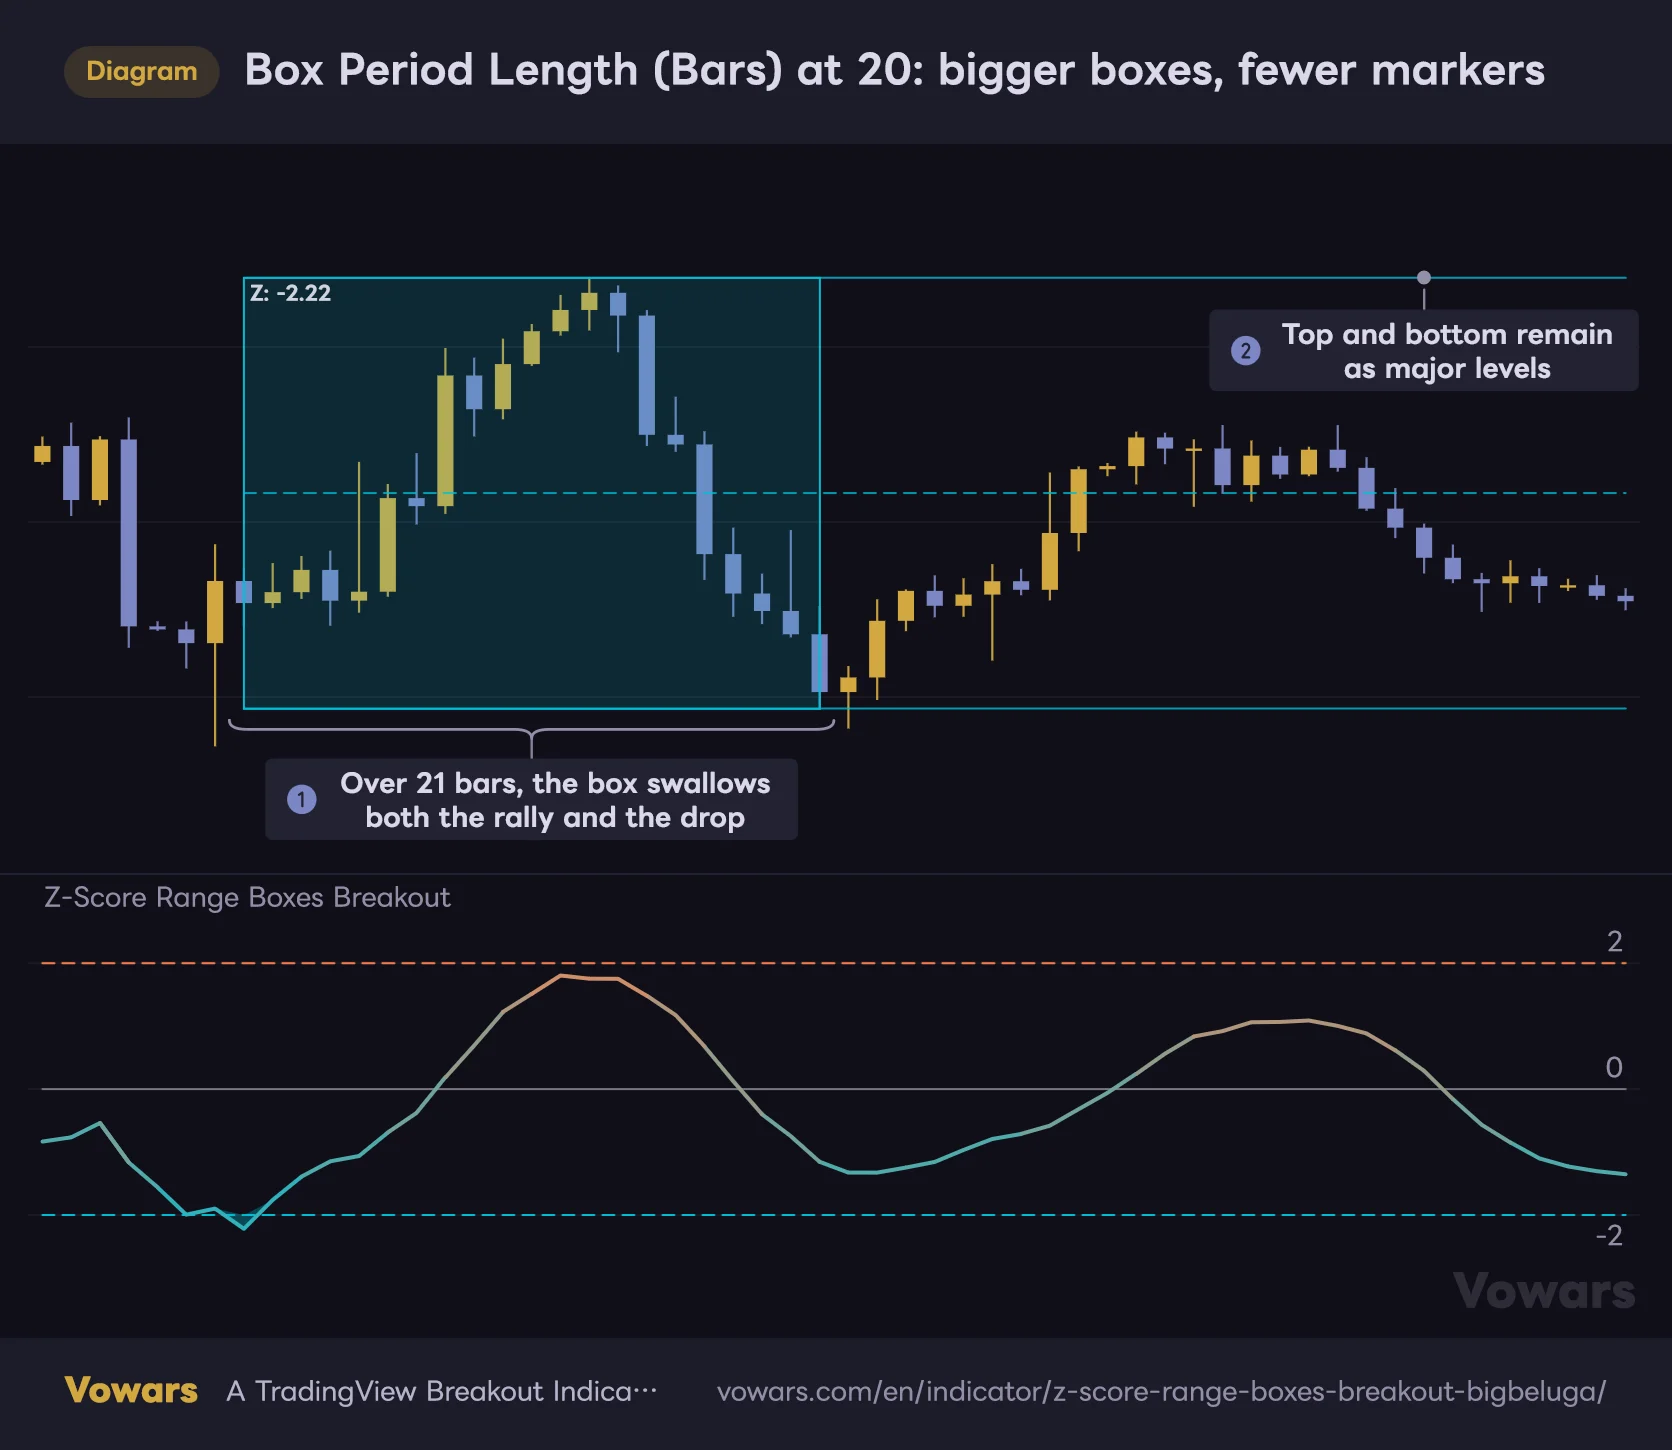
The setting with the most obvious effect is Box Period Length (Bars). I ran the same price action with it set to 5 and 20 and put them side by side. For the default of 10, see the box-building figure.
Box Period Length (Bars) at 5: smaller boxes, earlier markers
Same price action as the box-building figure, with only this setting changed to 5.
Vowars DE ver.3.12.11
At 5, the box locks in after 6 bars including the trigger bar Figure ①, and the upside marker printed 4 bars earlier than with the default Figure ②. You get in earlier. The flip side is that smaller boxes fall into the fakeout pattern from the previous section more easily.
Box Period Length (Bars) at 20: bigger boxes, fewer markers
Same price action, with this setting changed to 20.
Vowars DE ver.3.12.11
At 20, the box swallows both the rally and the drop Figure ①, and not a single marker printed in this stretch. In exchange, the top and bottom that remain become much bigger levels Figure ②. It’s the setting for when you want fewer markers and only care about breaks of large ranges.
About the “-3 or -4” in the threshold names
Oversold Trigger Level (-3 or -4) and Overbought Trigger Level (3 or 4) have 3 and 4 right in their names, but the defaults are ±2.0. A little confusing. Across the periods I had loaded on Bitcoin’s 4H, daily and 1H charts, the 5-bar smoothed Z-Score reached ±3 only once, on the daily. Smoothed values rarely swing that far out, so if you plug in ±3 or ±4 as the names suggest, you’ll barely get any boxes.
Even a small widening of the thresholds has a big impact. In a test on randomly generated price data, setting them to ±2.5 cut the number of boxes to about a tenth of the default. My suggestion is to start at ±2.0, and if you feel there are too many boxes, widen them in 0.1 steps up to around ±2.3.
Setting combos by goal
| Goal | What to change | Why |
|---|---|---|
| More boxes and markers, faster reactions | Smoothing Line Length to 3, Box Period Length (Bars) to 5–7 | Triggers come earlier and boxes get smaller. Expect more fakeouts, so trade in the direction of the higher timeframe |
| Less noise, only the big breakouts | Box Period Length (Bars) to 15–20, thresholds around ±2.2 | Bigger boxes and fewer markers. Suited to swing trading |
| Avoid chop on lower timeframes | Box Period Length (Bars) around 15 | On the 1m and 5m, an 11-bar range is often too tight, so stretching the box horizontally gives it more room |
| Measure distance from a longer average | Z-Score Length to 30–50 | During trends the Z-Score stays outside ±2 for longer, and triggers now mean “overextended relative to the longer average” |
Running Smoothing Line Length through the same test, 3 produced about 1.5x as many boxes as the default, and 8 cut them to less than half. Faster reactions mean more boxes, slower means fewer. That’s all you really need to remember.
There’s no “correct” value for any of these. What works depends on the asset and how much the timeframe moves. If you’re looking for a good fit, markets that make a sharp move and then stall, such as gold or index futures around news releases and session opens, are strong candidates, because that’s exactly the “overextend, then consolidate” behavior the boxes assume. Start with the defaults, look back over a month or two, and adjust once you’ve seen how wide the boxes are and how many markers print.
Pair it with an EMA to decide which markers to take
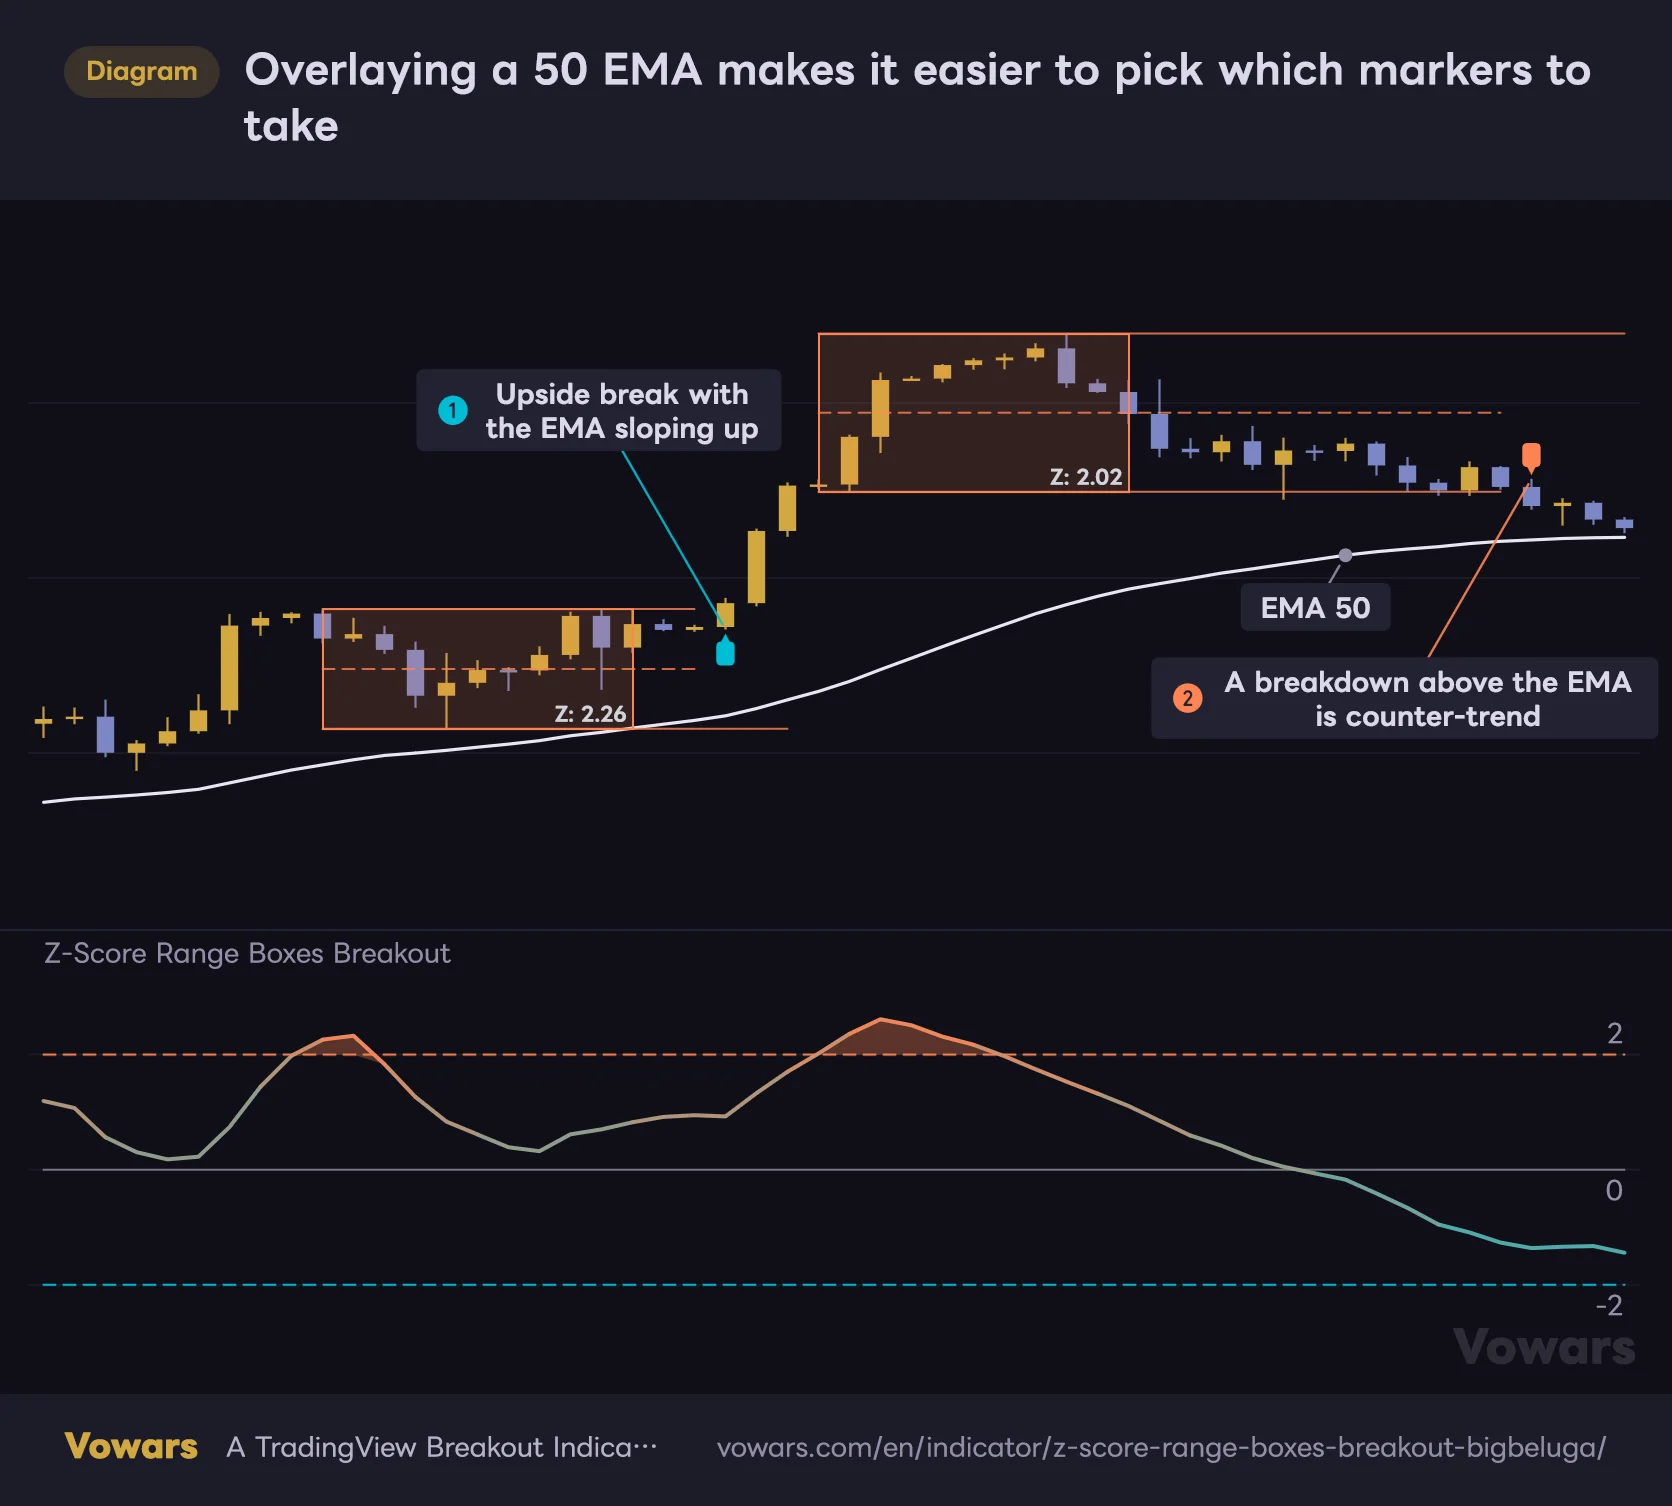
As mentioned in the fakeout section, “Z-Score Range Boxes Breakout” prints upside and downside markers with equal weight. The pairing I think works best is to overlay an EMA (exponential moving average) and only take markers in the direction of the trend.
Overlaying a 50 EMA makes it easier to pick which markers to take
Among markers printed above a rising EMA, prioritize the ones pointing the same way as the trend.
Vowars DE ver.3.12.11
The approach is simple. When the EMA is sloping up and price is above it, treat the aqua upside markers as the main signal Figure ①. An orange downside marker in that same context is more likely the start of a pullback to the EMA than a trend reversal Figure ②. In a downtrend, flip the logic.
For the EMA length, I use something around 50, clearly longer than the 20-bar Z-Score lookback. Using a longer average lets you read short-term overextension and the medium-term trend on two separate yardsticks, which is what makes this combo work. Note that the EMA isn’t part of “Z-Score Range Boxes Breakout”; add TradingView’s Moving Average Exponential to the chart separately.
When trading markers on the 1H, it’s also worth checking where the 4H and daily box tops and bottoms are. “Z-Score Range Boxes Breakout” has no option to display higher-timeframe boxes, but with TradingView’s multi-chart layout you can put a higher timeframe next to it and compare the boxes from the same indicator. How many charts you can show depends on your plan.
Before you use it: repainting and alerts
What prints on a closed bar stays put
No future bars or higher-timeframe data are pulled in anywhere. Markers printed on closed bars and the top and bottom of a locked-in box never get redrawn somewhere else later. A forming box expanding or lines extending to the right is simply the designed behavior described above.
The live bar (the real-time bar that’s still forming) is a different story. If the Z-Score crosses ±2 or price moves beyond a line mid-bar, the box or marker shows up right away. If the condition no longer holds by the time the bar closes, it disappears. That’s just how indicators run on TradingView, not a flaw specific to this one, but you’ll avoid a lot of confusion if you make it a rule to only act on markers after the bar closes.
No built-in alerts (as of 2026/9/29)
The script’s description mentions breakout alerts, but the version published as of 2026/9/29 doesn’t include any alert conditions for breakouts. In other words, there’s currently no way to get notified directly when a marker prints. That’s a bit of a letdown.
There are two workarounds. The first is an alert based on one of the indicator’s plots. TradingView lets you create alerts on the lines an indicator draws (its plots) using conditions like “Crossing.” Set one for when “Smoothed Z-Score Gradient” crosses 2 or -2, and you’ll know a box has started forming. Keep in mind that it will also fire on crosses that happen while a box is still forming, so check the chart to confirm a new box actually appeared. The second is to draw your own horizontal lines at the top and bottom once the box locks in and set alerts on those lines. If you set the alert to trigger “Once Per Bar Close,” it gets quite close to the close-based condition the markers use.
This indicator isn’t a strategy, so it can’t produce a Strategy Tester performance report. If you want to review past behavior, use Bar Replay and step forward one bar at a time; you’ll see the box expand, lock in and extend its lines in the same order as in real time. How far back you can go depends on your plan and the timeframe.
Old boxes disappear once there are enough of them
Boxes, lines and markers are each capped at 500 on the chart. Once the cap is exceeded, the oldest ones are removed automatically, so if you scroll far back on something like the 1m chart, older boxes may be missing. Since each box uses three lines, the line cap is actually reached before the box cap.
Where it shines, and where to be careful
Where it shines
- Automatically boxes up the range after a pump or dump, so you no longer have to redraw the top and bottom by hand
- Each box starts on the same bar as the Z-Score trigger in the lower pane, so you can instantly see why a box is there
- The opposite line stays alive, so one box can track breakouts days later
- Anything printed on closed bars doesn’t repaint, so it behaves the same on historical and live charts
- Only a handful of settings, and changing Box Period Length (Bars) alone adjusts box size and how early markers print
Where to be careful
- Tight boxes tend to print upside and downside markers back to back
- Box colors and marker colors mean different things, which is easy to misread at first
- No breakout alerts, so notifications take some workarounds
- In strong trends, same-direction boxes keep coming, and counter-trend markers can turn out to be mere pullbacks
- It can’t catch a new overextension during the 11 bars of box building or the bar right after the box locks in
Treat the box lines as a map of where the next move starts
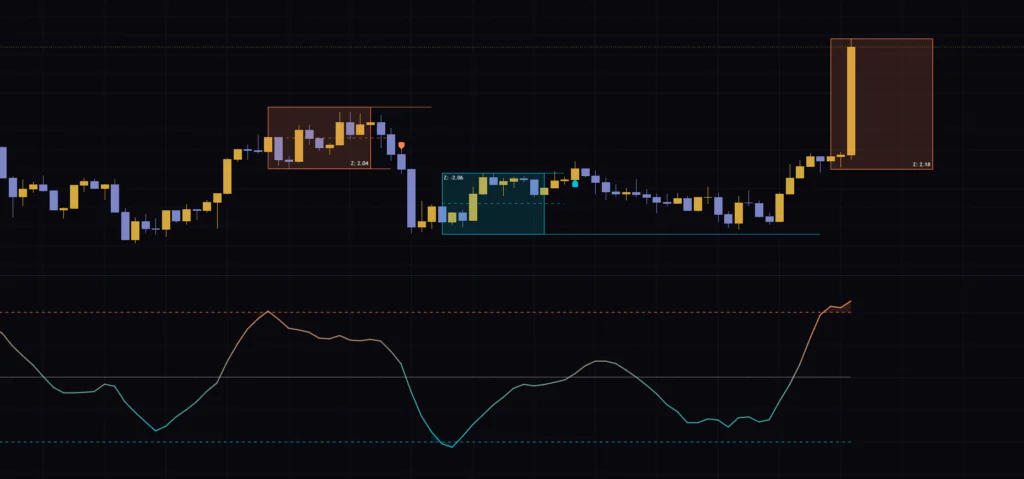
The biggest value I found in “Z-Score Range Boxes Breakout” is that it leaves the range formed after an overextended move on the chart in a form you can look back on. Use the Z-Score to set the starting point, build a box from 11 bars of price action, and use its top and bottom as breakout levels. The mechanics aren’t complicated, but for sorting out what happens after a sharp move, it’s much faster and more consistent than drawing lines by hand.
 Image
ImageThat said, the markers print with equal weight in both directions, so if you trade them on their own, tight boxes and counter-trend signals in strong trends will whipsaw you. Decide the trend direction with something like an EMA, only take markers in that direction, and act only after the marker’s bar closes. Sticking to those three rules alone should cut down on getting chopped up quite a bit, and you’ll second-guess yourself less. Rather than an entry button, the box lines work best as a map of where the picture changes once price breaks out. That’s where this indicator really shines.