

What Is “Signal Forge”? A Build-Your-Own Indicator That Fuses 11 Filters Into One Signal
If you spend any time digging through TradingView’s indicator library, you’ve probably had this thought: “this thing is mediocre on its own, but stacked with something else it might actually work.” Moving averages plus RSI, then throw ADX on top. The idea is easy. Actually testing it is the boring part, where you pile five indicators onto one chart and count the agreements by eye.
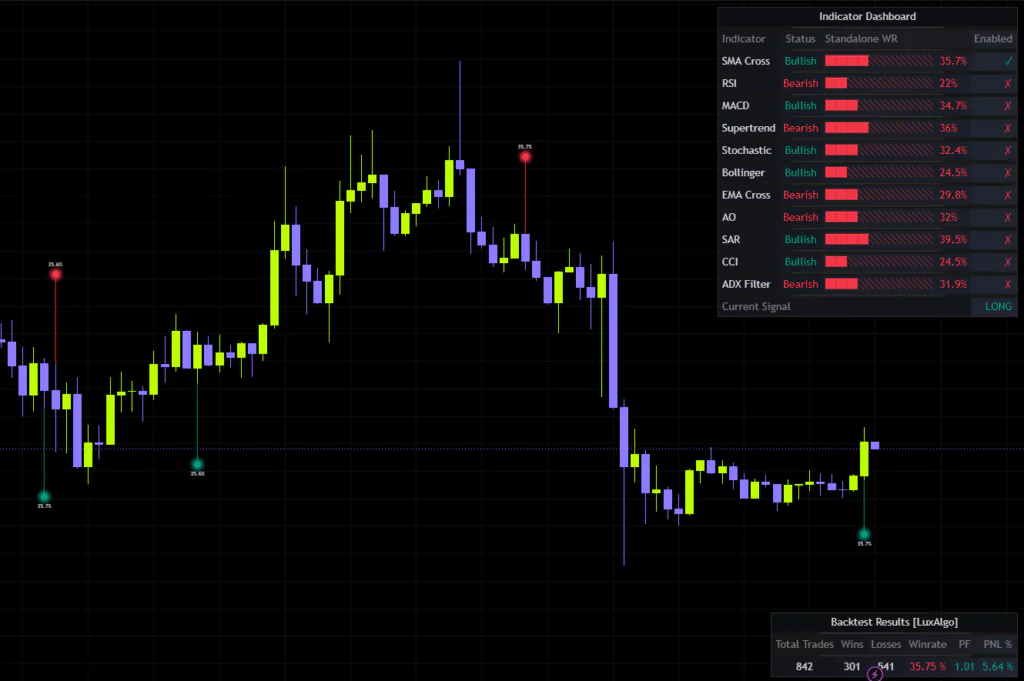
“Signal Forge” by LuxAlgo takes that entire grind and automates it. You tick the boxes for whichever of the 11 built-in technical filters you want, and it checks whether they agree and prints a buy or sell signal for you. On top of that, it shows you in real time what would have happened if you had mechanically traded those signals, in a table parked on the right side of the chart.
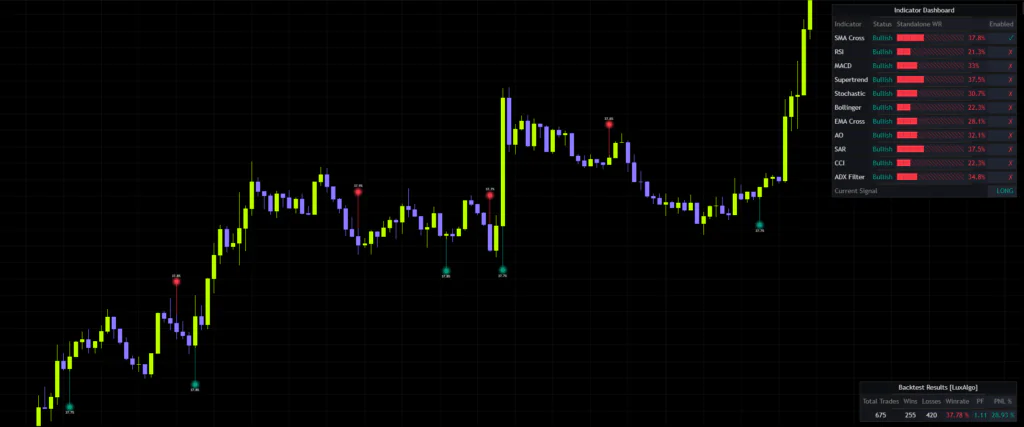
So “Signal Forge” is a signal generator and, at the same time, a test bench for finding out on the spot whether the indicator combo you just dreamed up actually holds up on the chart in front of you. Personally, I think the second use is where the real value sits.
“Signal Forge” does not introduce a new formula of its own. It gathers up the usual suspects like moving averages and RSI, then automates the confluence check and the performance tally. Frame it that way and everything else clicks into place fast.
The Four Things You’ll See on the Chart
“Signal Forge” plots directly over the candles, with no separate pane underneath. There are four things worth looking at.
1. The Glowing Orbs (the signals themselves)
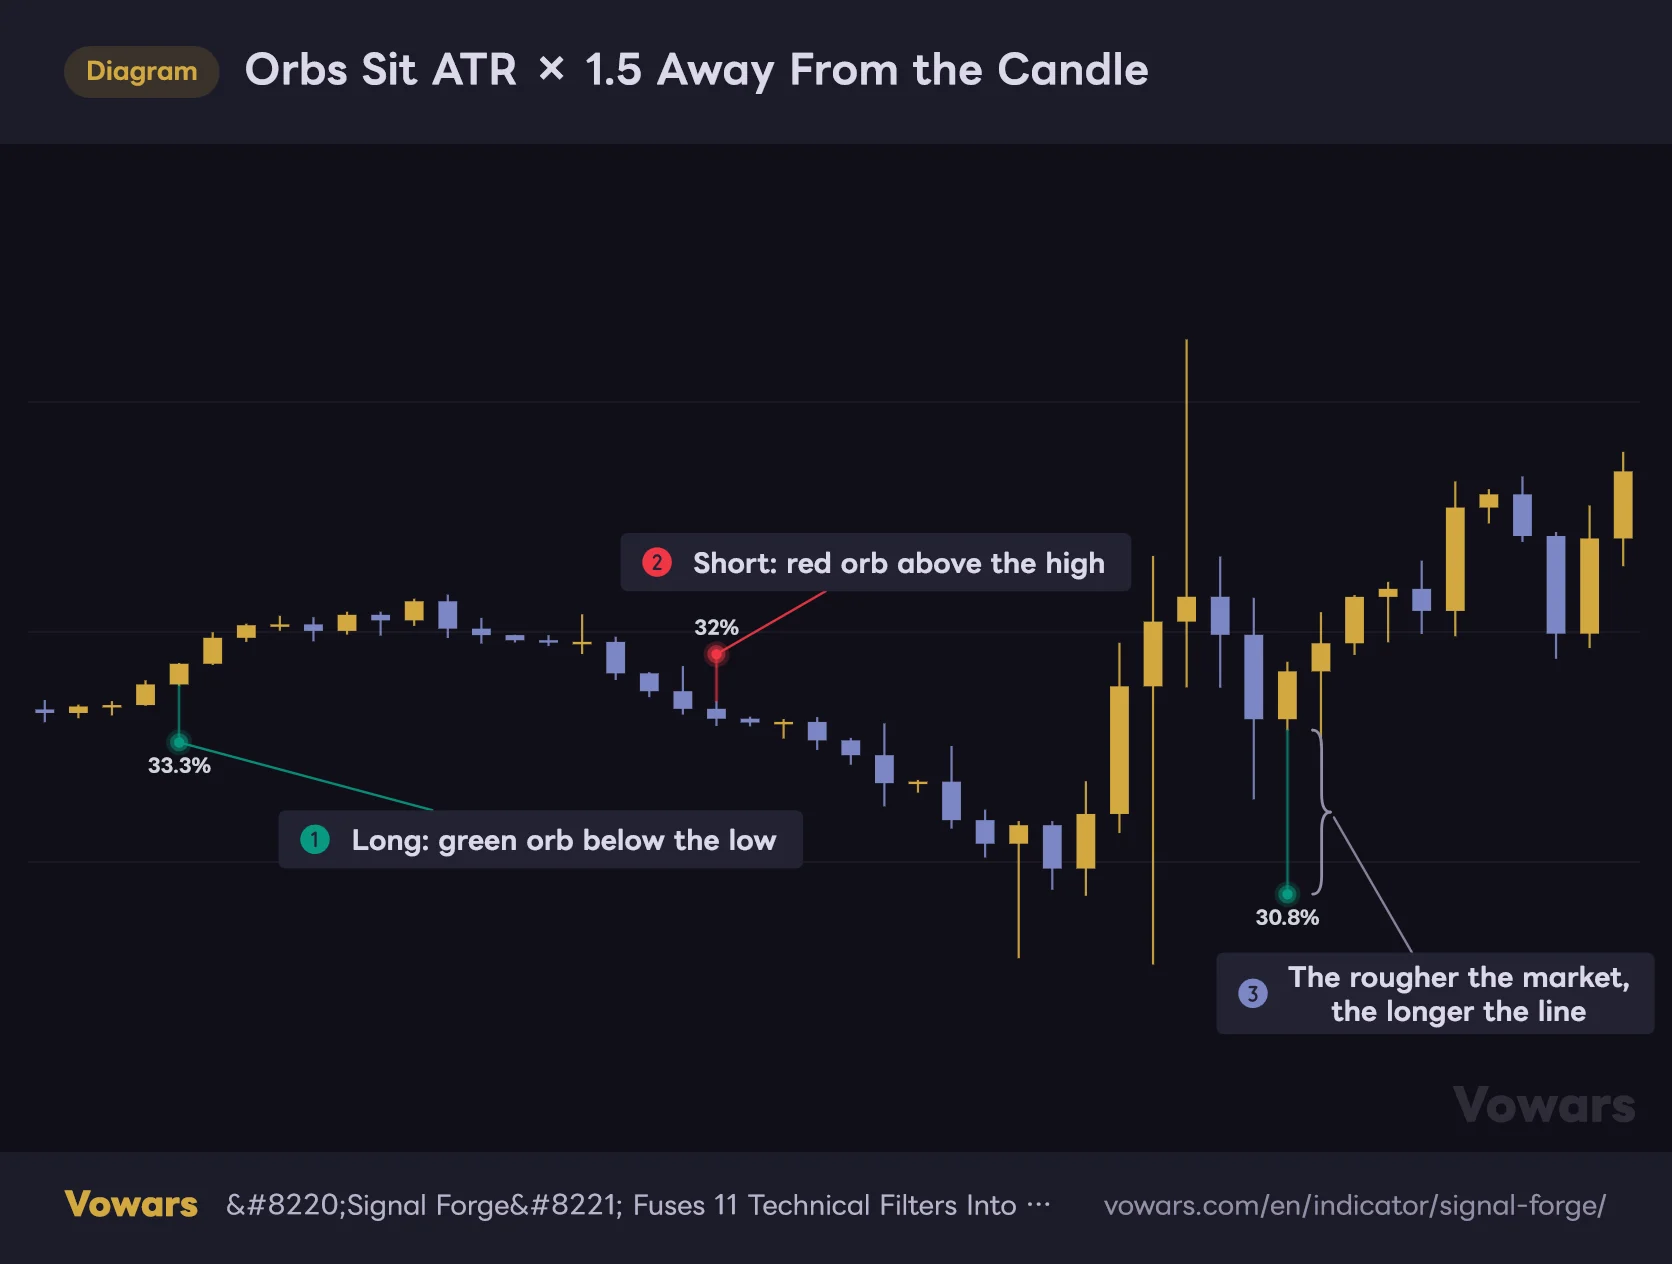
Orbs Sit ATR × 1.5 Away From the Candle
Longs go below the low, shorts above the high. The gap is ATR × 1.5, so the rougher the market, the further out the orb lands.
Vowars DE ver.3.11.0
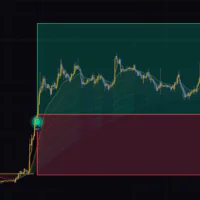
On a long signal you get a thin line dropping down from the candle’s low, with a green glowing orb at the end of it. Short signals do the reverse: a line running up from the high with a red orb on top. The orbs are drawn as three stacked circles, which is what gives them that soft glow, and because they sit off the candle body they never bury the price action.
How far the orb sits from price is tied to volatility at that moment. Wild conditions push it further away, quiet conditions pull it in close, so the placement of the orb itself tells you something about how hot the market is running.
2. The Win Rate Label
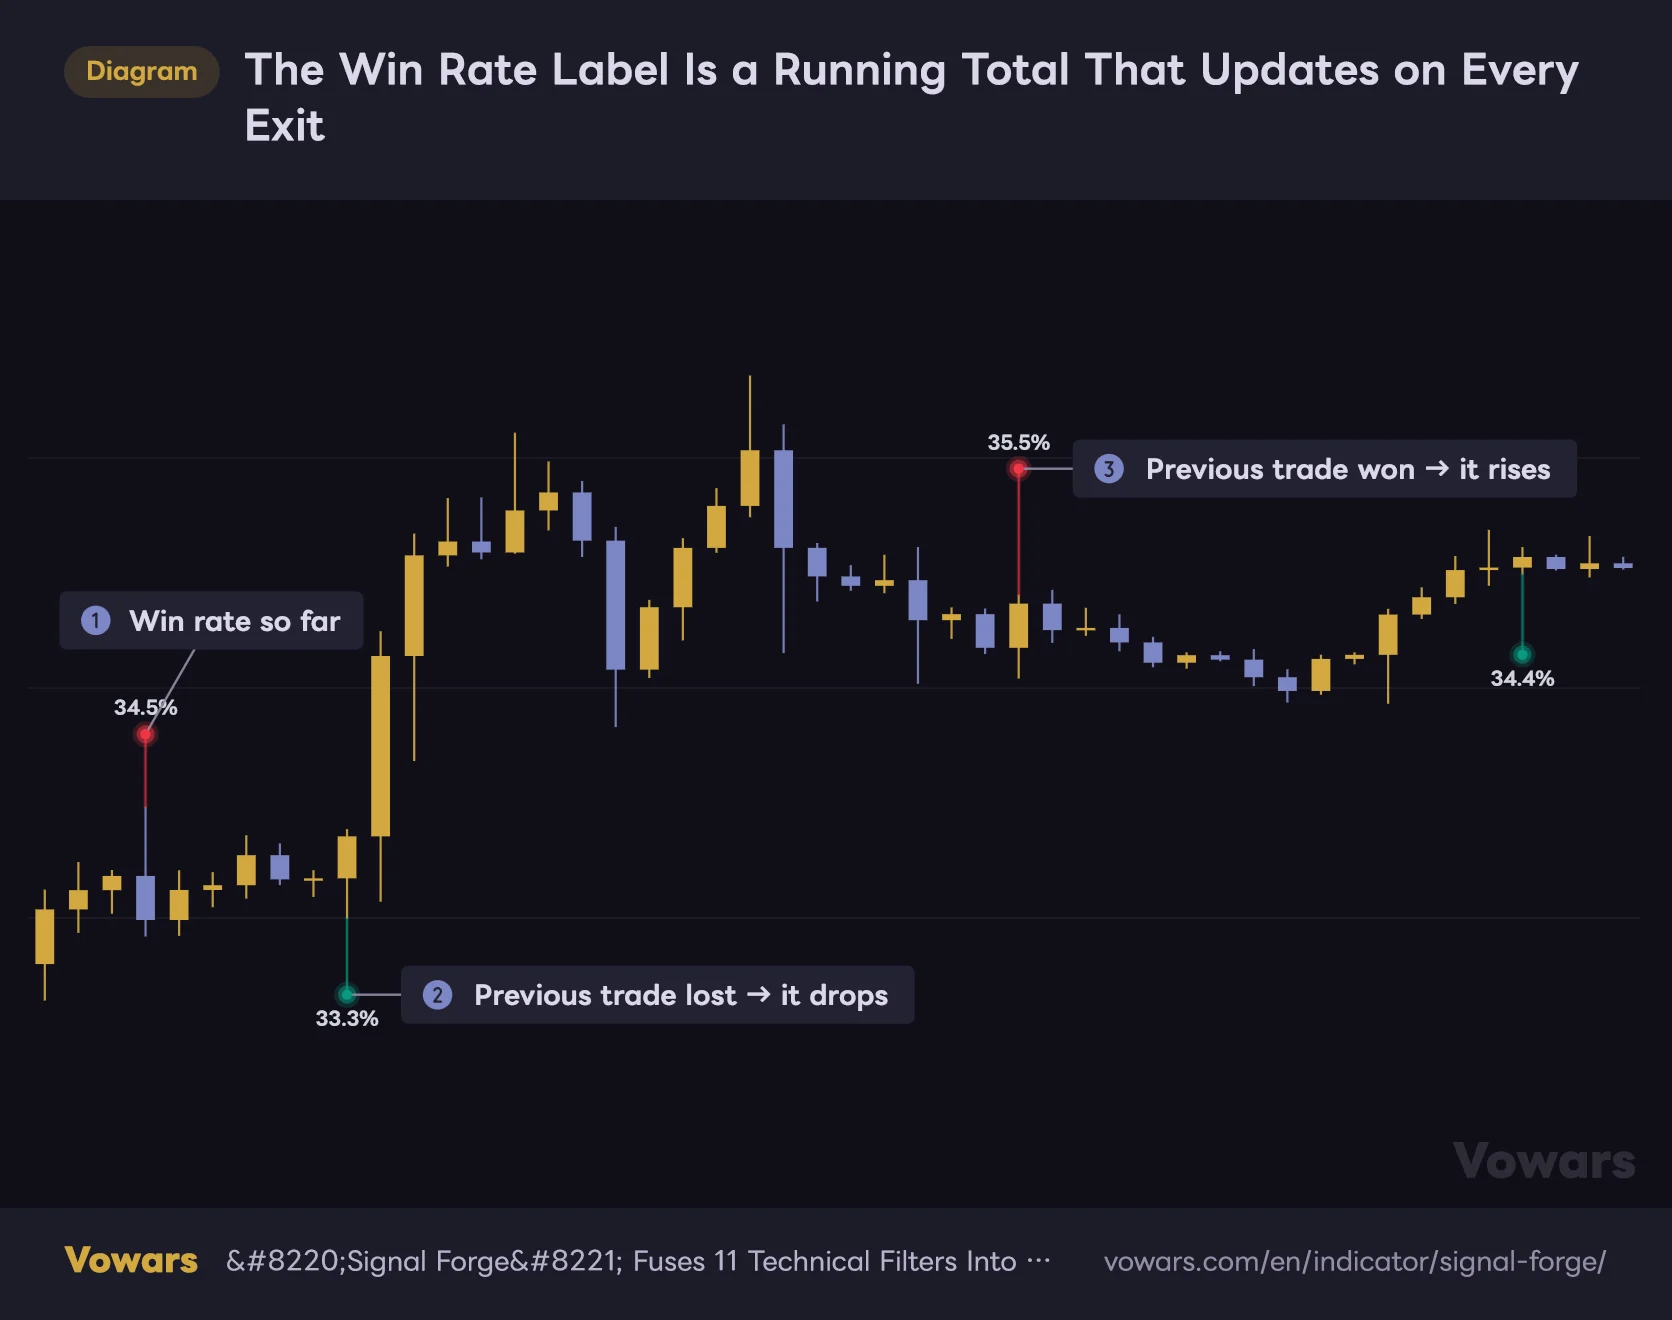
The Win Rate Label Is a Running Total That Updates on Every Exit
The number is not a forecast for that signal. It's the all-time record of every trade closed from the left edge of the chart up to that bar.
Vowars DE ver.3.11.0
Each orb carries a small number like “xx%”. This one gets misread a lot, so let’s clear it up early: it is not a probability estimate for that signal, it’s the running win rate of every trade generated from the left edge of the chart up to that bar. It updates with each new trade, so the further right you go, the more stable the number gets.
That number does not mean “this signal has a 60% chance of working”. It’s a cumulative figure measured from the left edge of the chart, so simply changing how far back you’re loading data changes it. It’s a record of the past, not a forecast. Keep that straight.
3. Exit Levels and the X Marks
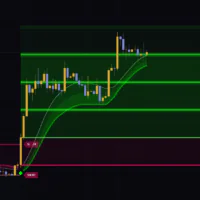
Turn on take profit, stop loss or the trailing stop and the matching level gets drawn on the chart, but only while a position is open. Stop loss is red, take profit green, and the trailing stop is a thicker blue line.
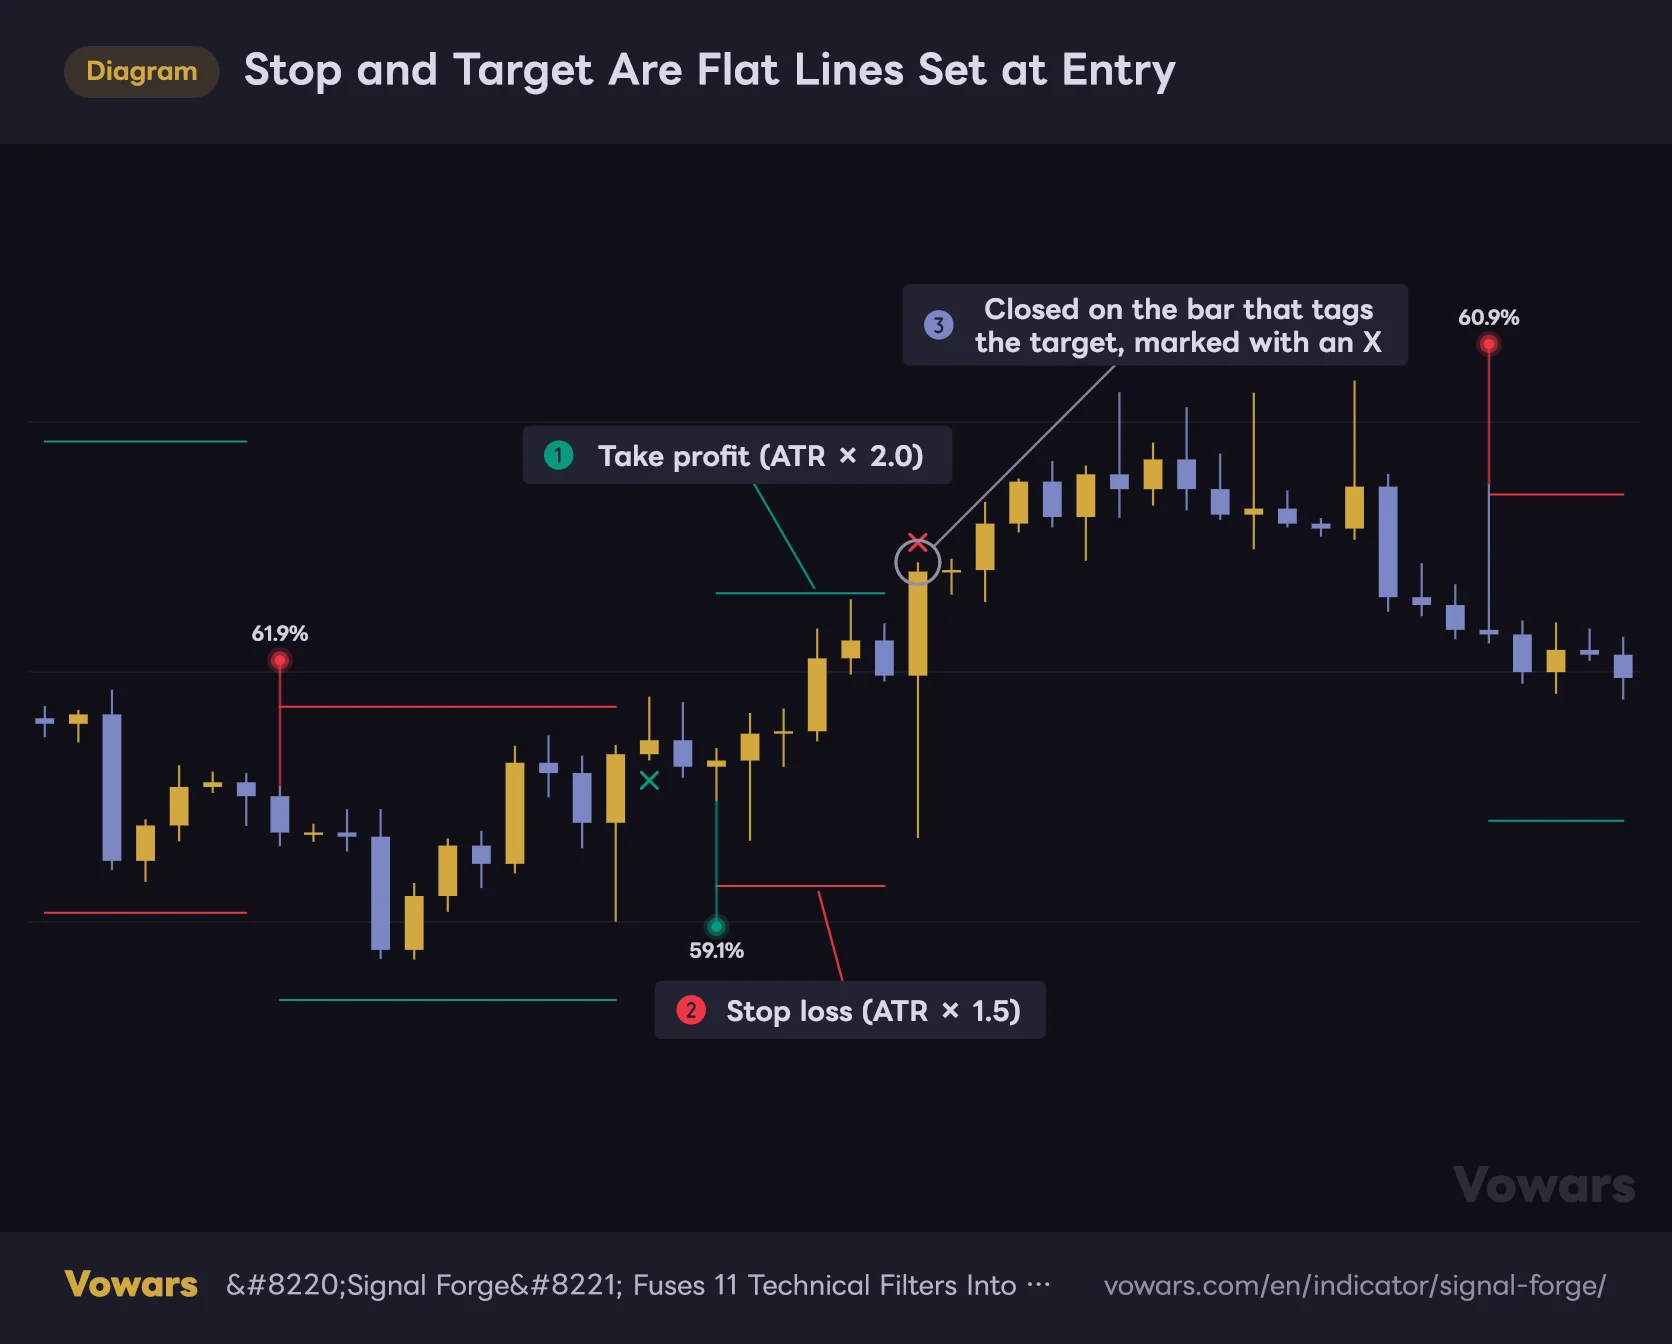
Stop and Target Are Flat Lines Set at Entry
With Stop Loss and Take Profit switched on, red and green horizontal lines appear, but only while a position is open.
Vowars DE ver.3.11.0
The stop and target lines are calculated once, from the signal bar’s close and ATR, and stay put until the trade closes. Each line is drawn as a segment joining the entry bar to the next bar, so you won’t see it on the bar the signal just printed on. It shows up once the next bar starts forming.
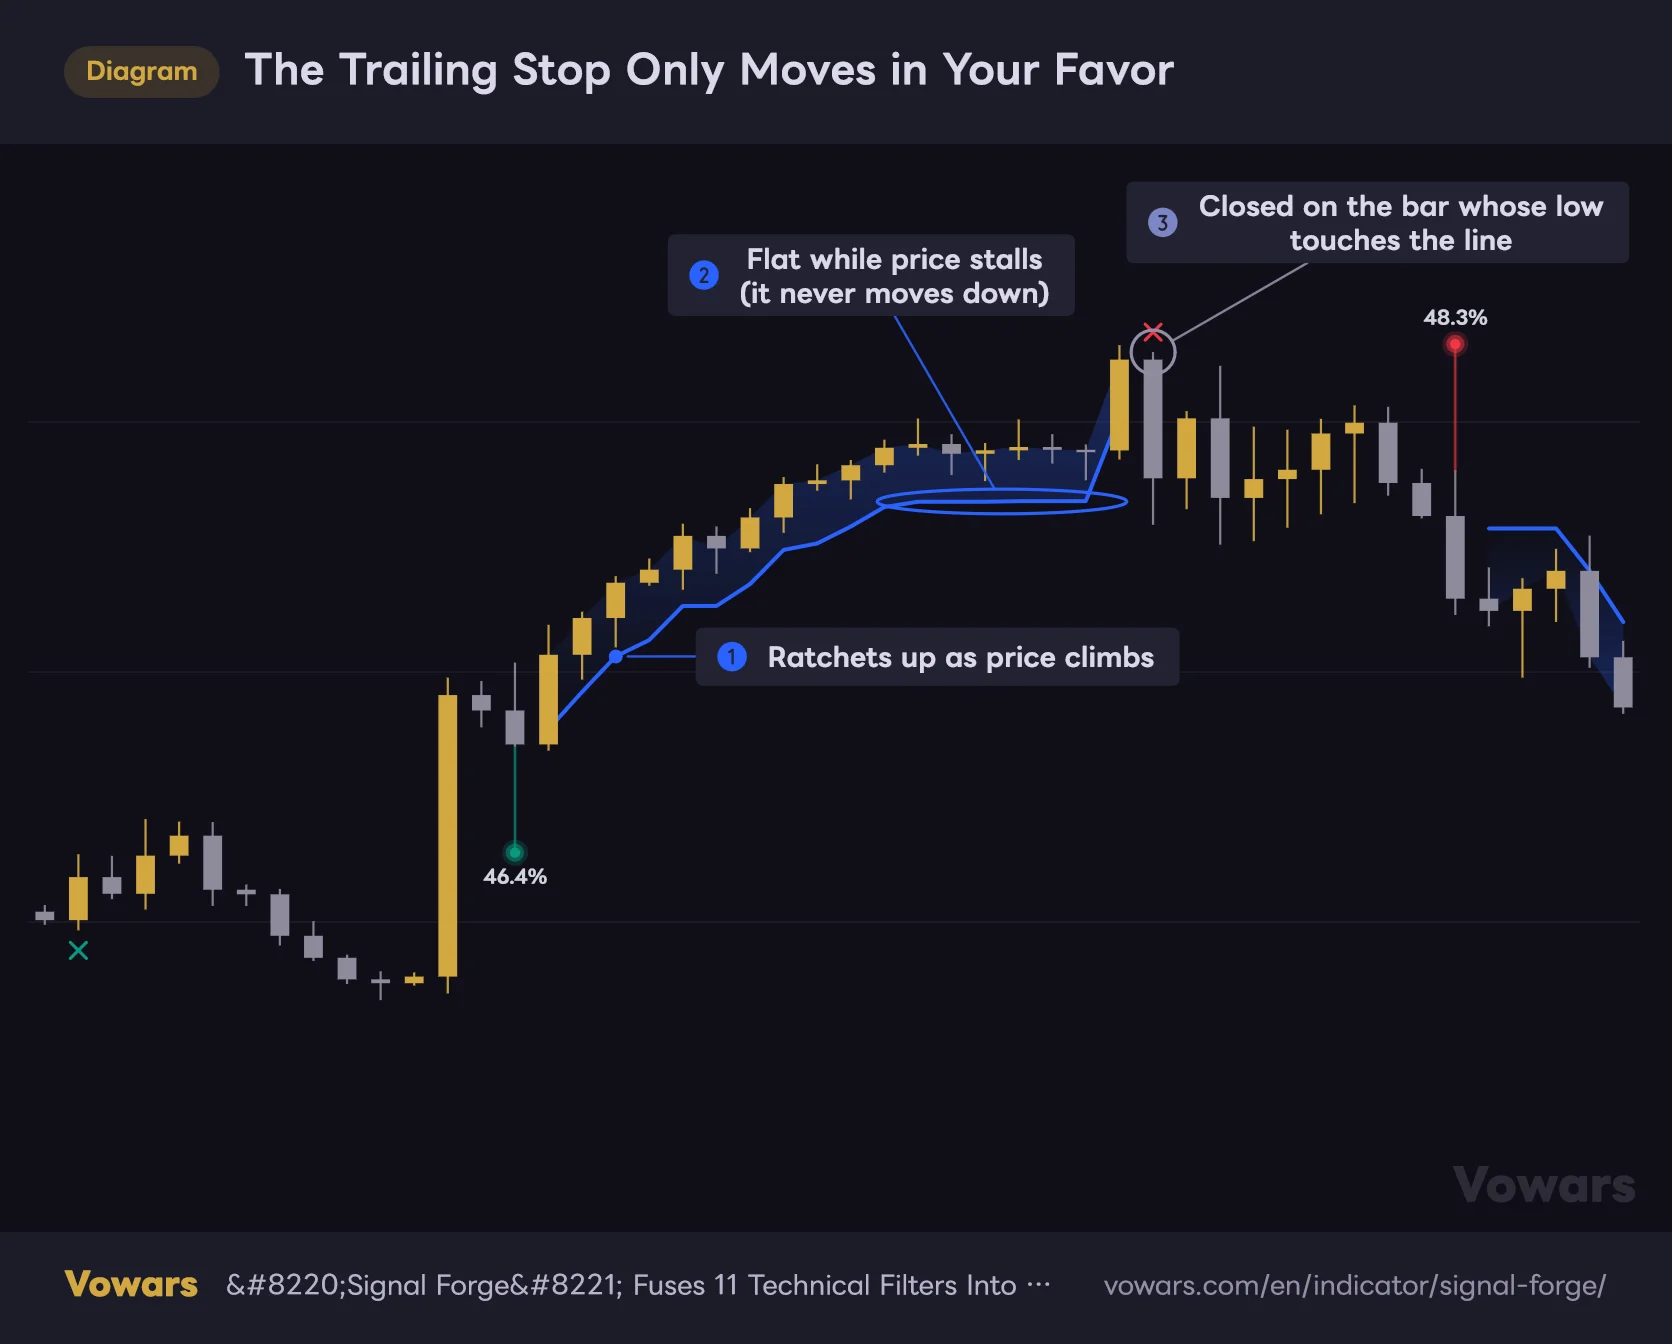
The trailing stop is the standout here, because the space between current price and the stop level is filled with a blue gradient, so you can feel how much room you have left at a glance. The fill is darkest at price and fades out toward the line. That’s a nice touch you don’t see very often.
The Trailing Stop Only Moves in Your Favor
Trailing Stop switched on. The blue line only ever moves up, and the room between it and price is shaded blue.
Vowars DE ver.3.11.0
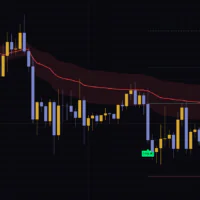
When a trade closes, an X mark is printed. There’s one exception: if the exit happens on the same bar as a signal in the opposite direction, the X is skipped and you only see the new orb. So if the direction flipped and there’s no exit mark, that was a stop-and-reverse.
4. The Two Dashboards
Most of the information density in “Signal Forge” comes from two separate tables.
Indicator Dashboard (default position: Top Right)
All 11 filters are listed vertically, each with four pieces of information.
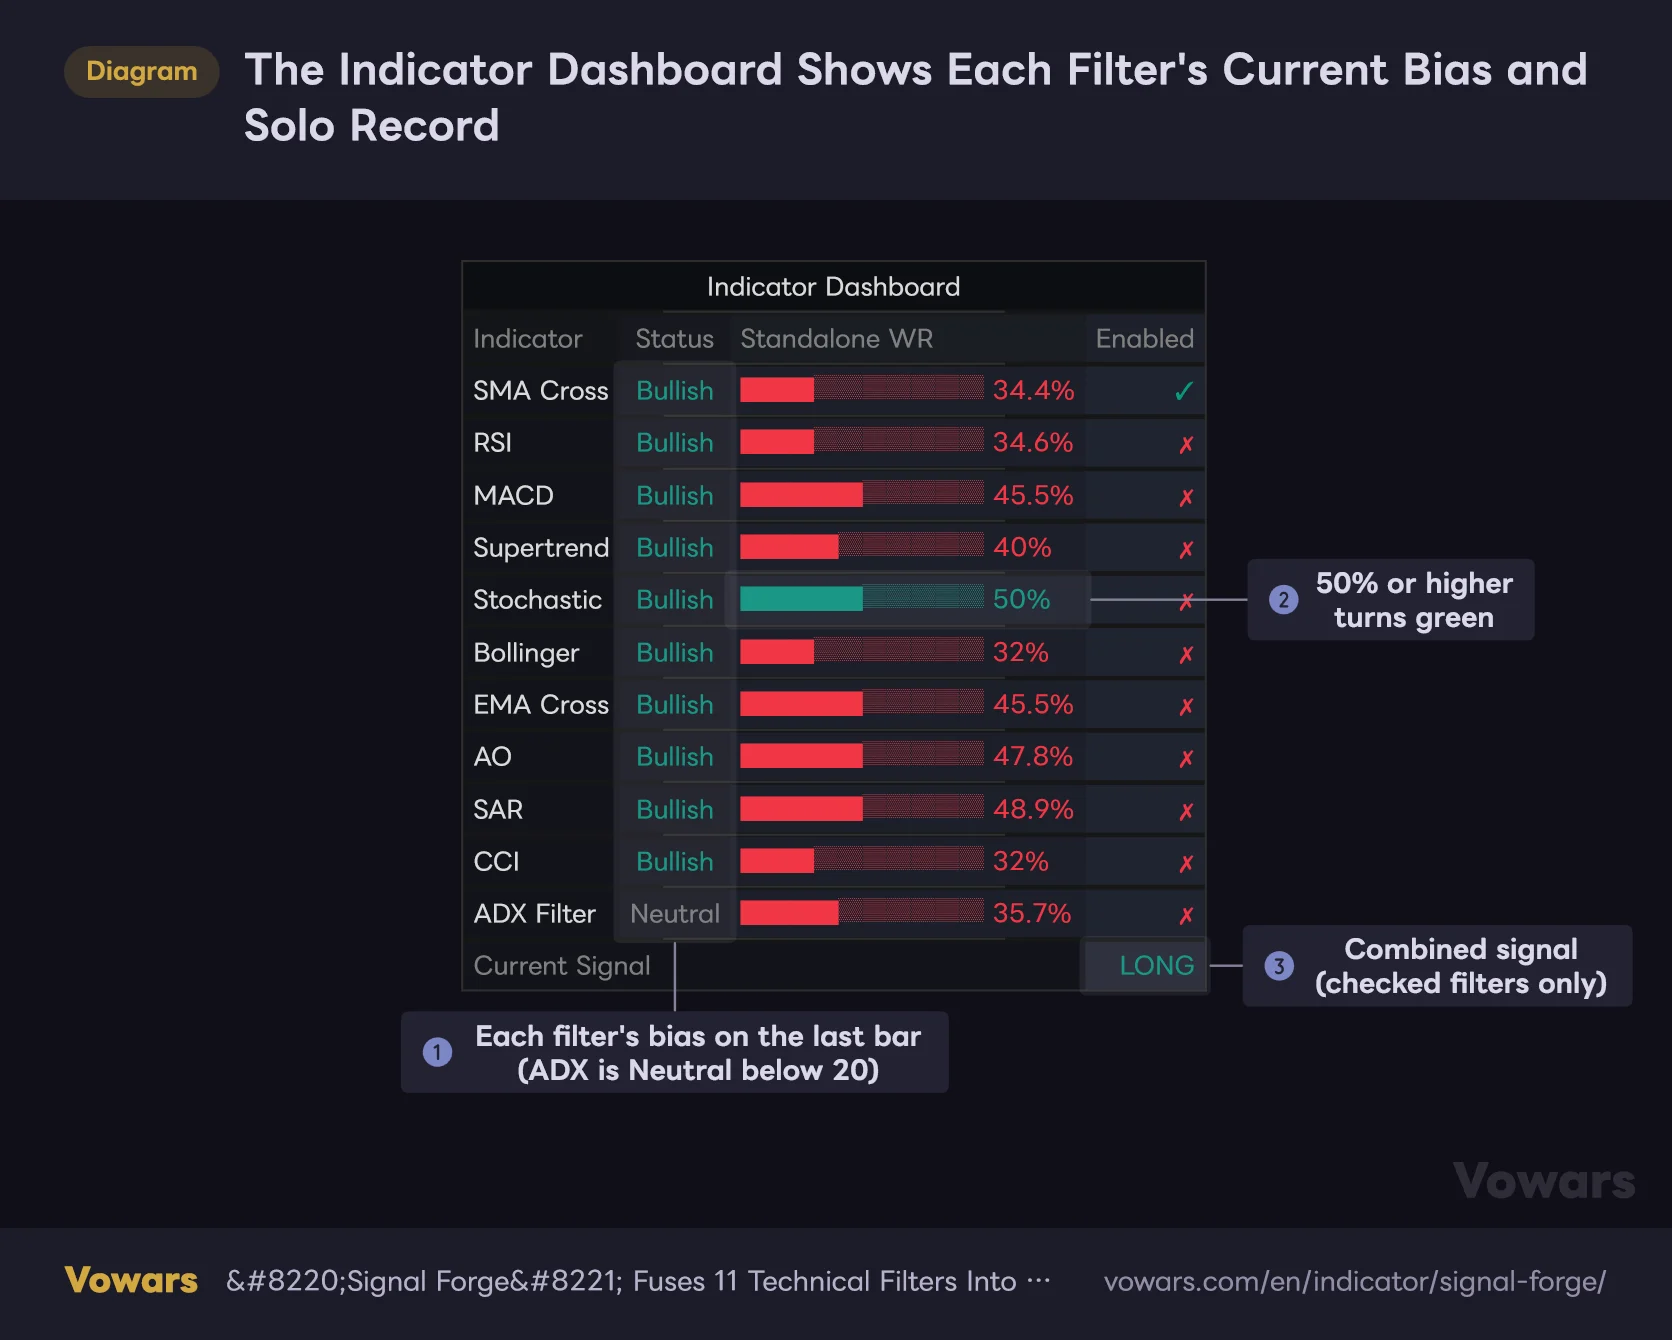
The Indicator Dashboard Shows Each Filter's Current Bias and Solo Record
Tallied the same way Signal Forge does it, on the last bar of the same market as the win rate label chart (default settings, SMA Crossover only).
Vowars DE ver.3.11.0
- Indicator – the name of the filter
- Status – its current read (Bullish / Bearish / Neutral)
- Standalone WR – the win rate that filter would have produced on its own, shown as a 10-block bar plus the number
- Enabled – a check mark showing whether it’s feeding into the combined signal
That Standalone WR column is the tastiest part of “Signal Forge”. Anything at 50% or above prints green, anything below prints red, so you can see instantly which filters suit the symbol and timeframe you’re currently looking at. Pick the ones with long green bars first and you’re already ahead.
Standalone WR is calculated for all 11 filters, including the ones you haven’t ticked under Enabled. If you’ve switched on stop loss or take profit, those same settings feed into the standalone numbers too.
Something I noticed once I had them side by side: Bollinger and CCI always show exactly the same number. They matched on my Bitcoin chart as well. The reason is simple. At default settings, CCI flips bullish or bearish purely on whether the close is above or below its 20-period average, which is the exact same test as comparing the close to the Bollinger Bands basis line (also a 20-period average). Turning both on in strict mode at default settings only adds one filter’s worth of strictness. If you want CCI to pull its own weight, move Long Above and Short Below so the two actually differ.
Performance Dashboard (default position: Bottom Right)
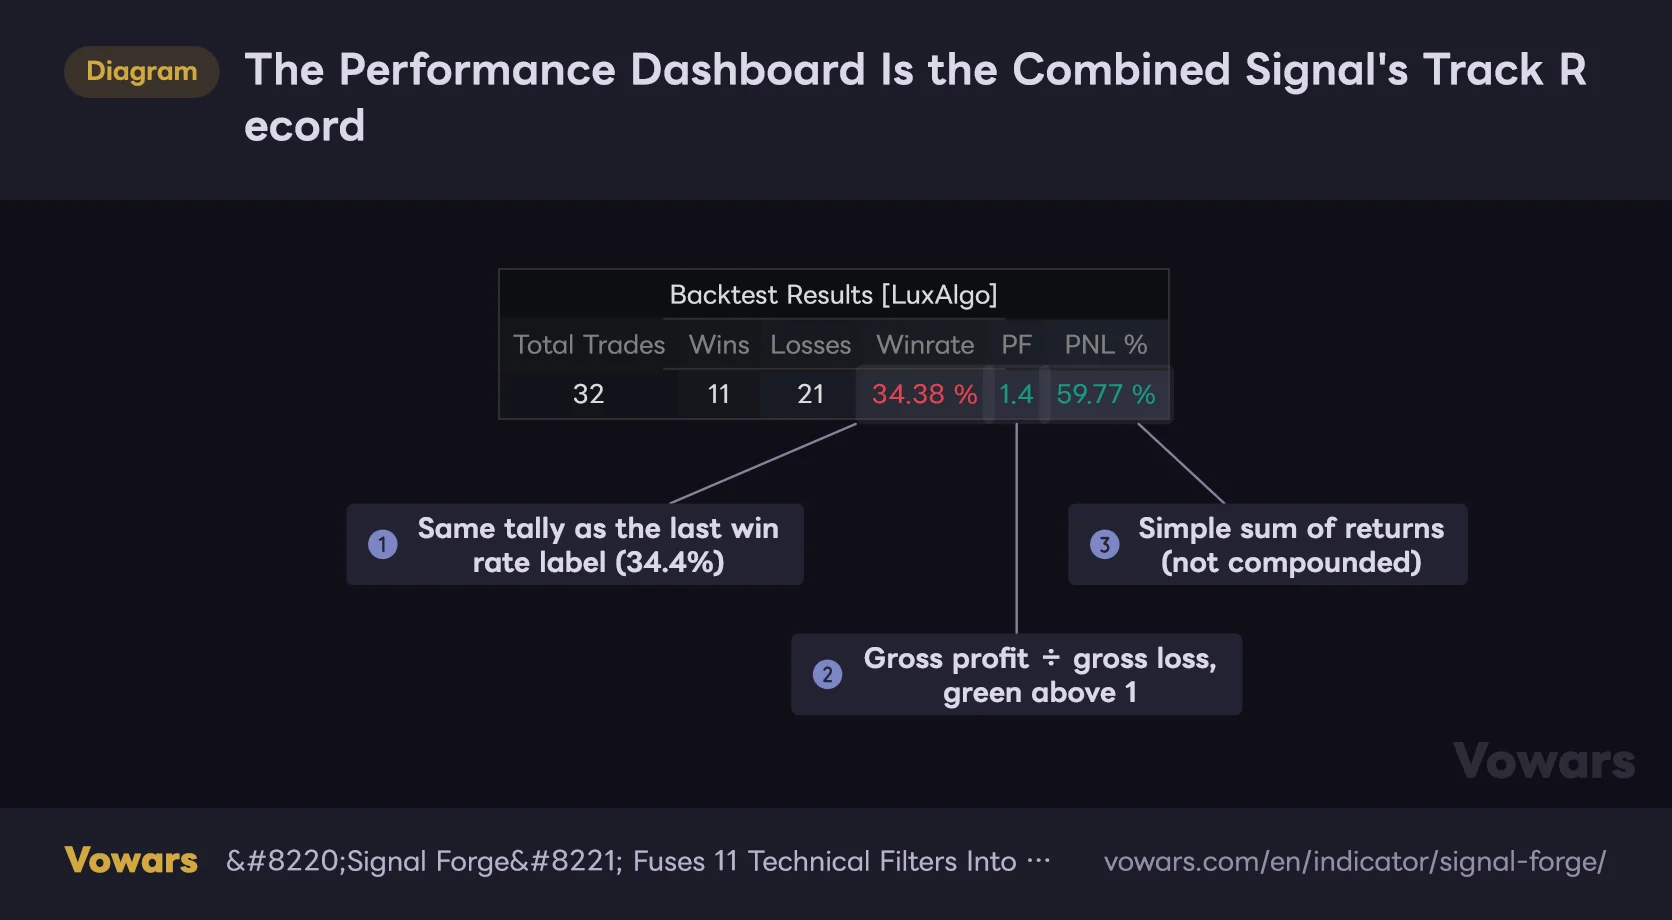
The Performance Dashboard Is the Combined Signal's Track Record
Performance Dashboard tallied on the last bar of the same market as the win rate label chart (default settings, exits on opposite signals only).
Vowars DE ver.3.11.0
This one covers the combined signal as a whole. Total Trades / Wins / Losses / Winrate / PF (profit factor) / PNL % sit in a single row. PF is gross profit divided by gross loss, green above 1 and red below. If there hasn’t been a single losing trade yet, it reads “MAX”.
The table redraws the moment you change a setting, so you immediately see things like “adding RSI bumped the win rate but gutted the trade count”. That fast feedback loop is, to me, the whole point of this tool.
How Signals Fire, and How Each of the 11 Filters Is Judged
Strict Mode vs Any Mode
The entire logic model comes down to one switch, Require All Enabled Indicators to Align, which is on by default.
| Mode | Setting | Behaviour | Best for |
|---|---|---|---|
| Strict (all agree) | On (default) | A signal fires only when every enabled filter points the same way | Cutting down fakeouts, raising signal quality |
| Any (one is enough) | Off | A signal fires as soon as any one enabled filter agrees | More entries, faster reaction |
Once you actually run both, they feel like two completely different tools. Run strict with five or six filters enabled and a 4H Bitcoin chart might only give you a handful of signals across the whole visible range. Any mode has the opposite problem: long and short conditions can both be true at the same time, so when one filter is bullish and another is bearish you end up in stretches where nothing enters and the script just keeps closing trades.
In any mode, the long and short conditions can be satisfied simultaneously, and when that happens the dashboard shows the long side. Trade count balloons while the numbers fall apart, so I mostly leave strict on and dial the strictness with the number of filters instead. The results are far easier to read that way.
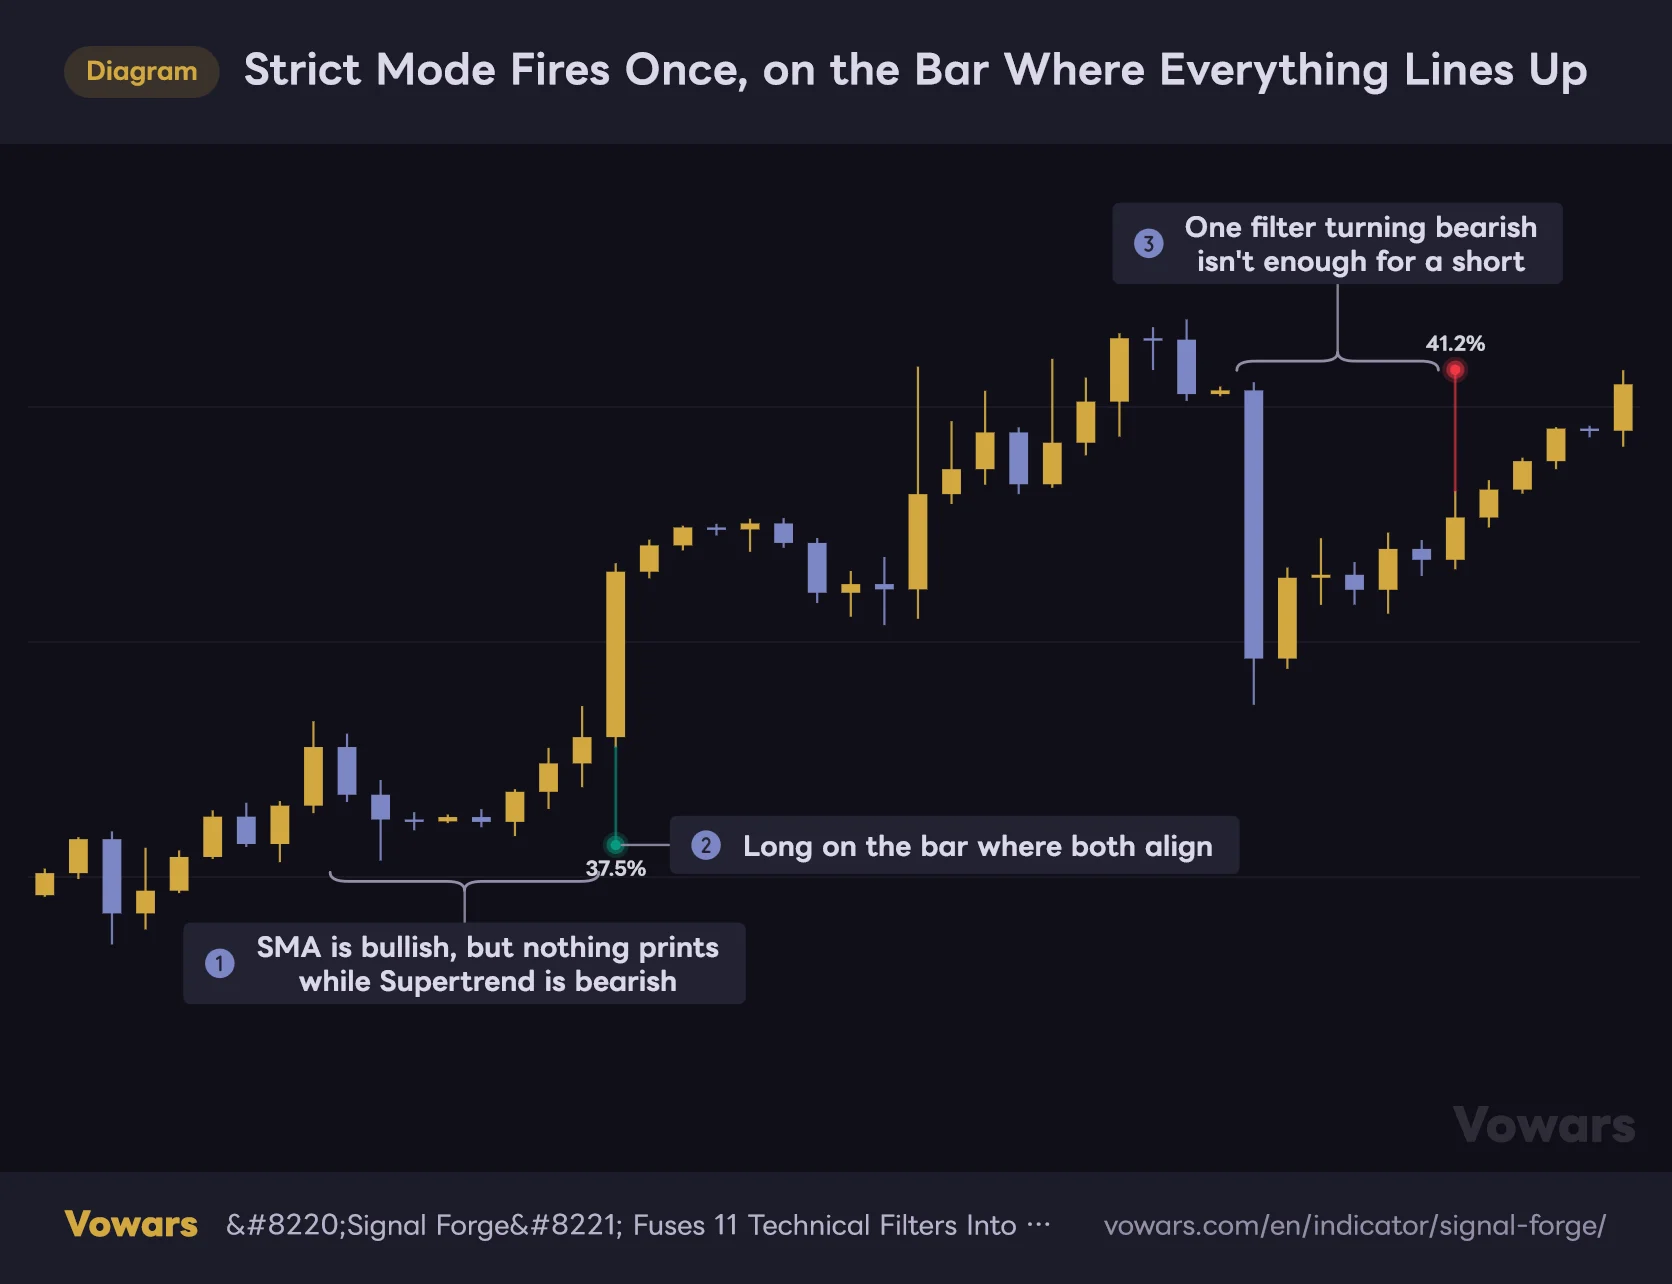
One more thing worth knowing: a signal fires once, at the exact moment the condition flips from false to true. While the condition stays true, no further signals print. That’s why a strong one-way run doesn’t bury the chart in orbs and the screen stays clean.
The chart below is strict mode with SMA Crossover and Supertrend both enabled. Nothing happens while only one of them is bullish, and the orb only prints on the bar where both finally point the same way.
Strict Mode Fires Once, on the Bar Where Everything Lines Up
Here SMA Crossover and Supertrend are both enabled. While only one of them is bullish, nothing prints.
Vowars DE ver.3.11.0
How the 11 Filters Are Actually Read
This is the single most important thing to understand before you use “Signal Forge”. Even the filters that are normally mean-reversion tools have been reworked into trend confirmation. If you’re used to reading Stochastic for overbought and oversold extremes, this will feel off at first.
| Filter | Counts as Bullish when | Counts as Bearish when |
|---|---|---|
| SMA Crossover | The fast SMA is above the slow SMA | The fast SMA is below the slow SMA |
| RSI Filter | RSI is above the chosen level | RSI is below the chosen level |
| MACD Crossover | The MACD line is above the signal line | The MACD line is below the signal line |
| Supertrend | Supertrend is pointing up | Supertrend is pointing down |
| Stochastic | %K is above 50 (upper half of its range) | %K is below 50 |
| Bollinger Bands | Close is above the basis line | Close is below the basis line |
| EMA Crossover | The fast EMA is above the slow EMA | The fast EMA is below the slow EMA |
| Awesome Oscillator | AO is above zero | AO is below zero |
| Parabolic SAR | Close is above SAR | Close is below SAR |
| CCI Filter | CCI is above the chosen level | CCI is below the chosen level |
| ADX Filter | ADX is above the threshold and +DI is above -DI | ADX is above the threshold and -DI is above +DI |
Pay attention to how Stochastic and Bollinger Bands are handled. Stochastic isn’t buying below 20, it only asks whether %K is above or below 50. Bollinger Bands isn’t looking for band touches either, it checks where the close sits relative to the basis line (the 20-period average). Forcing the mean-reversion tools onto a trend-following footing is exactly what lets them sit alongside moving averages and Supertrend without contradicting each other. Miss that design choice and you’ll walk away thinking “that’s not how you use Stochastic,” so it’s worth locking in.
And then ADX Filter is the odd one out. Until ADX clears the threshold it reads neither bullish nor bearish, it just sits at Neutral. Which means enabling ADX in strict mode shuts off signals entirely whenever trend strength is weak. As a chop killer that’s genuinely strong, and it pairs well with something like Bitcoin that alternates between dead ranges and violent expansions.
How to Use “Signal Forge” (from install to testing)
1Add it and look at the default state
Pull up “Signal Forge” from TradingView’s indicator search and add it. Out of the box, the only thing enabled is Enable SMA Crossover, and every risk management option is off. So what you’re looking at first is nothing more than a system that flips long and short on a 10/20 simple moving average cross. Check that baseline in the Performance Dashboard first, then use it as your reference point.
2Hunt for good filters in the Indicator Dashboard
This is the fun part. Standalone WR is calculated even for filters you haven’t enabled, so you can see which ones are working on this symbol and timeframe before you commit to them. Shortlist the ones with long green bars.
3Add filters one at a time and watch the numbers move
Don’t flip five switches at once. The trick is adding one filter and checking exactly how the Performance Dashboard reacted. A higher win rate means nothing if Total Trades collapsed at the same time, because all you may have left is a handful of lucky trades. Once the trade count drops under 20 to 30, I treat the numbers as a rough hint and nothing more.
4Switch on risk management to make it realistic
The default state has no stop and no target, it just reverses forever, which is nothing like how anyone actually trades. Turning on Stop Loss alone often changes the numbers dramatically. If the results fall apart the moment you add a stop, that combination probably isn’t fit for live use.
5Re-check across timeframes and symbols
Good numbers on one timeframe could easily be luck. Cycle through 1H, 4H and daily and look for a combination that doesn’t fall apart anywhere, and you’ll get far more reliable results live. Take the setup you built on Bitcoin and drop it on gold or an index ETF, and you’ll also find out whether it was symbol-specific all along.
Settings and Recommended Values
Logic, Risk Management and Visuals
| Setting | Default | Suggested | Effect |
|---|---|---|---|
| Require All Enabled Indicators to Align | On | On | Demands full agreement. Switching it off allows long and short conditions to be true at once, so it’s easier to read your results if you leave it on and adjust strictness through the number of filters instead |
| ATR Length | 14 | 14 (around 10 on lower timeframes) | The period behind stop distance, target distance and orb offset alike. Shorter values track recent volatility more closely and pull exit levels in toward price |
| Take Profit | Off | On while testing | Sets the target as an ATR multiple. Left off, the model holds until an opposite signal appears |
| Multiplier (Take Profit) | 2.0 | 2.0-3.0 | Larger values push the target further out, lowering win rate but raising average profit per trade. Go wide if you’re trying to ride trends |
| Stop Loss | Off | On | Results with no stop bear little resemblance to live trading, so enable it from the testing stage onward |
| Multiplier (Stop Loss) | 1.5 | 1.5-2.5 | Smaller values sit the stop closer and get picked off by noise. On volatile symbols, widening it past the default usually works better |
| Trailing Stop | Off | On for trend trades | The stop follows price as it moves in your favour and never backs up. Good for locking in gains |
| Multiplier (Trailing Stop) | 1.0 | 1.0-2.0 | Smaller values bank profit quickly but get shaken out on pullbacks. Widen it if you want to let winners run |
| Orb Distance (ATR) | 1.5 | 1.0-1.5 | How far the signal orb sits from the candle. Lower values make it easier to tell which bar fired |
| Orb Base Size | 10 | 6-8 | Orb size and glow intensity, range 3 to 20. Bigger stands out more but starts covering price action |
| Dashboards | On | On | Toggles both tables. Only worth switching off when you need the full chart width |
| Indicator Dashboard Position | Top Right | Top Right | Where the filter table sits. Top right, bottom right or bottom left |
| Performance Dashboard Position | Bottom Right | Bottom Left | Where the results table sits. The filter table runs long vertically, so parking them apart avoids overlap |
| Size | Normal | Small (laptop screens) | Table text size. Tiny / Small / Normal / Large / Huge |
The dashboards can only go in three spots – top right, bottom right or bottom left. Top left isn’t an option. The filter table runs 11 rows deep, so stacking both on the same side means they overlap. Sending one of them to Bottom Left is the safe play.
Settings for Each of the 11 Filters
| Setting | Default | Suggested | Effect |
|---|---|---|---|
| Enable SMA Crossover / Fast Length / Slow Length | On / 10 / 20 | On / 20 / 50 | The defaults react fast and cross constantly, so widening the periods on daily and above makes the bigger move easier to hold |
| Enable RSI Filter / RSI Length / Long Above / Short Below | Off / 14 / 50 / 50 | On / 14 / 55 / 45 | By default it’s a simple above-or-below-50 read. Splitting the levels creates a neutral zone that screens out directionless stretches |
| Enable MACD Crossover / Fast / Slow / Signal Length | Off / 12 / 26 / 9 | Leave at default | The universal standard settings. Little reason to change them, if only so you’re seeing what everyone else sees |
| Enable Supertrend / Factor / Length | Off / 3.0 / 10 | On / 3.0 / 10 | Works cleanly as a directional read. Lowering Factor flips it sooner but brings more fakeouts with it |
| Enable Stochastic / K Length / D Length / Smooth | Off / 14 / 3 / 3 | Leave at default | The read is purely whether %K is above or below 50. %D is used for neither display nor judgement, so changing D Length won’t move the signals |
| Enable BB Trend / Length / Multiplier | Off / 20 / 2.0 | Leave at default | The read is only where the close sits versus the basis line, so changing Multiplier won’t change the outcome |
| Enable EMA Crossover / Fast Length / Slow Length | Off / 10 / 20 | Don’t pair it with SMA | At the same periods it points almost exactly where the SMA points, so enabling both adds very little strictness |
| Enable AO | Off | Situational | No settings at all. Reads momentum from the 5 versus 34 period spread, which is a slightly longer-horizon view |
| Enable Parabolic SAR / Start / Increment / Max Value | Off / 0.02 / 0.02 / 0.2 | Leave at default | Standard settings. Raising Increment makes it track faster and flip constantly in sideways conditions |
| Enable CCI Filter / Length / Long Above / Short Below | Off / 20 / 0 / 0 | On / 20 / 100 / -100 | At the default zero line it reads exactly like Bollinger Bands. Moving to plus and minus 100 keeps only the moments with real momentum behind them |
| Enable ADX Filter / ADX Smoothing / DI Length / ADX Threshold | Off / 14 / 14 / 20 | On / 14 / 14 / 20-25 | The only filter that can remove weak-trend conditions wholesale. Raising the threshold cuts signal count and lifts quality |
Bollinger’s Multiplier and Stochastic’s D Length won’t change when signals fire, no matter what you set them to. Both reads only ever look at the basis line and %K. Knowing that up front saves you from sitting there wondering why nothing happened after you changed a setting.
Setups by Objective
| Goal | How to set it up | What you’re after |
|---|---|---|
| Keeping enough day trade setups | Strict + SMA and MACD only / modest ATR multipliers | Staying selective without killing signal count |
| Fewer fakeouts on swing trades | Strict + SMA, Supertrend and ADX / wider SL | Trading only when a trend is genuinely running |
| More sensitivity | Cut down to two filters / shorten the SMA periods | Reacting earlier to catch the initial move |
| Less noise | Push ADX Threshold toward 25 / add an RSI neutral zone | Cutting out directionless conditions entirely |
Where It Shines and Where It Struggles
Run it across Bitcoin timeframes for a while and the personality is obvious. Most of the 11 filters are trend-following, so it behaves well when a trend keeps going. Orb fires at the start of the move, the position doesn’t get shaken out on the pullbacks, and the thing just runs. I saw that clean pattern repeat plenty of times.
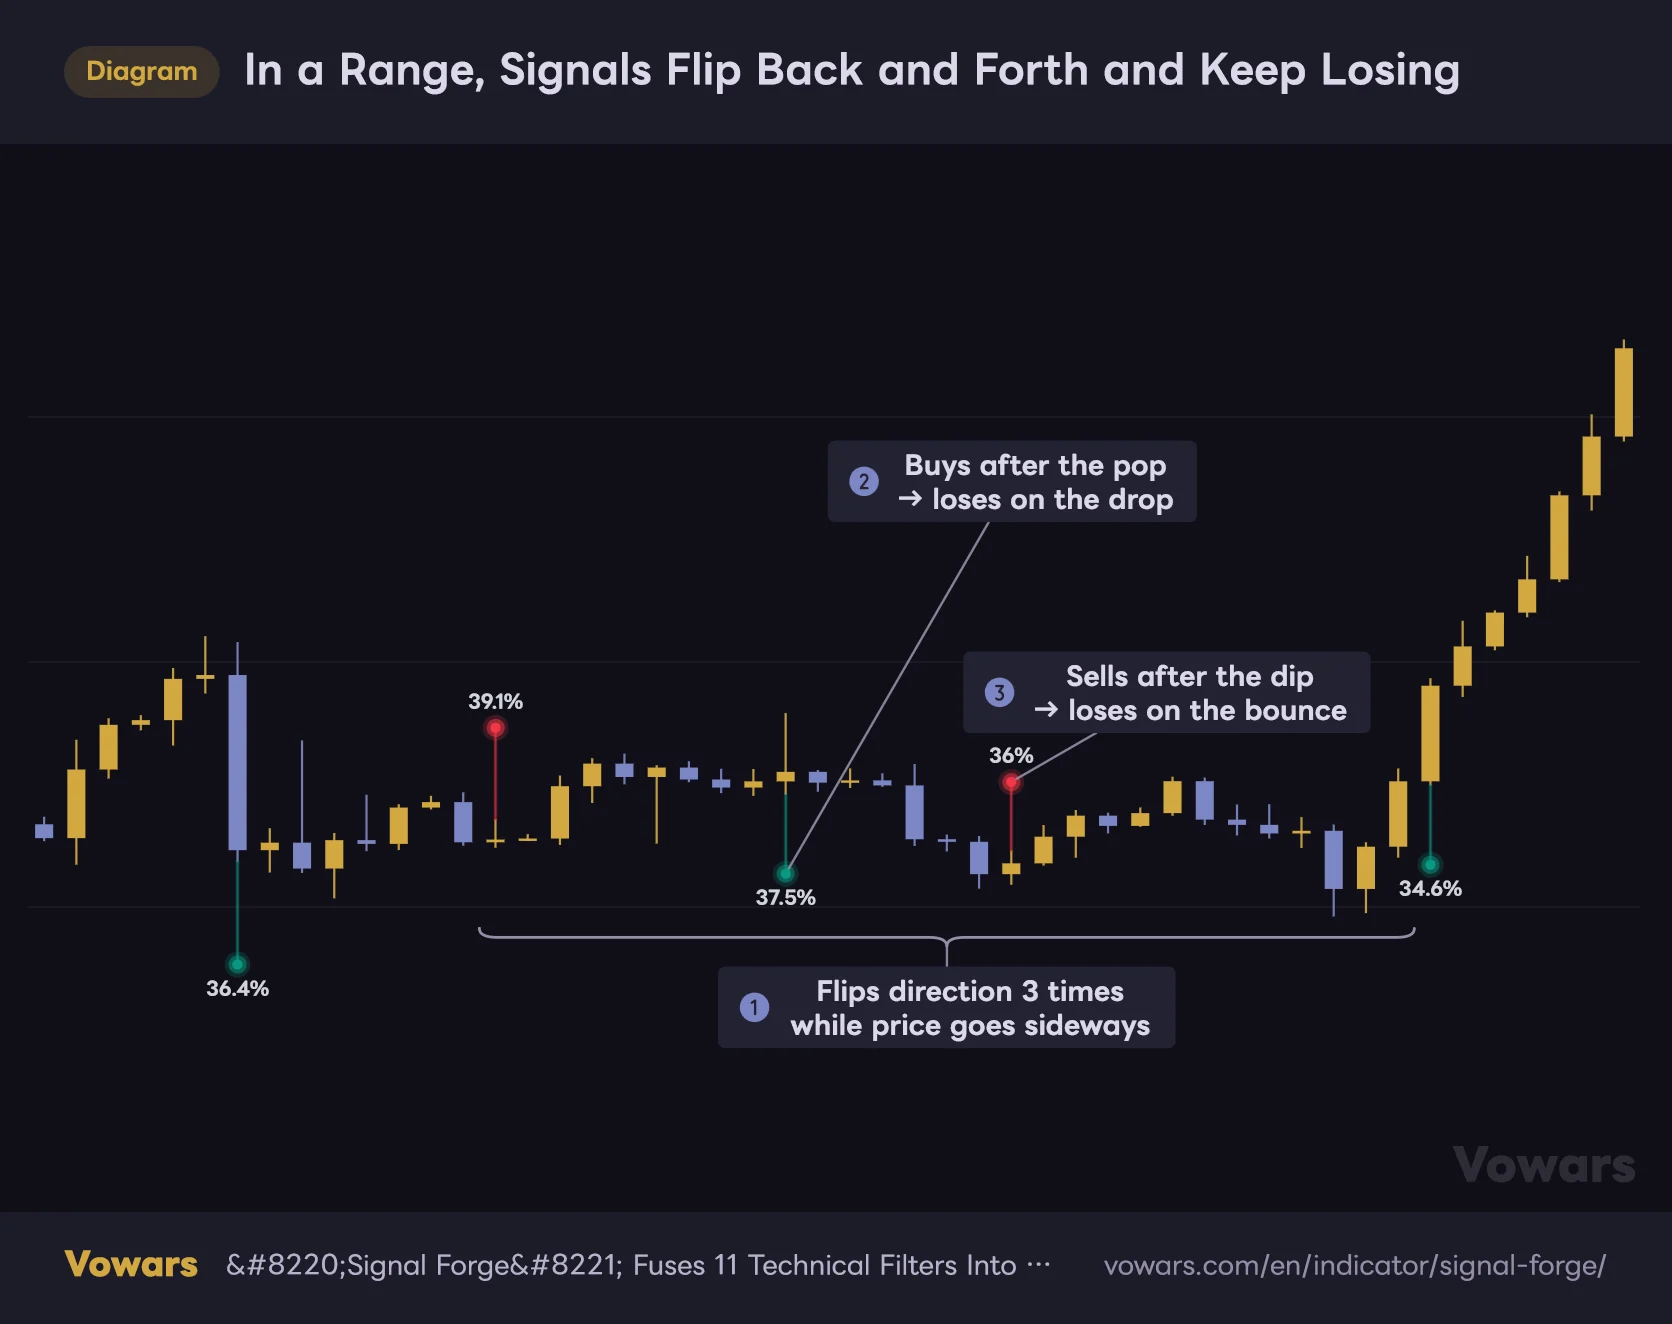
In a Range, Signals Flip Back and Forth and Keep Losing
Default settings (SMA Crossover only) on a market where the trend has stalled into a sideways range.
Vowars DE ver.3.11.0
On the other hand, as the chart above shows, it’s pretty weak against tight, back-and-forth ranges. Any mode, or strict with only one or two filters, can line up the worst possible pattern: long at the top of the range, short at the bottom. The ADX Filter mentioned earlier is what rescues this, and on symbols that spend a lot of time chopping I turn it on from the start.
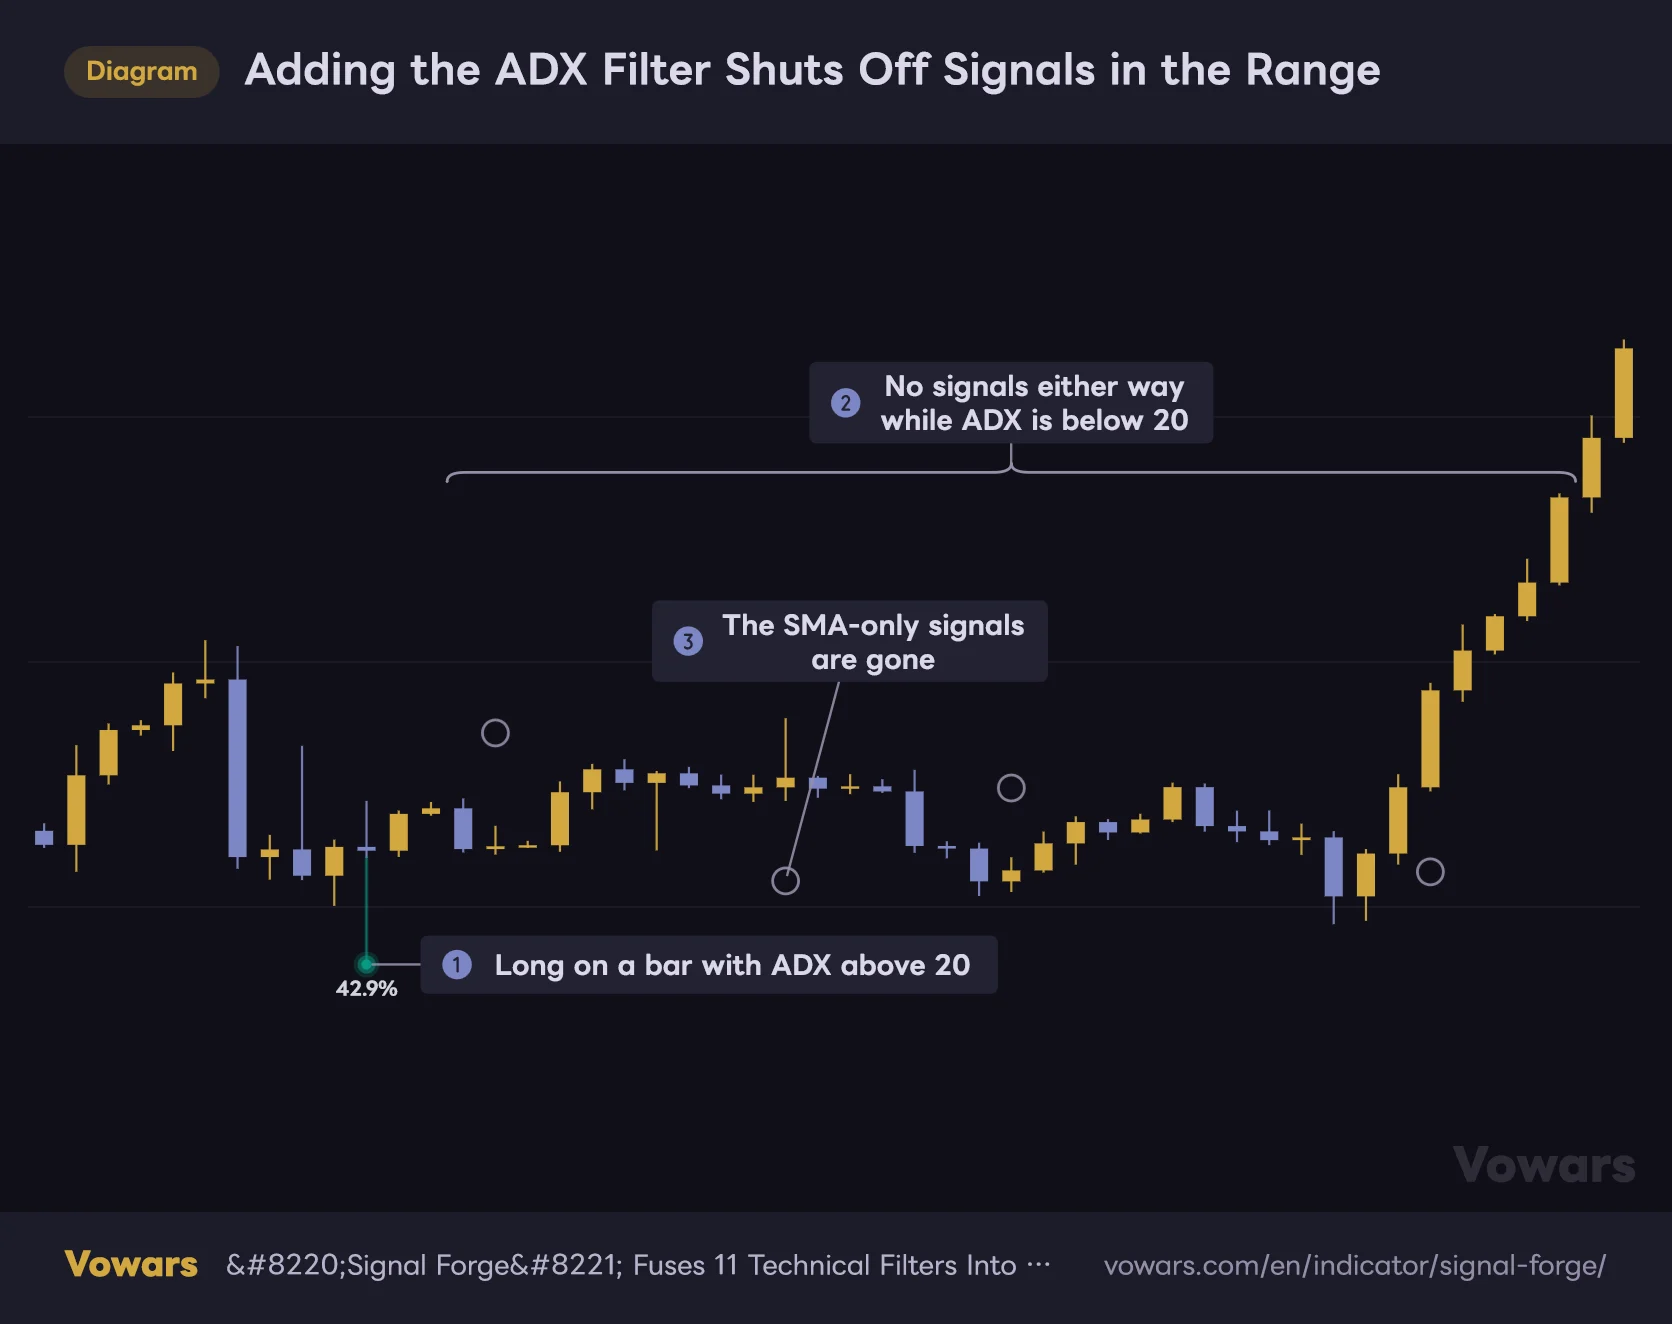
Adding the ADX Filter Shuts Off Signals in the Range
Same market as the previous chart, now with ADX Filter added to SMA Crossover.
Vowars DE ver.3.11.0
Add the ADX Filter on the same market and the signals in the sideways stretch vanish in one go, because while ADX sits below the 20 threshold nothing reads as bullish or bearish. One thing worth knowing: since no opposite signal can fire while ADX is weak, whatever position you held going in gets carried through without being closed. In the performance tally, that counts as holding the whole way through the range. Pairing it with a stop loss brings this behaviour much closer to reality.
On timeframes, 1H and above is the comfortable zone. Drop it on the 5-minute and signal count goes up, but the performance readout ignores fees and spread in the first place, so the faster you churn, the further the numbers drift from reality. It isn’t much of a scalping tool. Day trading through swing trading is the sweet spot, and on the daily it works fine as a directional check for position trades.
How Much Should You Trust the Performance Numbers?
Let’s be straight about this part. The figures in the Performance Dashboard are calculated under fairly idealised conditions. Specifically, these are the assumptions baked in.
- Fees, spread and slippage are not included at all
- Entry price is the close of the signal bar, whereas in reality you can only get in after that bar has closed
- PNL % is a straight sum of each trade’s percentage return, not a compounded figure
- If stop and target are both touched on the same bar, the stop is counted first
- A trade that finishes at exactly breakeven is not counted as a win
The fourth one is actually an honest design choice, since it stops the results from flattering themselves. Overall, though, the right way to hold these numbers is not as an absolute expectancy but as a relative yardstick for judging whether setup A beats setup B. A PF of 1.8 here does not mean you’ll print money live.
“Signal Forge” is an indicator rather than a strategy, so nothing shows up in TradingView’s own Strategy Tester tab. The results you see are its own internal tally. There’s no position sizing and no equity curve either, so serious testing still means building a separate strategy script.
Repainting and a Few Display Quirks
On the repainting question everyone asks about, signals on closed bars do not disappear or shift position after the fact. There’s no higher-timeframe data being pulled in and nothing referencing future values, so this side of it is clean.
That said, on the bar that’s still forming, the read updates continuously off the live close, so orbs can appear and vanish in real time. That’s normal behaviour for anything built on closing prices, but jump in the second one lights up and you can end up holding a position from a signal that was gone by the bar close. Waiting for the candle to close is the baseline rule here.
Each signal draws two lines and one win rate label, and lines and labels are each capped at 500. Load a long history and the lines and labels from older signals drop off, though they’re still counted in the dashboard totals. That’s why the older orbs look bare or have no line attached.
One more small thing: the stop loss, take profit and trailing stop lines don’t appear yet on the bar where the signal fires. They start drawing once the next bar forms, so don’t panic if the levels aren’t there the instant a signal prints.
Pros and Cons
Strengths
- Testing 11-filter combinations takes one checkbox
- Standalone win rates sit on the same screen, so judging fit is quick
- Every settings change lands in the results instantly
- Mean-reversion tools are normalised to trend logic, so the combinations mesh
- ATR-based exit levels are visible on the chart
- No repainting on closed bars, behaviour is predictable
- Orbs sit off price and never cover the candles
Weaknesses
- Fees and slippage are absent from the performance tally
- No built-in alert conditions, which makes running it on notifications awkward
- Any mode can satisfy long and short conditions at once
- Trend-following by nature, so fakeouts pile up in ranges
- Stack too many filters and signals dry up almost completely
- The dashboards take up a lot of screen real estate
- Results shift with every combination, which tempts you into hunting for pretty numbers
How Not to Use It
The scariest failure mode with “Signal Forge” is finding the combination with the highest win rate and deciding that’s the answer. Between toggling 11 filters and tuning each one’s parameters, the number of possible configurations is enormous. Picking whichever one fits the past chart best is, put plainly, reverse-engineering an answer out of history.
Even if you turn up a combination showing a 90% win rate, it means nothing if the trade count is five. Always read Total Trades alongside it and check whether the result came from a meaningful sample. Then take whatever you found and test it on another timeframe and another symbol. If it only works in one place, it was luck.
It’s also worth avoiding the habit of letting this one tool make the whole decision. All 11 filters can be aligned and it still changes nothing about the fact that price is sitting right under a recent high, or that a major data release is minutes away. Read it alongside the things it can’t see: levels, volume, and the higher-timeframe direction.
Pairing It With Other Indicators
Since “Signal Forge” is itself a confluence tool, anything you add on top should cover a perspective it doesn’t already have.
| What to add | What it covers | How to use it |
|---|---|---|
| Horizontal levels and S/R tools | What the price zone means | Check the signal isn’t firing right underneath a key level before entering |
| Volume tools and volume profile | How much participation is behind the move | Skip breakout signals that come without volume |
| Higher-timeframe trend reads | The bigger picture | Skip signals fighting the daily trend, or take profit sooner on them |
| Fibonacci | How deep the pullback is | Prioritise signals that land on a retracement level |
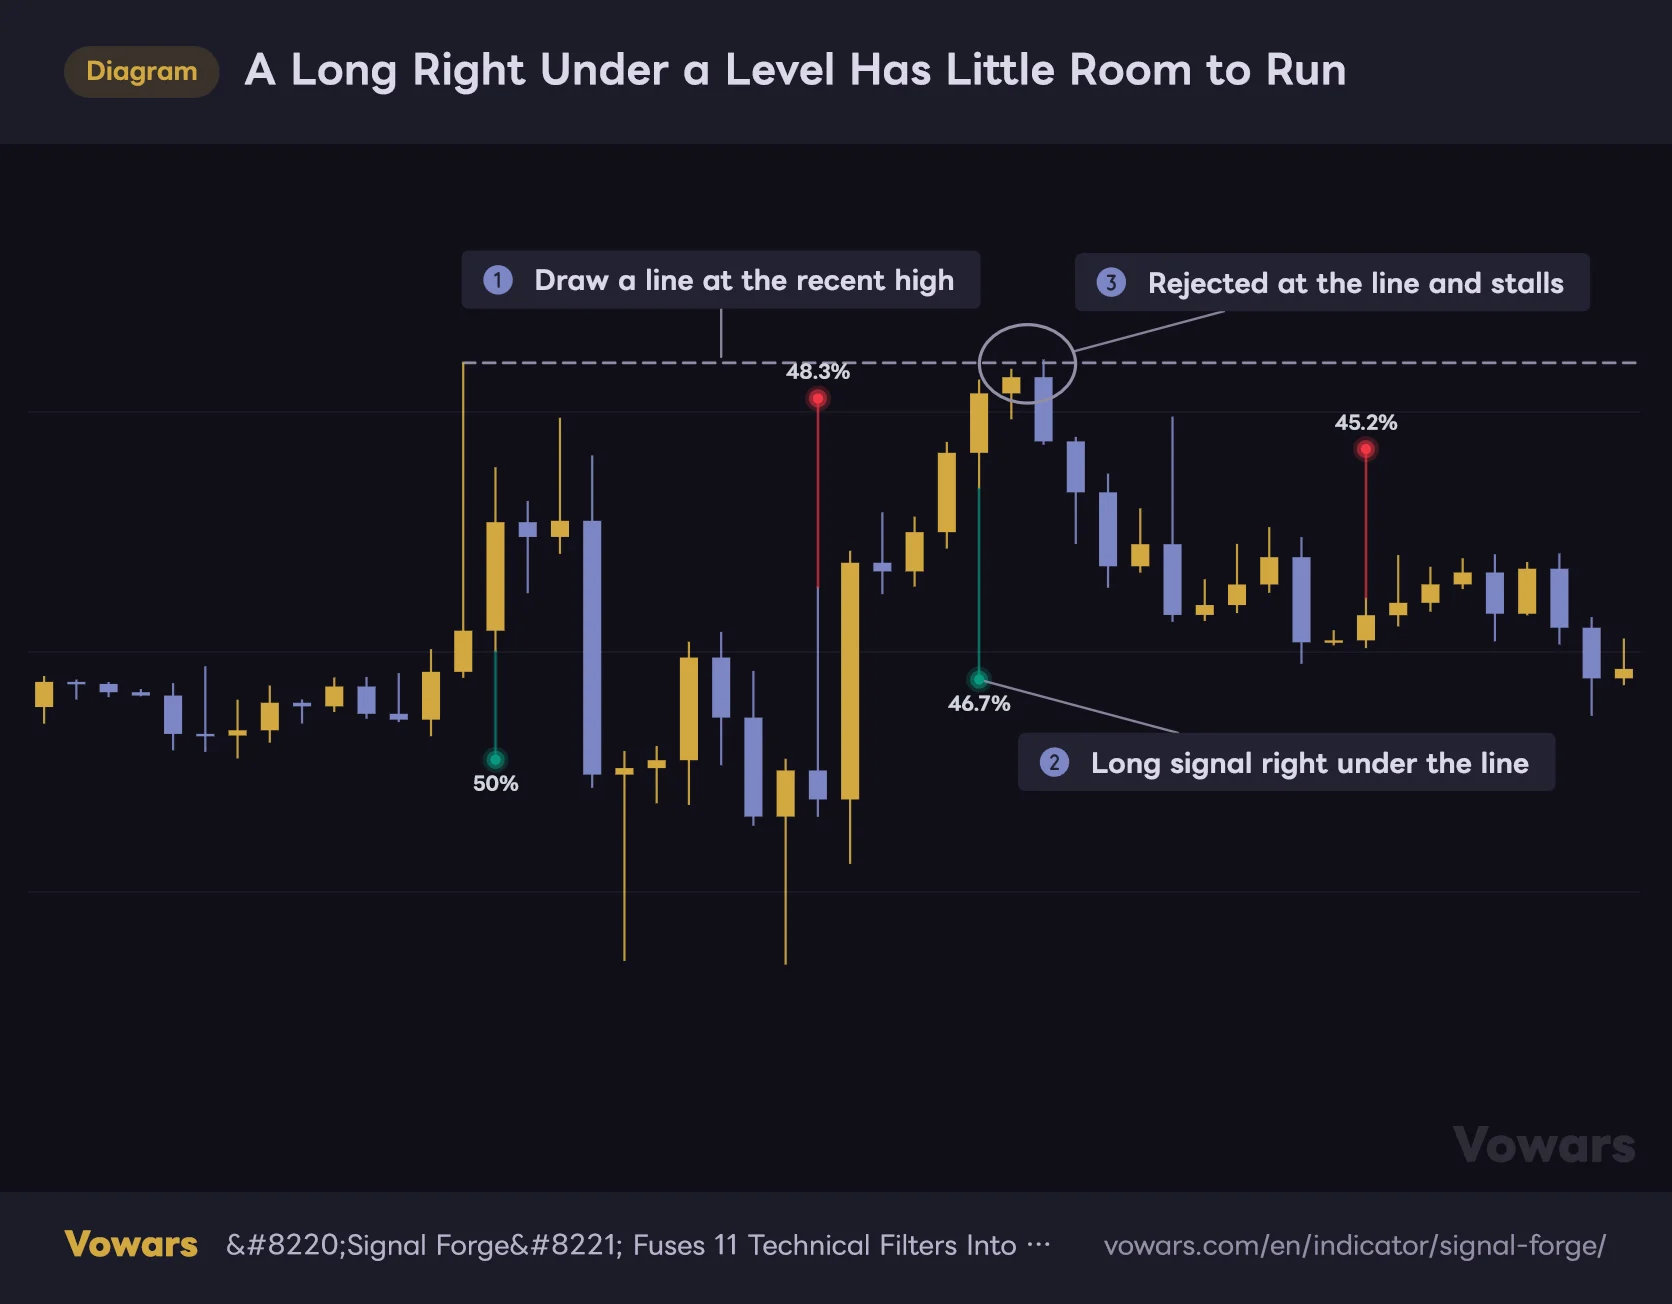
Of these, the one I’ve found pairs best is a plain horizontal line. “Signal Forge” only looks at which way its filters are pointing, so it will happily fire a long with a recent high sitting right overhead. One horizontal line covers that blind spot.
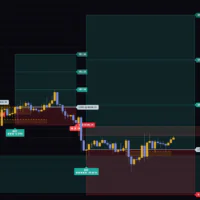
A Long Right Under a Level Has Little Room to Run
"Signal Forge" doesn't look at price levels, so a single horizontal line at the recent high makes it much easier to judge signal quality.
Vowars DE ver.3.11.0
When a signal fires, check for levels above and below first. That alone steers you clear of a lot of “signal prints right at the top” moments like the one above.
What isn’t worth much is adding MACD or RSI to the chart separately. They’re already running inside the tool, so all you’re doing is crowding the screen.
Who This Is For
This suits anyone who wants to build their own multi-filter rule set but keeps stalling on the testing grind. It handles the confluence checks and the performance tally for you, which cuts the distance between an idea and something you can actually look at down to almost nothing. If you’ve worked with the standard technical toolkit before, there’s a lot to play with here.
What it won’t do is hand a profitable system to someone looking for signals to follow blindly. Out of the box it’s a moving average cross, and the process of tuning it is the product. Treat it as a tool that speeds up testing rather than a tool that gives you answers, and you’ll get the most out of it.
Is “Signal Forge” Worth a Slot on Your Chart?
“Signal Forge” is an indicator that takes the normally tedious job of designing and testing filter combinations and reduces it to clicking checkboxes. The standalone win rate column in the Indicator Dashboard is especially handy for getting a fast read on the character of whatever symbol and timeframe you’re on, and there isn’t much else that does the same job. No repainting on closed bars is reassuring too, for a tool with this much going on.
The catch is that the performance figures are a simplified tally with no fees or slippage, and there are no alert conditions built in. It’s a tool for gathering the inputs to a decision, not a finished trading system. That’s my honest read after spending real time with it.
Even so, the value of something that answers “what happens if I combine this filter with that one” in a few seconds, in numbers, is real. If you’re building out your own rule set, or you want to check whether the combination you already trade is genuinely doing anything, there’s plenty of reason to keep this one loaded.
When you use “Signal Forge”, look at trade count before win rate, and check whether the setup survives on other timeframes. Building those two habits alone takes your use of this indicator up a level.