

“Adaptive Head and Shoulders Detector” hunts the pattern at four sensitivities at once
Head and shoulders is the first name anyone reaches for when talking about topping patterns. Going out and finding one on a live chart is another matter. Change your mind about which bar counts as a peak and the whole shape changes, and half the time you spot it the right shoulder is already behind you.
 Image
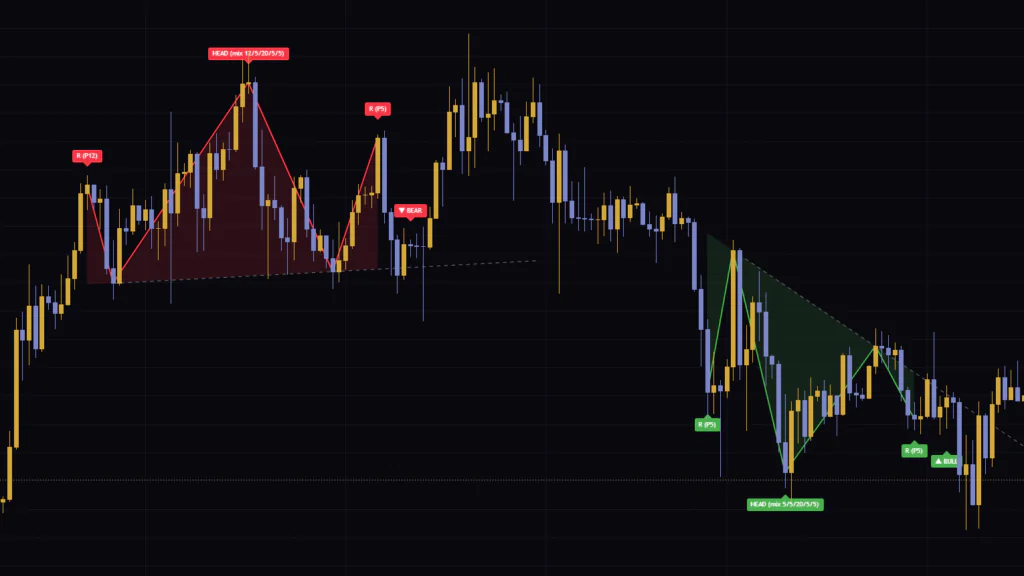
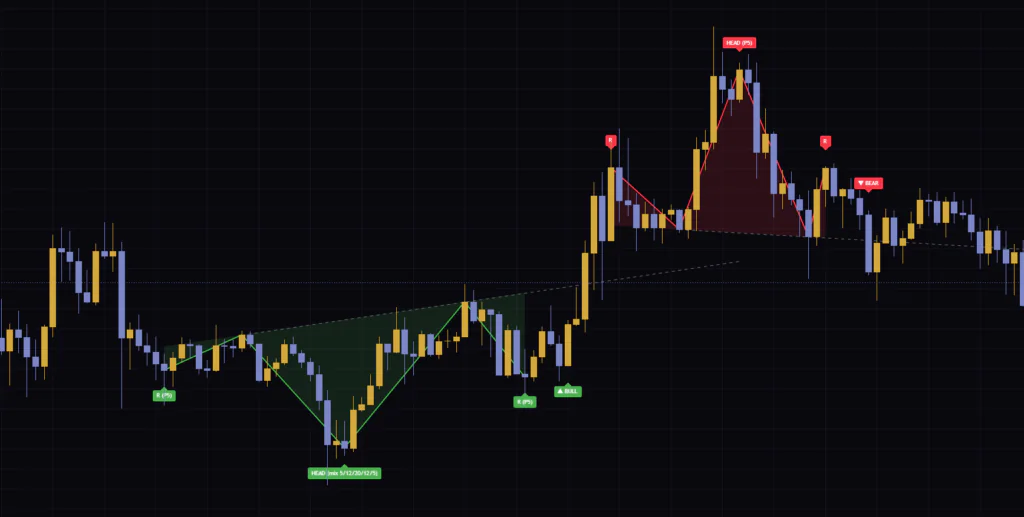
Image“Adaptive Head and Shoulders Detector” runs that question — which bar counts as a peak — four different ways at once, and draws only the shapes that clear its conditions. It comes from Uncle_the_shooter and is published as an open-source script.
My first impression after loading it was that it draws far less than I expected. Zigzag-based pattern tools usually flood the screen with lookalikes. This one carries a mechanism that skips a shape when the move leading into it was weak, however tidy the formation looks, and the count that survives is genuinely small. Run it without knowing that and it just looks unresponsive, so let us start there.
“Adaptive Head and Shoulders Detector” finds head and shoulders and inverse head and shoulders formations on its own, then draws the five-point polyline, the neckline and a BULL or BEAR signal. Every threshold is expressed as a multiple of ATR, so when you switch instruments or timeframes the whole measuring stick stretches and shrinks by the same ratio.
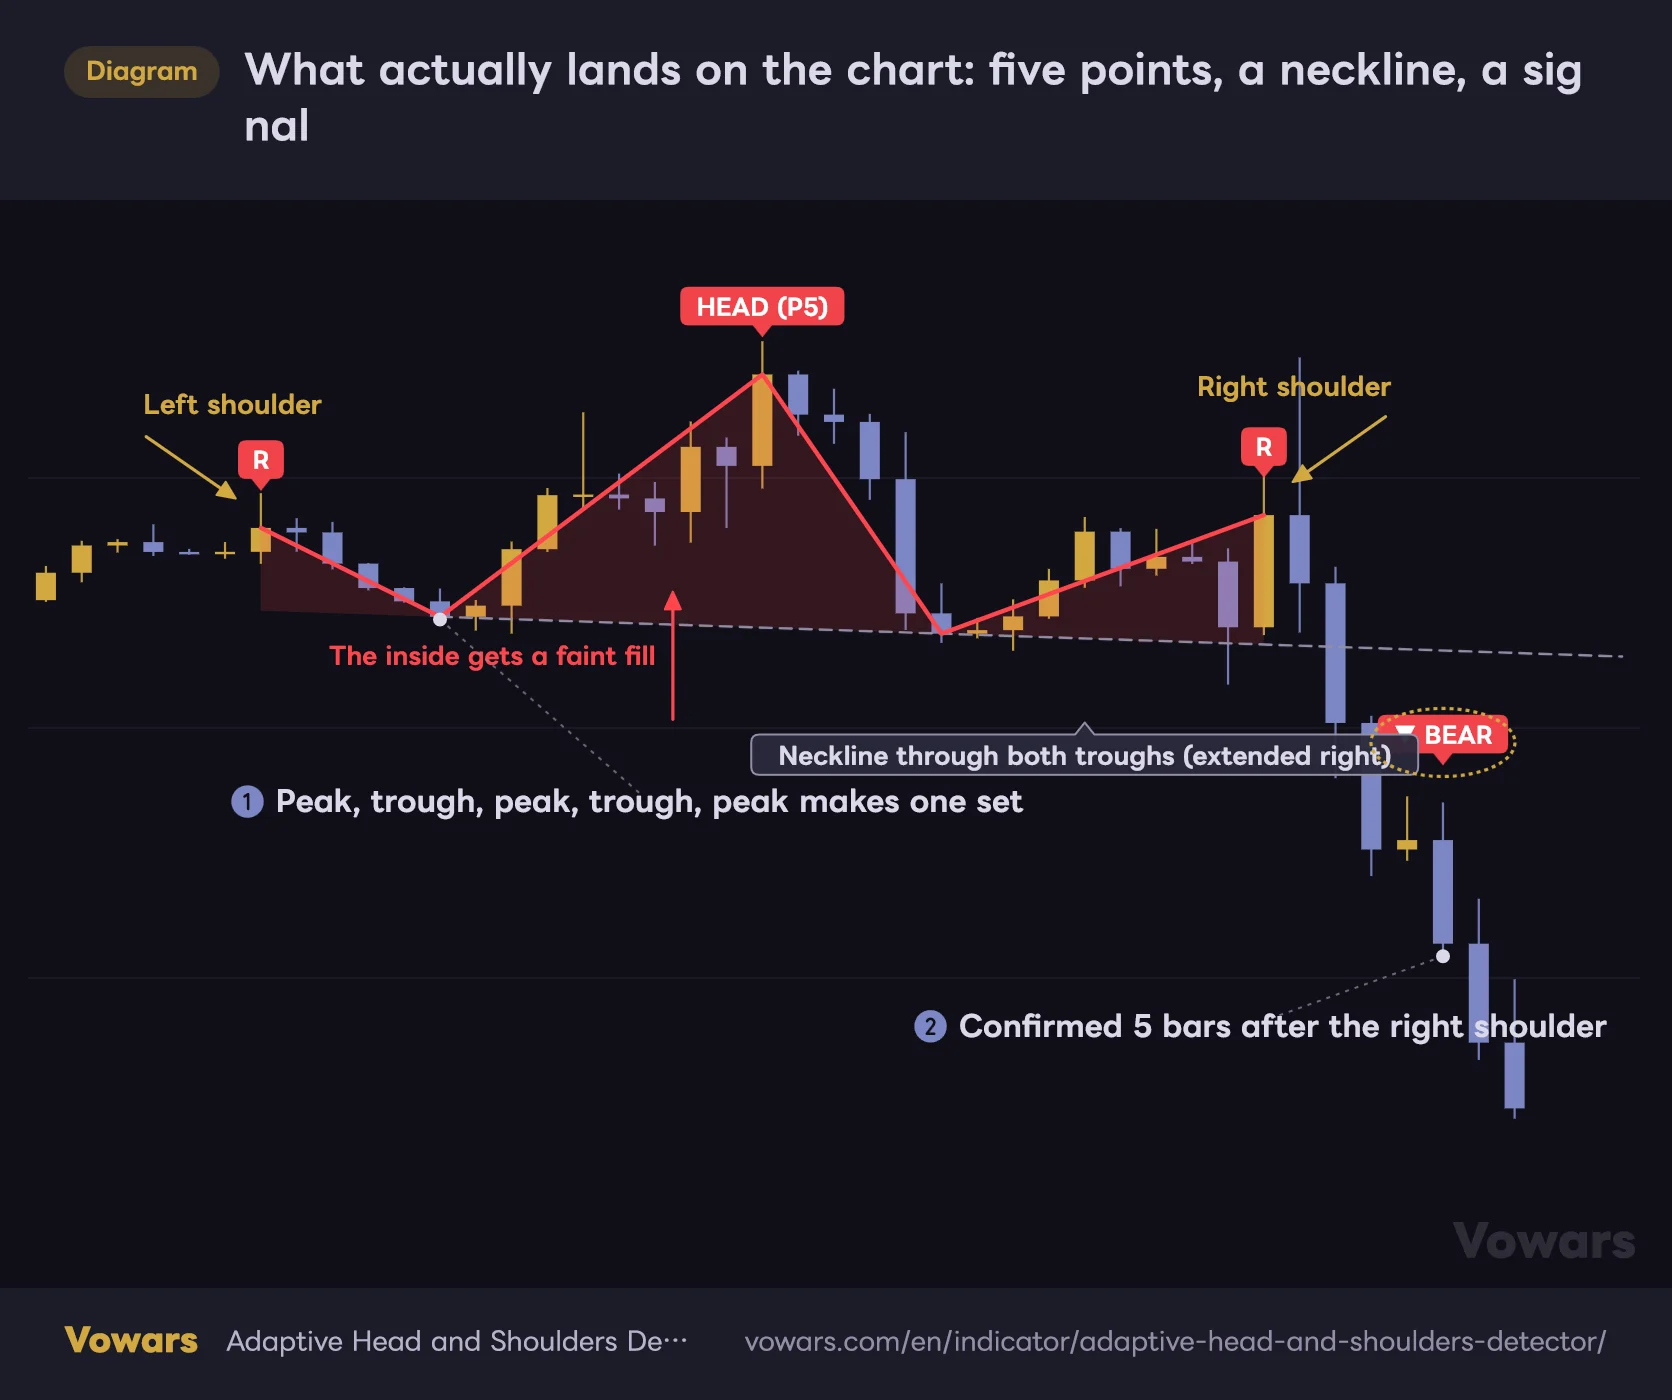
What actually lands on the chart: five points, a neckline, a signal
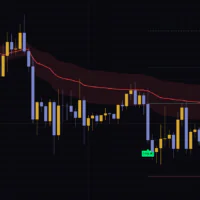
A polyline from the left shoulder to the right shoulder, a dashed line through the two troughs, a faint fill inside. The ▼BEAR tag drops on the bar where the right shoulder gets confirmed.
Vowars DE ver.3.5.0
Reading what shows up on the chart, one piece at a time
There are not many pieces to learn. Once they click you read the whole thing at a glance, so let us take them in order.
1The polyline joining the five points
It joins the five points — left shoulder, trough, head, trough, right shoulder — with a width-2 line. Topping formations come in red, inverse ones in green, and you change those in Bear color and Bull color. If the lines blend into your candles, fix this first and everything else gets easier.
2The labels on the head and both shoulders
The head carries a HEAD label and both shoulders carry an R. What you want to read is what sits inside the brackets on HEAD. “HEAD (P5)” means the shape was built from pivot length 5 alone. “HEAD (mix 5/12/12/5/5)” means mix mode assembled it, and the numbers list which length found each of the five points from left shoulder to right. In mix mode the shoulder labels carry their source too, like “R (P5)”.
3The neckline through the two troughs
A straight line runs through the two inner points — the two troughs on a topping formation, the two peaks on an inverse one — drawn as a grey dashed line. It extends 20 bars to the right by default, and Extend neckline to the right (bars) changes that. The inside of the pattern gets a light fill, and at the default 85 in Fill transparency (%) it stays very subtle.
4BULL and BEAR on the confirmed bar
Once the conditions line up, a “▼ BEAR” or “▲ BULL” label lands on that bar. The fact that this bar sits somewhere other than the right shoulder is the single most important thing to understand about the tool. There is a whole section on it further down.
HEAD and R labels are pushed a little away from the points themselves. The distance comes from Label offset from price (x ATR), and the default of 0.5 is half an ATR. The more volatile the instrument, the further they drift automatically, so on low-range symbols where they sit too far out, dropping to 0.2 or 0.3 pulls them back over the point.
Looking like an H&S is not enough. Three yardsticks do the cutting
Five alternating peaks and troughs will give you something that looks like a head and shoulders all day long. This indicator then measures three conditions and throws out whatever fails.
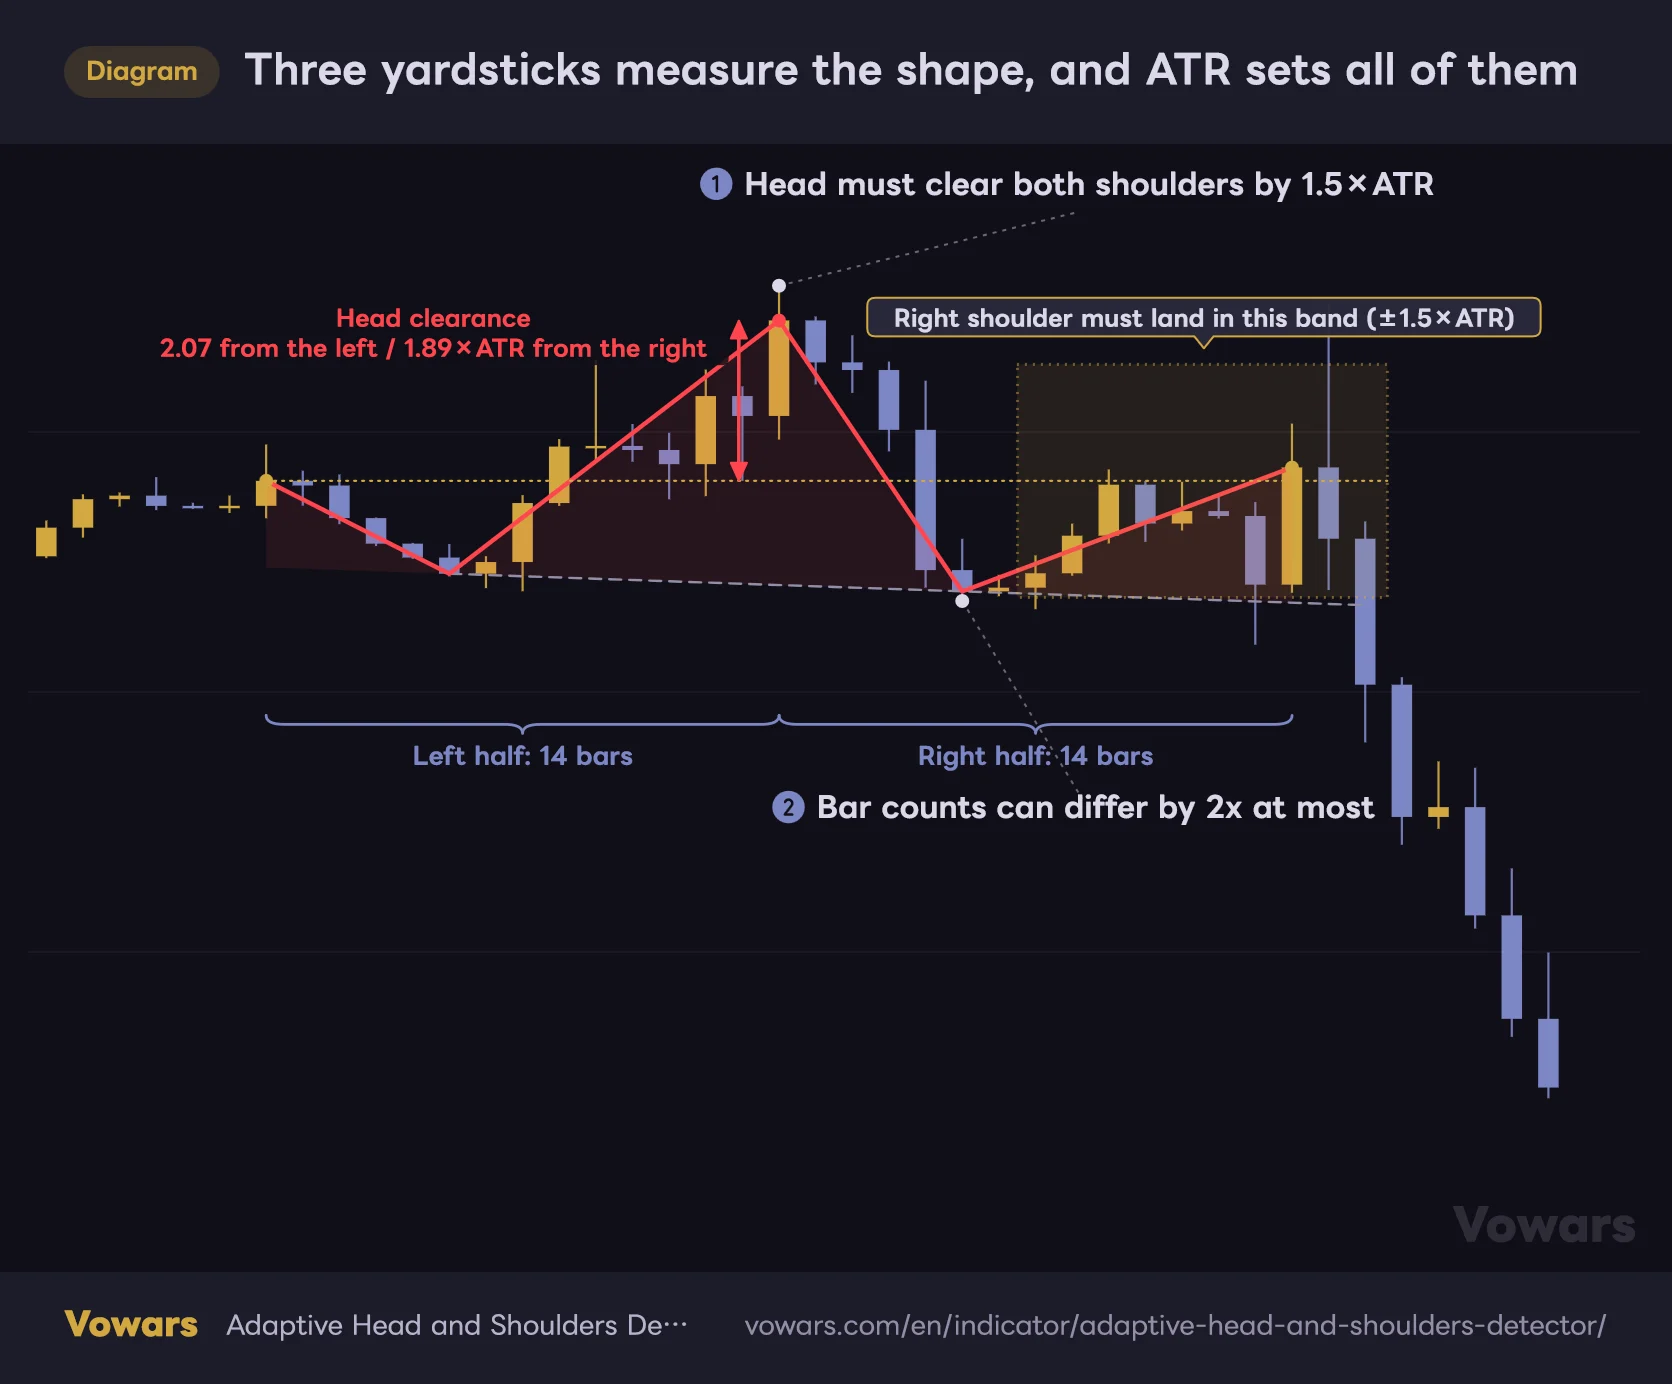
Three yardsticks measure the shape, and ATR sets all of them
How far the head sticks out, how level the two shoulders are, how balanced the two halves are in time. The first two are judged in multiples of ATR.
Vowars DE ver.3.5.0
Here is what gets measured. All of it runs on multiples of ATR rather than fixed price distances, so when volatility expands the requirements expand with it.
| Yardstick | What it measures | Default (pivot length 5) | What happens if it fails |
|---|---|---|---|
| Head clearance | Price gap from the head to each shoulder | At least 1.5×ATR on both sides | Shallow peaks get ignored as just three bumps |
| Shoulder difference | Price gap between the two shoulders | Within 1.5×ATR | Shapes with one shoulder far out of line drop out |
| Time ratio | Bar count left shoulder to head against head to right shoulder | Within 2.0x | Shapes that drag on one side drop out |
On top of those three, it checks how the five points sit relative to each other. On a topping formation both shoulders have to be above both troughs, and the head above both troughs as well. Obvious enough, except that grabbing any five zigzag points can break exactly that, so the check earns its place.
The two troughs do not have to be level, and if they sit far apart the neckline gets drawn at whatever angle that produces. When the tilt is steep, the extended part shifts with every bar, so the break level travels further than it looks. Expect a textbook horizontal neckline and this is where it feels off.
Without a run-up into it, even a clean shape gets passed over
This is the part I came away most impressed by. A head and shoulders is supposed to be a market that rallied and then turned, so without that rally in front of it the shape means very little. The condition is built in.
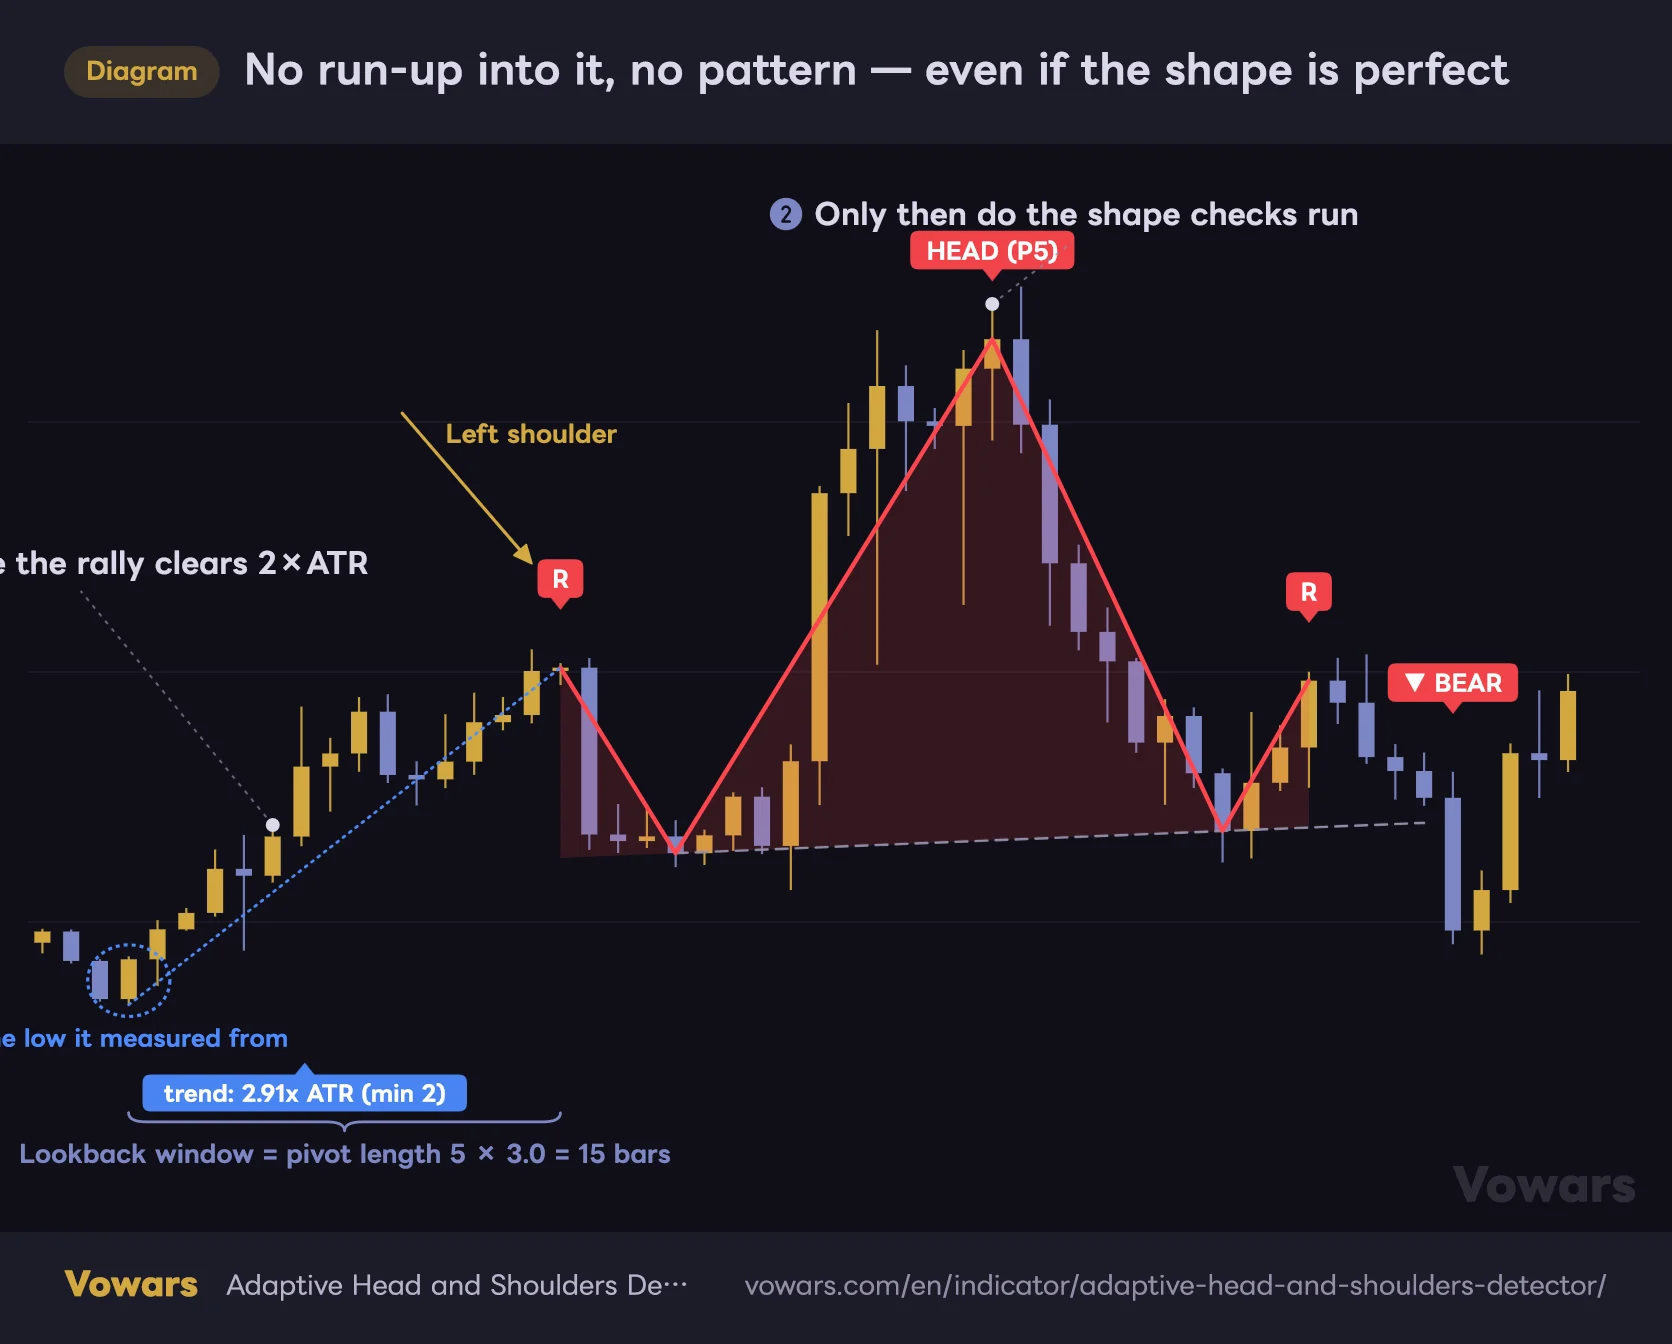
No run-up into it, no pattern — even if the shape is perfect
It looks back 15 bars from the left shoulder for the furthest high or low, then checks whether the move from there into the left shoulder is worth at least 2 ATRs.
Vowars DE ver.3.5.0
It walks back a fixed number of bars from the left shoulder and hunts for the furthest low inside that window on a topping formation. Then it measures the distance from there up to the left shoulder in ATRs, and if the result falls under the 2.0 default in Min. trend impulse before pattern (x ATR), the shape is not treated as a pattern no matter how perfect it looks.
How far back it walks comes from Trend lookback window (x pivot length). The default of 3.0 with pivot length 5 gives 15 bars. Pivot length 20 gives 60 bars, so bigger formations are asked for a longer run-up and smaller ones for a shorter one, scaled in proportion.
Switch on Show trend visualization (line to extreme) and a dotted line connects the high or low it measured from to the left shoulder, with the reading printed in ATRs. Add …also for patterns that did NOT pass the trend filter and the shapes that matched structurally but failed on run-up show up in orange as well. When you are dialling in the threshold, turning both on for a while and eyeballing real numbers is by far the fastest route.
If you want the condition gone, set that 2.0 default to 0. At 0 the run-up check stops running altogether, and the dotted overlay stops appearing with it.
One setting moves the signal bar wholesale
This is the setting that affects live trading most. Require neckline break confirmation is off by default, and in that state the signal prints on the bar that confirms the right-shoulder pivot. Switch it on and it waits for a bar that closes through the neckline.
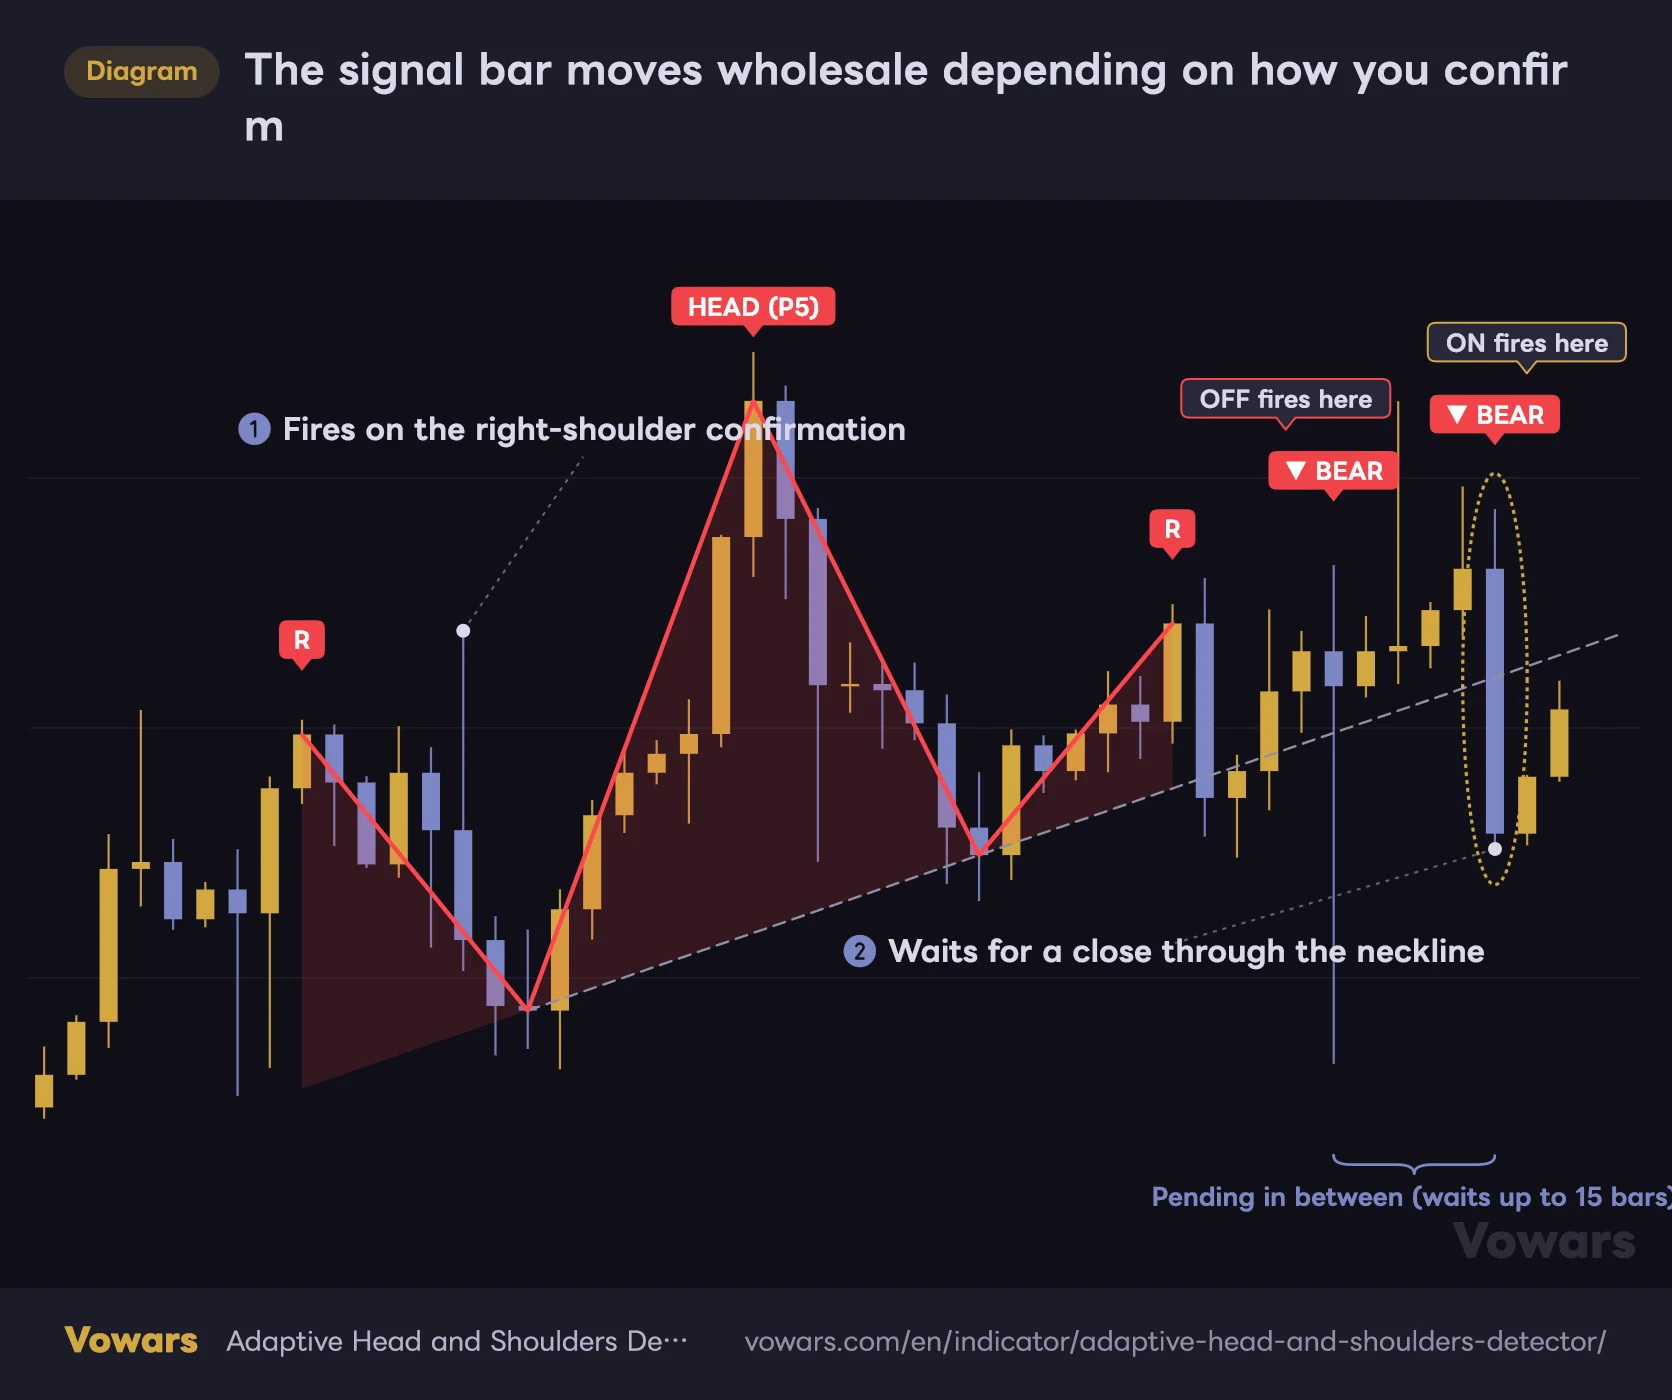
The signal bar moves wholesale depending on how you confirm
Left on the default, the signal prints on the bar that confirms the right shoulder. Turn on neckline-break confirmation and it waits for a close through the line.
Vowars DE ver.3.5.0
On the same formation, the signal bar moves by five bars. Off if you want to know early, on if you want the confirmation, and neither one is the right answer. What you do give up with it off is that a shape which confirmed a right shoulder but never broke the neckline still keeps its signal, and the misses go up accordingly.
With it on, there is a limit on how long it waits. The 3.0 default in Max. wait time for breakout (x pivot length) with pivot length 5 gives 15 bars, and if no close gets through in that window the shape is discarded. Discarded shapes are never drawn, which means with confirmation on, every pattern you can see has already broken.
The neckline break is judged on the close of a completed bar and nothing else. Price poking through mid-candle never fires it. With confirmation off, though, the read can change as the current bar moves, so a signal you see before the bar closes may not stay. Once a bar is closed, whatever got drawn on it stays put.
Four pivot lengths means four resolutions on the same chart
Pivot length is how many bars either side a candle has to beat before it counts as a peak or a trough. At 5 a bar is a peak if it tops the five bars on each side, at 30 it needs to top thirty. The bigger the number the fewer you get, and what remains are the turns that actually mattered.
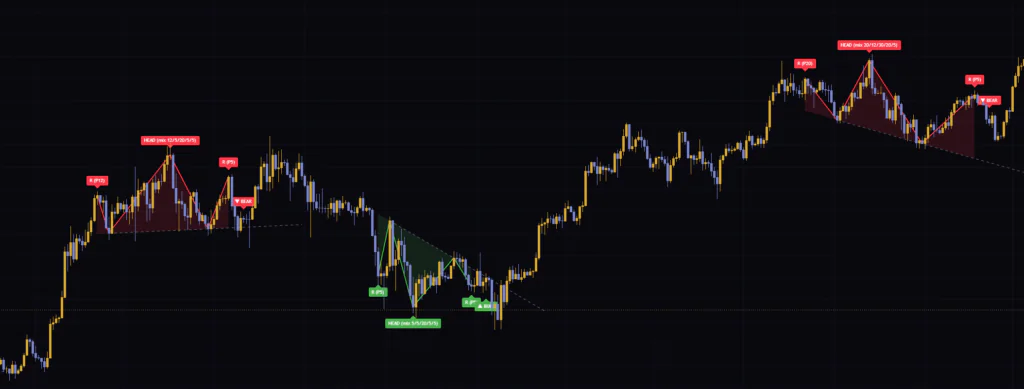
This indicator runs four of those at once. Here are the defaults, and you can see that the longer yardsticks are handed wider tolerances. That matches reality — the bigger the formation, the less likely the shoulders line up neatly.
| Setting | Default | Suggested | Effect |
|---|---|---|---|
| Pivot 1 length (left/right) | 5 | 5–8 | The bucket that catches the smallest shapes. If the 1m and 5m charts get busy, either switch this one off or stretch it to around 8 |
| Shoulder symmetry tolerance 1 (x ATR) | 1.5 | 1.0–1.5 | How far apart the shoulders of a small shape may sit. Lower it and only tidy formations survive |
| Min. head deviation 1 (x ATR) | 1.5 | 1.5–2.0 | Floor for head clearance. Raise it and only heads that clearly stick out remain |
| Pivot 2 length (left/right) | 12 | 10–15 | The middle bucket, well matched to daily swings. On 4H and daily charts it tends to do most of the work |
| Shoulder symmetry tolerance 2 (x ATR) | 3.0 | 2.0–3.0 | Shoulder tolerance for the middle bucket. The default is generous, so tighten toward 2.0 if you want fewer hits |
| Min. head deviation 2 (x ATR) | 1.5 | 1.5–2.0 | Floor for head clearance in the middle bucket |
| Pivot 3 length (left/right) | 20 | 20 | The bucket for multi-month structures. Rarely gets a turn on short timeframes |
| Pivot 4 length (left/right) | 30 | 30 | The largest bucket. Comes alive on weekly and monthly charts |
| Min. trend impulse before pattern (x ATR) | 2.0 | 1.5–2.5 | How much run-up is demanded. 0 disables it. The first value to touch when hits are too rare |
| Trend lookback window (x pivot length) | 3.0 | 2.5–4.0 | How far back it hunts for that run-up. Widen it and distant highs and lows come into play, so the check passes more often |
| Max. time asymmetry (b1→head vs head→b5) | 2.0 | 1.5–2.0 | Cap on the bar-count ratio. Drop it to 1.5 and only near textbook symmetry survives |
| Require neckline break confirmation | Off | On | Whether to wait for a close through the line. On means later signals, but no shapes left hanging without a break |
| Max. wait time for breakout (x pivot length) | 3.0 | 2.0–3.0 | Ceiling on how long it waits for the break. Shorten it to keep only breaks with momentum behind them |
| ATR Length | 200 | 50–200 | The base under every tolerance. 200 is a very slow yardstick, so shorten it toward 50 if you want it tracking current volatility |
| Pivot source | Close | Close | Whether pivots come from closes or wicks. On instruments with long wicks this changes the output a lot |
| Fill transparency (%) | 85 | 85–95 | How heavy the fill is. Raise it when overlapping patterns make the chart hard to read |
With four running together you would expect the same top to get drawn two or three times over. That is handled. Patterns in the same direction are kept from overlapping. A new shape only counts if it starts after the right shoulder of the last one drawn. That bookkeeping is shared across all four buckets and mix mode, so one top gives you one drawing. Longs and shorts are tracked separately, so a bullish shape and a bearish shape can sit close together.
Mix mode is a fifth hunter with its own rulebook
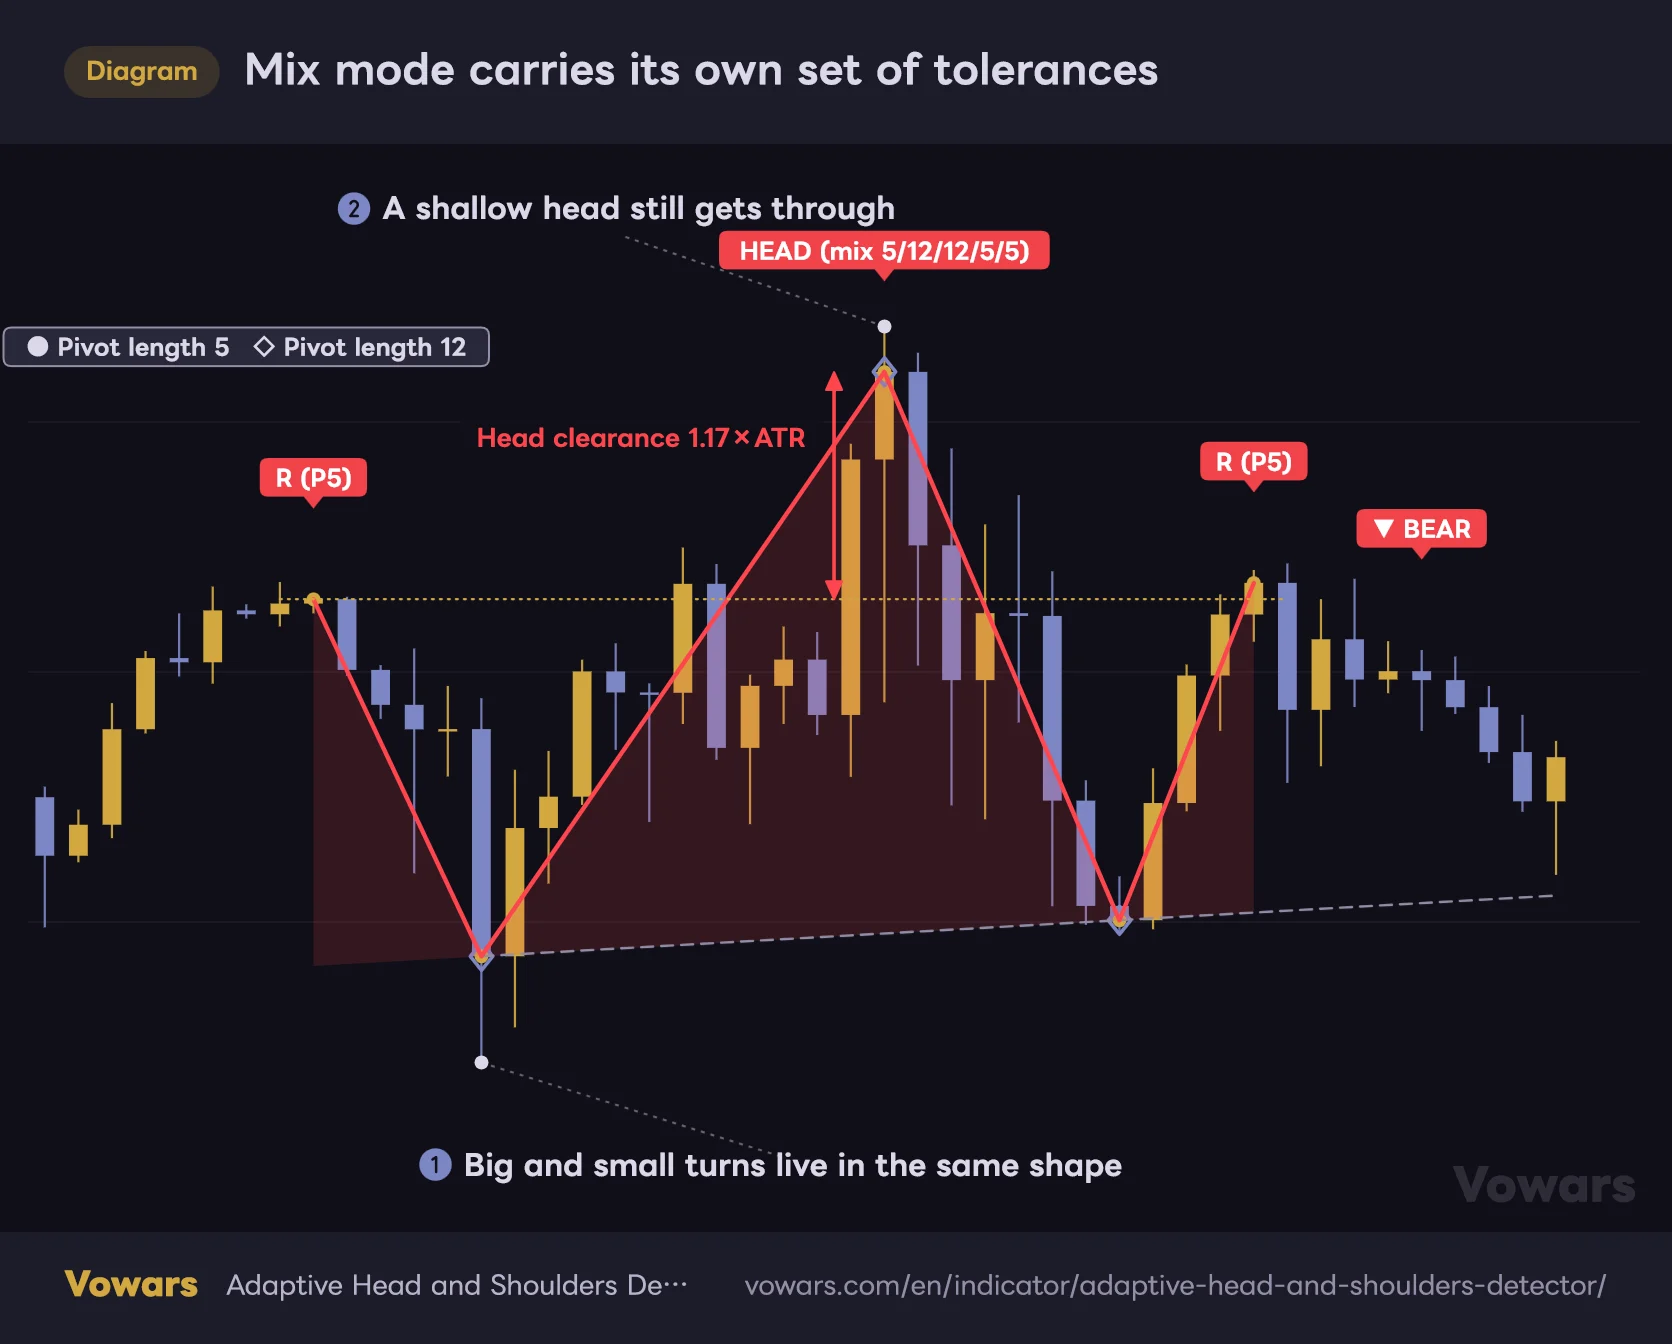
Mix mode pools the turns found by all four buckets into a single history and assembles five points out of it. The interesting bit is that it carries tolerances reserved for itself. Shoulder difference sits at 2.0×ATR and head clearance at 1.0×ATR, so only the head requirement is looser than the 1.5×ATR a single bucket asks for.
Mix mode carries its own set of tolerances
It is not only the pivots that get mixed. Head clearance and shoulder symmetry run on tolerances reserved for mix mode.
Vowars DE ver.3.5.0
Which means mix mode also picks up the shapes that were too shallow for any single bucket. Useful when you want more hits, at the cost of some formations where the head is not really doing much. If you would rather only see a head that stands out, raising Min. head deviation (mix, x ATR) to 1.5 or 2.0 is the obvious fix.
The run-up window and the wait for a break both key off the longest pivot length taking part. A shape built from a 5-bar pivot and a 30-bar pivot uses 30 as the reference, so it hunts 90 bars back for the run-up. Judgements can be running on a far bigger scale than you assumed.
The history mix mode draws on is built only from the lengths enabled under Enable pivot 1 through Enable pivot 4. You cannot cut a length out of standalone detection and keep it inside mix. Switch a length off and it leaves both. The author flags the same thing in the script description.
The bottom version is the same thing turned upside down
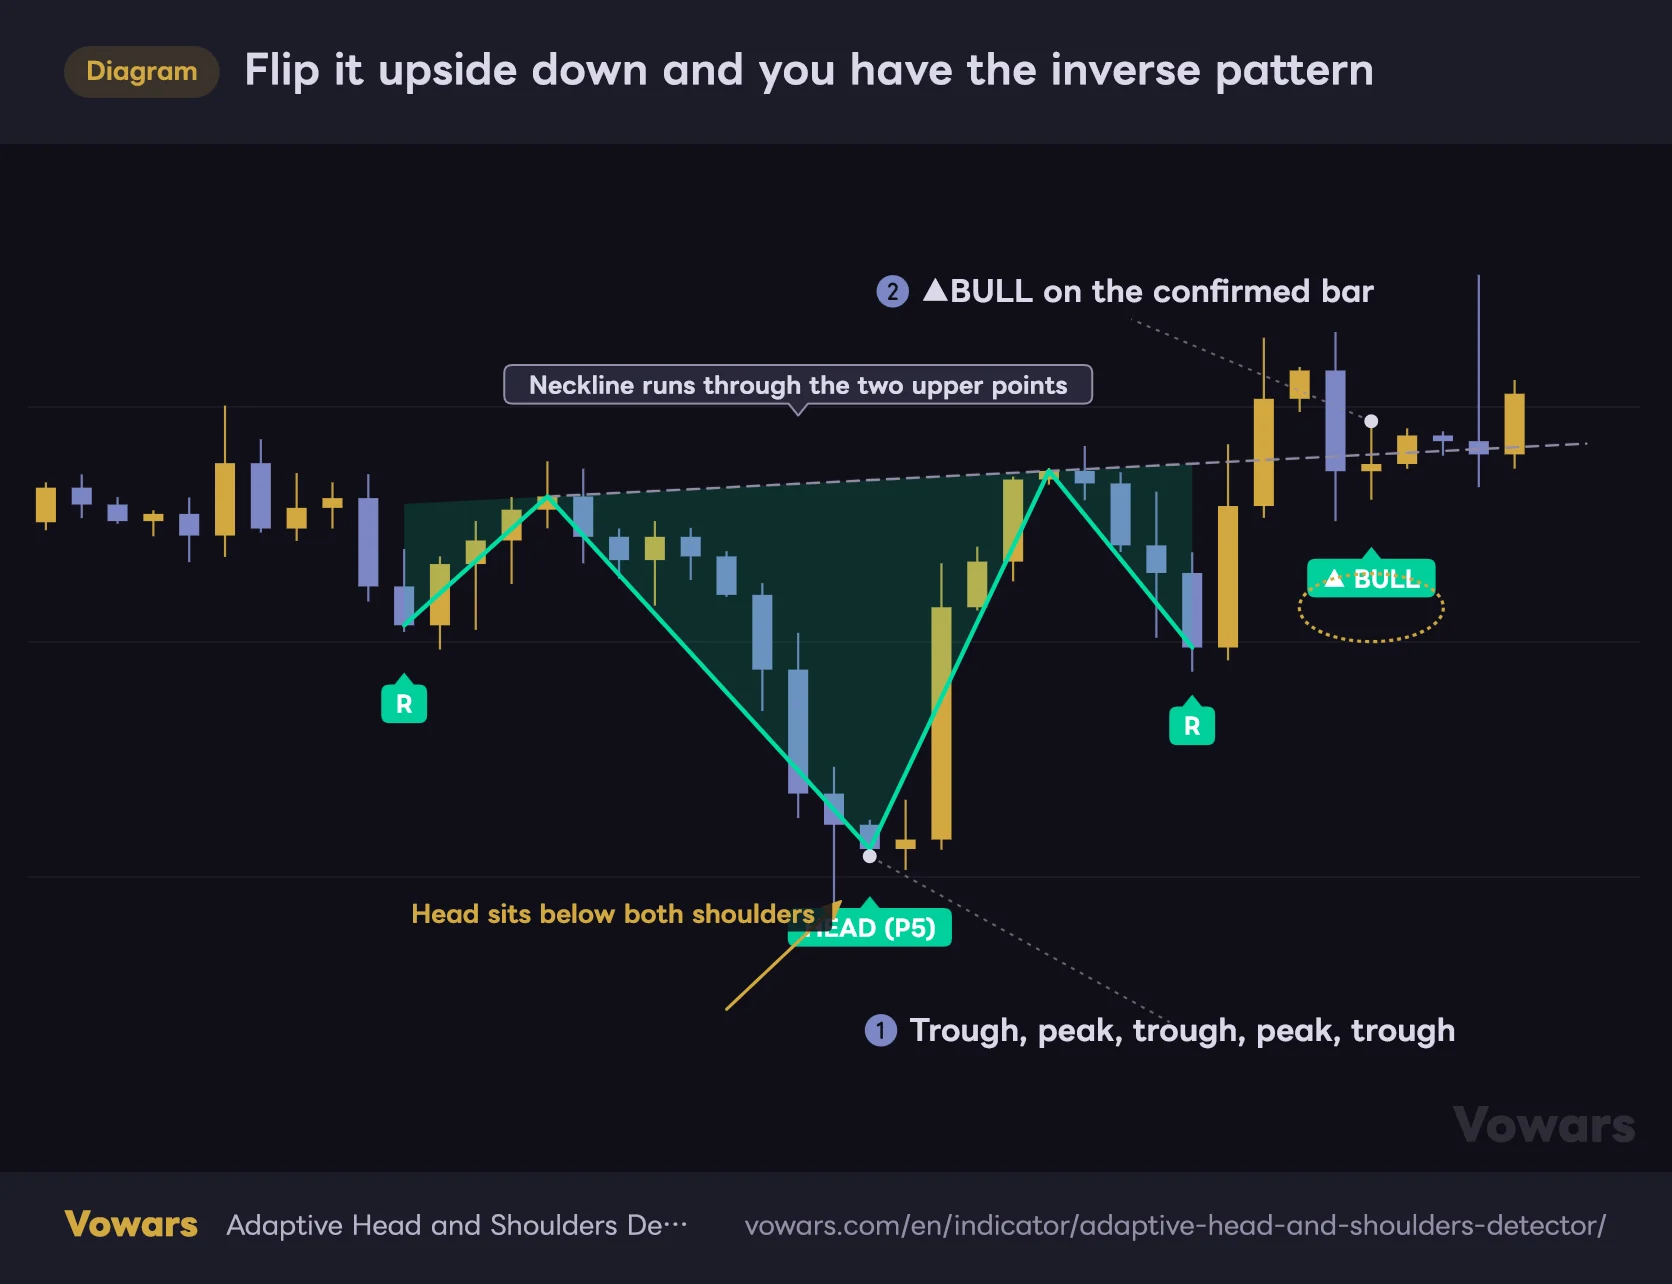
An inverse head and shoulders is judged the same way with the direction flipped. The head drops below both shoulders, the two upper points form the neckline, and what it needs in front is downside momentum. The colour turns green and the signal reads “▲ BULL”.
Flip it upside down and you have the inverse pattern
The head drops below both shoulders, the two upper points become the neckline. The colour switches to green and the signal reads ▲BULL.
Vowars DE ver.3.5.0
On a bottom with break confirmation on, it waits for a close back above the neckline. For how I use it, green signals at the base of a selloff tended to behave better. That is an impression shaped by the market I was watching, though, not something I can put a number on.
Closes or wicks? The setting that quietly changes the output
The one that slips past most people is Pivot source. The default is Close, meaning pivots come from closing prices only. Most zigzag-style tools work off wicks, so this is an unusual default.
Working off closes, a bar with a long upper wick still puts its point at the body. Flip the setting on something like bitcoin, where wicks run in both directions, and patterns appear and disappear on the same screen.
- Close (default) — ignores wicks, so a brief overshoot is less likely to wreck the shape. The neckline lands on bodies too, which lines up with judging breaks on closes
- High/Low (wick) — puts the point on the tip of the wick. If you anchor stops to wick highs and lows, this matches the chart you are already reading
Neither one is better. It is a setting you match to whatever you personally call a high. Switching it changes the output of every pivot length and mix mode at the same time, so if you want to compare, pick one and live with it for a while.
Alerts, and the outputs sitting behind the chart
There are three alerts. Longs only, shorts only, and either direction. Line up the symbols you want watched and go look when a shape forms — that is the natural way to use them.
- Inverse H&S (Bullish) Signal — fires on an inverse head and shoulders
- H&S (Bearish) Signal — fires on a head and shoulders
- H&S / Inverse H&S Signal (Any) — fires on either direction
Alerts fire on whatever confirmation setting you have chosen. With break confirmation on it is the bar that closes through, with it off it is the bar that confirms the right shoulder. Set alerts without that in mind and the market will be somewhere other than you pictured when the notification lands.
The script carries values for the long signal, the short signal and the pivot length behind each signal, published as hidden outputs. They are not drawn on the chart, but the doorway for anyone who wants to convert it into a strategy and test it is there from the start. Signals from mix mode are tagged with the value 999.
It pairs best with a line that calls direction
This indicator reads shape and nothing else. It does check the run-up, but that is a local look at whether anything happened just before the left shoulder, not a read on where the market as a whole is pointing. Cover that gap and the quality of what you keep changes noticeably.
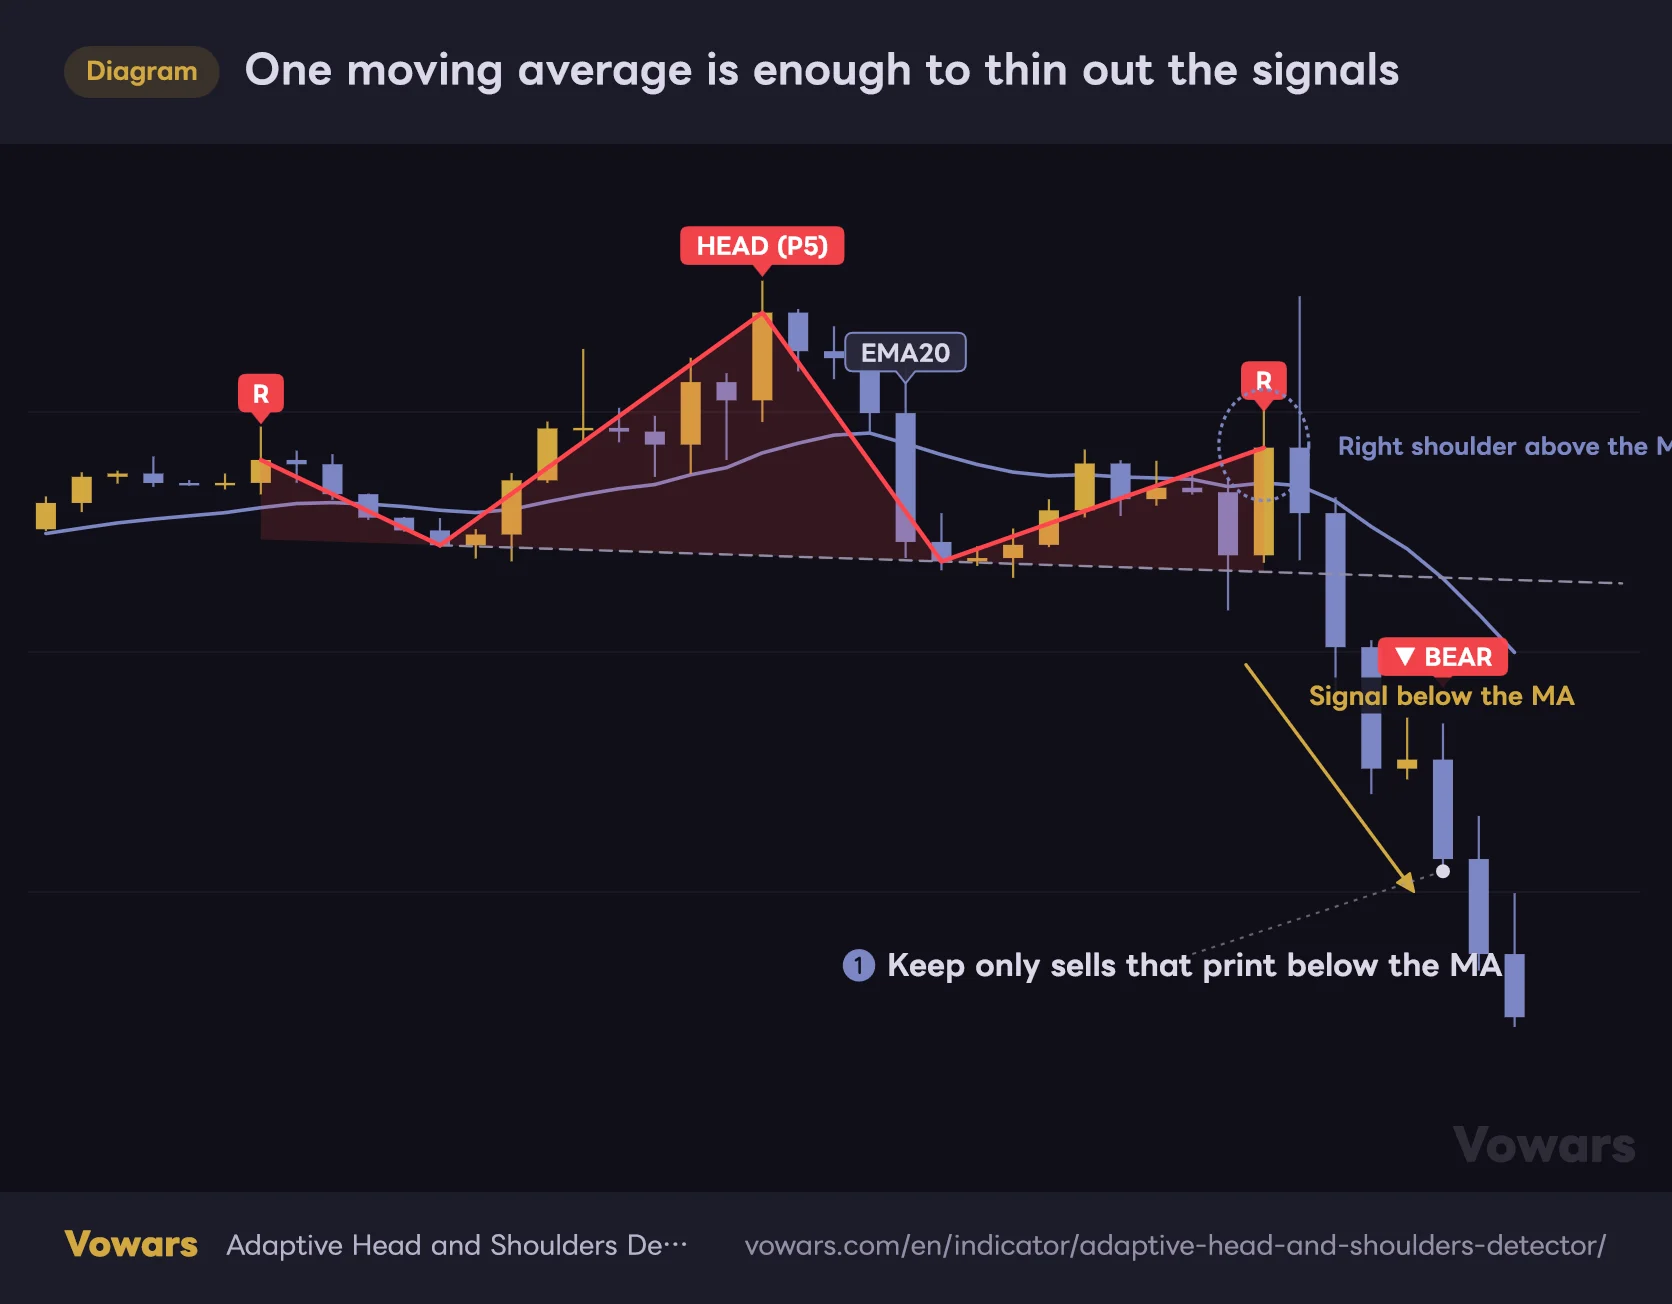
One moving average is enough to thin out the signals
Above the average at the right shoulder, below it when the signal prints. Keep only the calls that agree with the line.
Vowars DE ver.3.5.0
Where I settled was adding a single moving average. Short signals count only when they print below the line, long signals only above it. That alone lets you ignore most of the alternating shapes that show up inside a range.
A few other things pair well. All of them work as the thing that decides whether to take a shape, not whether the shape itself is any good.
| What to pair it with | Job it does | How to use it |
|---|---|---|
| A single EMA | Direction check | Take or skip the signal based on which side of the line the bar sits |
| Volume | How serious the break is | Check whether the bar that broke the neckline traded above its usual volume |
| Higher-timeframe levels | Where price is likely to stall | If a higher-timeframe level sits beyond the neckline, plan for a shorter run |
| Oscillator divergence | Momentum behind the head | Check whether the indicator failed to follow price into the new high |
What it does well, and where it struggles
Where it earns its keep
- Every threshold runs on ATR multiples, so you can move between instruments and timeframes without rebuilding the settings
- Four scales are watched at once, so a large daily formation and a small 1H one get caught on the same configuration
- Pivot length sits right there in the label, so the scale of what you are looking at is obvious
- The run-up requirement keeps it from mass-producing lookalikes inside a range
- Neckline breaks are judged on closed bars only, so mid-candle overshoots do not jerk it around
- Same-direction patterns are kept from overlapping, so the chart never fills with duplicate drawings
Where it will trip you up
- It waits for pivots to confirm, so the shape always arrives late — by the pivot length
- It has no read on direction. On its own it tells you a shape appeared and nothing more
- On the default it fires on the right-shoulder confirmation, so shapes that never break the neckline still leave a signal
- Nothing caps the neckline angle, and with troughs far apart the break level drifts hard as it extends right
- It only looks at the last five pivots, so a valid arrangement that completed a little earlier never gets considered
- The ATR Length default of 200 is a heavy baseline, and in a market that only turned choppy recently the checks lag reality
Worth knowing before you load it
Whether a tool repaints is the first question anyone asks about pattern detection. There are two separate things going on here.
Confirmed drawings never move, but they show up after the fact
A pattern is only drawn once the right-shoulder pivot is confirmed. The lines are then run back to the left shoulder, which means scrolling through history makes it look like the shape was visible at the time. It was not — it appeared a pivot length after the right shoulder, five bars on the default and thirty on the longest bucket. Lines and labels never move or vanish once confirmed, but you can feel that lag by stepping through with Bar Replay. Do that before you judge anything from historical charts.
Old patterns fall off the chart
TradingView caps how many drawings a single indicator can hold, and once the cap is hit the oldest ones are removed. This script is published with lines and labels set to the maximum, but each pattern eats five lines, four labels and one fill, so on a long history only the most recent hundred or so patterns remain. If you want to count formations going back years, moving up a timeframe or narrowing the visible range is the safer approach.
A shape is a shape, not a trade call
The author states it directly in the script description — a detected formation is not a trade signal and does not mark an entry. It is information that a structure worth watching for a reversal has appeared, and where to get in or out belongs to some other method. I agree with that completely, and selling purely because the neckline broke is not a use I would recommend.
This indicator only looks at the timeframe you have loaded. If you want eyes on higher-timeframe formations at the same time, that becomes a workflow thing — a multi-chart layout with the same symbol on different timeframes, for example. Higher-timeframe patterns will not appear layered onto one chart.
Treat it as the scout, and it earns its slot
 Image
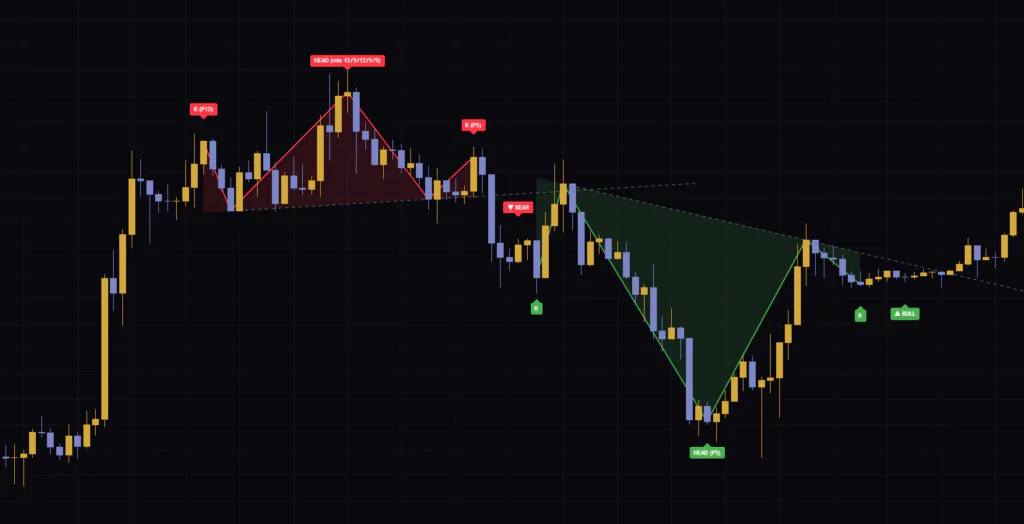
Image“Adaptive Head and Shoulders Detector” takes a classic formation and filters it through ATR-based yardsticks and a run-up requirement. It is not built to rack up hits. It quietly places the ones that clear the bar, and as pattern detection goes it is a notably careful piece of work.
There are only three settings worth touching first. Whether to turn on Require neckline break confirmation, where to put Min. trend impulse before pattern (x ATR) relative to how you read markets, and which pivot lengths to switch off. Settle those and the same configuration carries across instruments.
Hand off the job of finding shapes, and keep the entry and the stop for your own method. That split is the most natural way to run this thing. For what it is worth, I ended up watching the daily and the 4H, and only going in to check by hand when something green or red showed up.